The Experience of
Discrimination in Ireland
Analysis of the
QNHS
Equality Module
Helen Russell, Emma Quinn,
Helen Russell is a Senior Research Officer, Frances McGinnity is a Research Officer and Emma Quinn is a Research Analyst at The Economic and Social Research Institute, Rebecca King-O’Riain is a senior lecturer in sociology at NUI Maynooth. This research has been carried out as part of the Equality Authority/ESRI Research Programme on Equality and Discrimination
The views expressed in this report are those of the authors and do not necessarily represent those of The Equality Authority or The Economic and Social Research Institute.
Copyright is jointly held by The Equality Authority and The Economic and Social Research Institute, Dublin 2008.
ISBN: 0 7070 0264 8
Cover design by form
Printed in Ireland by Brunswick Press
FOREWORD
This is the first report arising from the ‘Research Programme on Equality and Discrimination’ which is being carried out by The Economic and Social Research Institute on behalf of The Equality Authority. This study draws on the first national survey of experiences of discrimination carried out by the Central Statistics Office in 2004.
The Central Statistics Office survey revealed significant levels of reported discrimination. Overall 12.5 per cent of the Irish population aged 18 years and over said that they had been discriminated against in the preceeding two years. This survey provided a valuable benchmark against which to assess progress in combating discrimination. It provided information that raised questions in relation to the adequacy of the current equality legislation and of the level of investment in the existing equality infrastructure to eliminate this reported discrimination. It is important, therefore, that this data be further examined to increase our understanding of this reported discrimination.
Helen Russell, Emma Quinn, Rebecca King O’Riain and Frances McGinnity have applied expertise and insight in their examination of this data. They have provided us with new information on the social characteristics of those at risk of discrimination in different social contexts, on Work-related discrimination by sector and occupation, and on the impact of this discrimination and the responses of those experiencing this discrimination. We are grateful to the authors for their work on this report. We are also grateful to Laurence Bond, Head of Research with the Equality Authority, for his support to this research project.
This report has policy and practice implications that must now be a focus for attention from the relevant authorities and organisations. The unemployed are not covered by the equality legislation but they emerge from this report as particularly vulnerable to exploitation. This suggests the need to review and broaden the grounds covered by the equality legislation. The report highlights that the social groups who report the highest levels of discrimination are the least likely to take action. This suggests the need for increased proactive third party interventions such as information campaigns, advocacy and legal supports. The report also suggests the need for new practice to eliminate discrimination particularly in financial services and accommodation as well as in workplace recruitment.
Niall Crowley
Chief Executive Officer
ACKNOWLEDGEMENTS
We are extremely grateful to Padraig Dalton and the staff of the Central Statistics Office for providing us with access to the Quarterly National Household Survey
CONTENTS
Foreword iii
Acknowledgements iv
Executive Summary ix
CHAPTER 1: INTRODUCTION 1
1.1 Introduction and Background to the Survey 1
1.2 Changing Irish Context 2
1.3 Defining and Measuring Discrimination 3
1.4 Measuring Discrimination Using the Equality Module 7
1.5 Report Plan 11
CHAPTER 2: WHERE DO PEOPLE EXPERIENCE DISCRIMINATION? 12
2.1 Risk of Discrimination Associated with Different Domains 13
2.2 Work-related Discrimination 15
2.3 Groups at Risk of Subjective Discrimination in Accessing Specific 22 Services
2.4 Conclusions 26
Appendix Tables 29
CHAPTER 3: GROUNDS OF DISCRIMINATION EXPERIENCED 31
3.1 Overview of Grounds Reported 31
3.2 Relationship Between Social-demographic Groups and Grounds of 32 Subjective Discrimination
3.3 Relationship Between Domains of Discrimination and Grounds of 37 Subjective Discrimination
3.4 The ‘Other’ Ground and “Multiple Grounds” 39
3.5 Conclusions 41
Appendix Table 42
CHAPTER 4: OVERALL DISCRIMINATION AND GROUPS MOST AT RISK 43
4.1 Vulnerability to Any Form of Discrimination Across Social Groups 43 4.2 Vulnerability to Work-related and Services Discrimination Across Social 46 Groups
4.3 Conclusions 51
Appendix Tables 53
CHAPTER 5: IMPACT AND FREQUENCY OF DISCRIMINATION, ACTION 57 TAKEN AND KNOWLEDGE OF EQUALITY RIGHTS
5.1 Impact of Discrimination 57
5.2 Frequency of Discrimination 60
5.3 Actions Taken in Response to Discrimination 61 5.4 Relationship Between Action, Frequency, Impact and Knowledge of 65 Rights
5.5 Conclusions 70
CHAPTER 6: CONCLUSIONS 75
6.1 Main Findings 76
6.2 Implications for Policy 81
6.3 Implications for Future Data Collection/Research 82
REFERENCES 83
LIST OF FIGURES
Box 1.1 Definition of Discrimination on Equality Module (Prompt Card) 8 Box 2.1 Questions on Domain of Reported Discrimination from Equality Module 12
Questionnaire Figure 3.1 Gender Composition of Those Who Report Gender Discrimination 33
and of Total Population
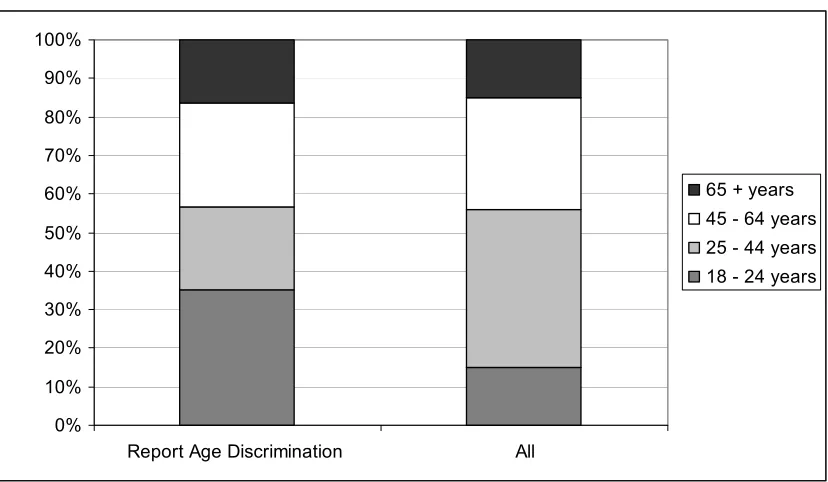
Figure 3.2 Age Composition of Those Who Report Age-related Discrimination 34 and of Total Population
Figure 3.3 Composition of Those Reporting Discrimination on the Basis of 35 Race/Skin Colour/Nationality or Ethnic Origin
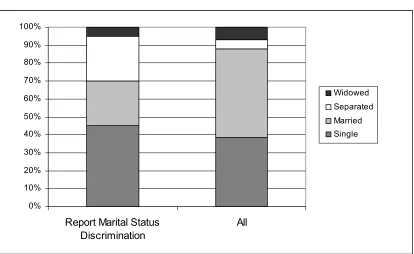
Figure 3.4 Marital Status of Those Reporting Discrimination on Grounds of 35 Marital Status and of Total Population
Figure 3.5 Family Status Composition of Those Reporting Discrimination on the 36 Grounds of Family Status, and of Total Population
Figure 3.6 Disability Status of Those Reporting Discrimination on the Grounds 37 of Disability, and of Total Population
Figure 3.7 Respondents Who Experienced Discrimination in Service and Work 39 Domains, Per Cent Who Selected the ‘Other’ Ground
Figure 5.1 Impact of Discrimination by Domain 59
Figure 5.2 Frequency of Discrimination of those Recording Any Discrimination 60 Figure 5.3 Frequency of Discrimination Across Domains 61 Figure 5.4 Action Taken in Response to Discrimination 62 Figure 5.5 Proportion Taking Any Action in Response to Discrimination 63 Figure 5.6 Action Taken by Respondents Who Experienced Discrimination in 64
Work and Service Domains
Figure 5.7 Percentage of Respondents Who Experienced Discrimination in 65 Domain Who Took Action
Figure 5.8 Relationship Between Action and Frequency and Subjective Impact 66 of Discrimination
Figure 5.9 Knowledge of Rights Under Irish Equality Law 67 Figure 5.10 Responses to Discrimination and Knowledge of Rights Under Irish 68
LIST OF TABLES
Table 2.1 Incidence and Rates of Discrimination Across Domains 13 Table 2.2 Experience of Work-related Discrimination in Last Two Years: 16
Raw and Modelled Risk for Socio-Demographic Groups
Table 2.3 Experience of Work-related Discrimination in Last Two Years: 20 Raw and Modelled Risk for Job Characteristics
Table 2.4 Models of Risk of Discrimination in Service Domains 24 Table A2.1 Likelihood of Experiencing Work-related Discrimination 29 Table A2.2 Models of Risk of Discrimination in Service Domains in Last 2 Years 30 Table 3.1 Grounds of Discrimination as a Percentage of All Reported Grounds 32 Table 3.2 Grounds of Discrimination as a Percentage of All Reported Grounds, 33
Distinguishing Men and Women
Table 3.3 Grounds for Discrimination in Services 37 Table 3.4 Grounds for Work-related Discrimination 38 Table A3.1 Models of Risk of Discrimination on the ‘Other’ Ground 42 Table 4.1 Respondents Who Experienced Any Discrimination in Last Two Years: 44
Raw and Modelled Risk
Table 4.2 Respondents Who Reported Experience of Work-related and 48 Services Discrimination in Last Two Years: Raw and Modelled Risk
Table A4.1 Respondents Who Reported Experience of Any Discrimination in 53 Last Two Years: 000s
Table A4.2 Confidence Intervals for Estimates of Any Discrimination by Nationality 54 Table A4.3 Confidence Intervals for Estimates of Any Discrimination by Ethnicity 54 Table A4.4 Confidence Intervals Attached to Estimates of Any Discrimination 54
by Religion
Table A4.5 Model of Probability of Experiencing Any Discrimination 55 Table A4.6 Risk of Discrimination in Work and Services 56 Table 5.1 Serious Impact of Discrimination Among Those Experiencing 58
Discrimination
EXECUTIVE SUMMARY
Discrimination undermines equality in society. Discrimination may also exacerbate social cleavages and weaken social solidarity, and in the context of employment, can undermine labour standards and lead to an inefficient use of skills. The importance of eliminating discrimination is reflected in Irish law which prohibits discrimination in a variety of settings and on a range of grounds. Yet discrimination is often difficult to detect and measure, as discriminatory behaviour is rarely observed directly. This study relies on the self-reported experiences of discrimination among the general population.
We draw on the first national survey of experiences of discrimination in Ireland carried out by the Central Statistics Office (CSO) in 2004 (CSO, 2005a). The survey asked individuals whether they had experienced discrimination in a number of domains over the previous two years. This survey of approximately 24,600 people provides important baseline information on a number of key issues:
the level of discrimination (subjectively defined), the contexts in which reported discrimination occurs, the perceived grounds of discrimination,
the social characteristics of those who report discrimination, the impact of subjective discrimination,
the responses taken by those who experience discrimination.
Drawing on the nine grounds covered by Irish Equality legislation, discrimination was defined as follows to those participating in the survey:
Discrimination takes place when one person or a group of persons are treated less favourably than others because of their gender, marital status, family status, age, disability, ‘race’ – skin colour or ethnic group, sexual orientation, religious belief, and/or membership of the Traveller community. Discrimination can occur in situations such as where a person or persons is/are refused access to a service, to a job, or is/are treated less favourably at work. In other words, discrimination means treating people differently, negatively or adversely because they are, for instance, Asian, Muslim, over 50 years of age, a single parent, and/or homosexual.
If the reason you may have been treated less favourably than someone else is due to another reason (such as your qualifications, being over an income limit or because you are further back in a queue for something) this does not constitute discrimination.
rather than just disadvantaged or minority groups. This is in line with international best practice.
Level of Reported Discrimination
Overall 12.5 per cent of the Irish population aged 18 years and over said that they had been discriminated against in the preceding two years (Table A). Of the eligible population, 9 per cent of respondents reported discrimination accessing services and 7 per cent reported Work-related discrimination. In 71 per cent of cases discrimination was experienced on more than one occasion.
Table A: Incidence and Rates of Discrimination
Experienced discrimination Experienced
Discrimination (000s)
Eligible Population
(000s)
Rate %
Any discrimination 381.6 3,061.1 12.5
Any Service related discrimination 276.7 3,061.1 9.0
Any Work related discrimination 156.9 2,157.4 7.2
Note: The data have been re-weighted to reflect population totals.
Social Context of Discrimination
The study examines experiences of discrimination across nine contexts or domains detailed in Table B. The highest rate of discrimination occurred in the two employment domains – with between 5 and 6 per cent of the eligible population reporting discrimination. In absolute numbers, banks and financial institutions proved the most common site for perceived discrimination.
Table B: Incidence and Rates of Discrimination Across Domains
Experienced discrimination Experienced
Discrimination (000s)
Eligible Population
(000s)
Rate %
While looking for work 73.9 1,275.8 5.8
In the workplace 100.6 2,076.2 4.8
Obtaining housing or accommodation 43.6 1,097.3 4.0
Using services of banks, insurance etc 112.5 3,061.1 3.7
In shops, pubs or restaurants 80.7 3,061.1 2.6
Accessing health services 51.3 2,903.3 1.8
In relation to education 16.7 1,321.4 1.3
Accessing other public services 30.1 3,061.1 1.0
Using transport services 21.7 3,061.1 0.7
Note: the data have been re-weighted to reflect population totals.
Perceived Grounds of Discrimination
The CSO survey also collected information on the grounds on which respondents felt they were discriminated against. As this question required respondents to interpret the motivation of other actors, the results should be understood as perceived
grounds of discrimination. Of the nine grounds covered by equality legislation, age-related discrimination was the most commonly reported (19 per cent) followed by race/ethnicity/nationality (16 per cent) and sex (12 per cent) (Table C).
Table C: Grounds of Discrimination as a Percentage of All Reported Grounds
Ground % of All Reported Grounds
Age 19.3
Race/skin colour/ethnic group/nationality 16.3
Sex 11.5
Family status 10.0
Disability 6.2
Marital Status 4.3
Sexual Orientation 0.5
Religion 0.6
Membership of the Traveller community 0.7
Other 30.6 Total 100.0
Almost one-third of the respondents felt unequally treated on ‘other’ unspecified grounds, not covered by law. The model constructed to analyse the ’other’ ground did not yield a clear picture of who is being missed by the existing equality grounds. Closer examination of three grounds not currently covered by equality legislation (Trade Union membership, education and economic status) showed that Trade Union members, respondents educated to primary and lower secondary level and the unemployed were more likely to use the ‘other’ ground. However, we cannot rule out some misclassification and the substantial number of respondents who ticked the ‘other’ ground is a weakness of the survey, given that the definition supplied is strongly linked to the nine grounds.
Social Characteristics of Those at Risk of Discrimination
The survey also includes information on the social characteristics (such as gender, ethnicity, nationality, disability, education etc.) of those who report experiencing discrimination, allowing comparisons between different sub-groups – men/women, Irish national/non-Irish national and so on – in the population. While these characteristics cover many of the grounds on which discrimination is legally prohibited in Ireland, there are two important omissions, namely sexual orientation, which was not asked in the survey, and membership of the Traveller community where the number of respondents was too small to analyse separately.
In addition to directly comparing the experience of different groups, we use statistical modelling to identify whether a particular group characteristic – such as gender or nationality – is a predictor of discrimination risk when the differential effect of other characteristics is controlled.
Women and Men
against in accessing health services while men were more likely to say they experienced discrimination accessing financial services such as banking and insurance. In other situations or domains men and women do not differ.
Age Groups: Older/Younger
Claims of discrimination more commonly came from respondents aged less than 25 years than those aged 65 years or over. Young people are particularly likely to report having experienced discrimination while using services such as pubs/clubs/restaurants/shops, banks/insurance and housing, but are no more likely than other age groups to report Work-related discrimination. The finding that being 65 years or older is not a risk factor in any domain is striking and may reflect reluctance among older people to interpret unequal treatment as discriminatory.
Family Status: Lone Parents
Lone parents have one of the highest probabilities of reporting discrimination over the preceding two years. Their risk of discrimination is found to be particularly concentrated within the services domain, with housing/accommodation, transport and other public services standing out as contexts in which lone parents are most likely to experience discrimination.
Non-Irish Nationals/ Minority Ethnic Groups
There is considerable policy interest in the extent to which non-Irish nationals and minority ethnic groups are subject to discrimination in Ireland. Some 24 per cent of non-Irish nationals feel they have been discriminated against over the preceding two years, just over twice the rate for Irish nationals. The higher likelihood of reported discrimination among non-Irish nationals persists in both of the work and four of the service domains (housing, shops/pubs/restaurants, financial services and transport), but is particularly pronounced in relation to job search.
Respondents of Black ethnicity have the highest “raw” risk of discrimination among the four ethnic categories – White, Black, Asian or ‘Other’ – identified in the survey, with 40 per cent of those surveyed reporting experience of discrimination. This compares to 12 per cent of the White respondents and 25 per cent of the Asian group. Ethnicity is more strongly associated with discrimination in services than work. The survey also shows that Black respondents were particularly at risk of discrimination in shops/pubs/restaurants, financial services, housing and transport, the ‘Other’ group were at risk in shops/pubs/restaurants and housing and the Asian group in transport. It was also found that Black respondents were more vulnerable to repeat discrimination than White respondents.
People with Disabilities
The Unemployed
The unemployed are not currently covered by equality legislation but they emerge clearly from the current study as a group particularly vulnerable to discrimination: 29 per cent of the unemployed in the survey reported having experienced some form of discrimination in the last two years. Unsurprisingly, the responses of the unemployed indicate particular vulnerability to discrimination while looking for work. Job seekers in this group are 8.7 times more likely to report experience of discrimination in the preceding two years than those currently employed, and the unemployed are also more likely to have experienced discrimination in the workplace.
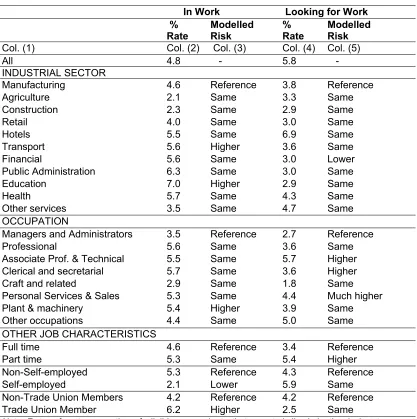
Work-related Discrimination by Sector and Occupation
We analyse Work-related discrimination by sector and occupation for those employed at the time of the survey. Statistical modelling revealed that only individuals working in the education and transport sectors have significantly higher reports of discrimination in the workplace, when occupation and the personal characteristics of workers are taken into account. Sector does not emerge as significant in the context of looking for work, apart from the fact that respondents working in financial services are less likely to report discrimination. In terms of occupation, plant and machine operatives report higher rates of discrimination in the workplace than individuals in other occupations, when we account for other factors using statistical modelling. Occupation had a greater impact on the experience of discrimination when looking for work: clerical and secretarial workers, associate professional and technical and personal and protective services emerged as more vulnerable to discrimination in the ‘looking for work’ model. Overall, the results suggest that it is the composition of the workforce, or the personal characteristics of those who sought work, rather than the sector or occupation in which they work, that is likely to be associated with a higher rate of discrimination.
The Impact of Discrimination and Taking Action
Of those who report discrimination in the last two years, some 26 per cent say that it had a serious or very serious effect on their lives. The results presented in this report highlight how the impact of reported discrimination varies across certain groups, and how the impact varies depending on the context. Discrimination in the workplace, obtaining accommodation and in ‘accessing other public services’ is seen to have a more serious impact by those who experience it. The finding that discrimination experienced in the workplace and in relation to housing/accommodation is associated with the most severe impact is unsurprising given that these are two dominant spheres in most people’s lives.
Policy Implications
1. INTRODUCTION
1.1 Introduction and Background to the Survey
The last decade has seen an increasing awareness of the problem of discrimination within Irish society. This is reflected in the development of equality legislation, discussed below, and the establishment of bodies such as the Equality Authority and the Equality Tribunal. However, while our expectations of a fair society for all have become increasingly well defined in recent years, relatively little is known of the nature or extent of the problem of discrimination in Ireland: how many people are discriminated against and who is most vulnerable? Where does such discrimination occur, how often does it occur, and what type of impact does the experience have on the victim? This report uses data from the first nationally representative survey designed specifically to answer these types of questions: the Central Statistics Office (CSO) Equality Module on the subjective experience of discrimination.
In 2004 the CSO Quarterly National Household Survey (QNHS) included a module on equality, which meant that approximately 24,600 QNHS respondents were asked an extra set of questions designed to investigate subjective experience of discrimination across a range of domains and grounds.1 The QNHS equality module
provides us with new data on the domains of discrimination (defined as where discrimination happens i.e. at work, looking for work or in service interactions) and on what grounds (the reason given as the motivation for the discrimination) respondents felt they were discriminated against.
The survey also includes information on the social characteristics (such as gender, ethnicity, nationality, disability, education, etc.) of those who report experiencing discrimination, allowing comparisons between different sub-groups – men/women, Irish national/non-Irish national and so on – in the population. These characteristics cover many of the grounds on which discrimination is legally prohibited in Ireland, but there are a number of important omissions, namely sexual orientation and membership of the Traveller community. Survey respondents were not asked about their sexual orientation, and the Traveller category of the ethnicity question is subsumed within the “White” ethnicity category, because of the small number of cases,
The domain of discrimination (also referred to in this report as the social context or place), social characteristics of those surveyed who reported discrimination, and the grounds on which they felt they were discriminated against can be connected using statistical modelling, thus allowing us to better understand the nature of subjective experience of discrimination in Ireland. Data on frequency, strength of the effect and response to discrimination in Ireland are also analysed.
This is the first nationally representative survey of discrimination in Ireland, in which respondents are asked specifically about their experience of discrimination in various arenas. The representative methodology and high response rate has resulted in good quality data and the collection and analysis of this data puts Ireland in line with European and international best practice in attempting to monitor and document discrimination both individually and institutionally. Initial findings from the QNHS
Equality Module data were published by the CSO and showed that over 12 per cent of respondents had experienced discrimination in the last two years and that almost 60 per cent of people who experience discrimination take no action (CSO, 2005).
The objective of the current study is to analyse this unique data in more depth to give a comprehensive picture of the extent and nature of discrimination in Ireland. This information can then be used to devise policies to prevent discrimination and tackle the impact of discrimination in specific situational contexts and among specific groups of people.
In this chapter we first briefly consider some recent changes in Irish society and the implications of these for equality and discrimination (Section 1.2). In Section 1.3 we review some approaches to defining and measuring discrimination. We consider the definition of discrimination, and, in particular how discrimination is defined legally in Ireland in Section 1.3.1. Section 1.3.2 considers various methods of measuring discrimination and their strengths and weaknesses. Following on from this discussion, Section 1.4 discusses in some detail how discrimination is measured in the survey on which this report is based. Section 1.5 discusses the outline of the report, and how subsequent chapters explore the issue of discrimination in Ireland.
1.2 Changing Irish Context
There have been a number of important changes in Irish society in recent decades that are relevant for our understanding of discrimination and equality; including changes in family structure, changes in the composition of the labour market, increased immigration and changing social attitudes.
While the homogeneity of family structure in the past has often been exaggerated, there has been an increase in diversity of household structures (Fahey and Russell, 2001). Relevant changes to families include increasing rates of lone parenthood, rising levels of cohabitation, increasing marital breakdown and, since 1997, the rise in remarriage (see Fahey, 2005). These changes may have implications for access to equal treatment on the grounds of family status, marital status and, indirectly, gender. Ireland has now been transformed from a country of net emigration, which it had been for most of the twentieth century, to a country of net immigration. The inflow of immigrants increased from 39,000 per annum in 1996 to almost 110,000 per annum in 2007 (CSO, 2003, 2007). The 2006 Census found that 10.1 per cent of the total population (419, 733) were non-Irish nationals, with 1.3 per cent of the population Asian/Asian Irish and 1 per cent African (CSO 2006 Census Principal Demographic Results, March 2007). Increasing national and ethnic diversity may have implications for access to equal treatment on the grounds of ethnicity/nationality.
The issue of equality in the workplace has attained greater prominence because of the increased diversity of the contemporary workforce. The rapid increase in the number of women at work, the rise in inward migration, and the increased presence of people with disabilities and older people contribute to a more diverse workforce (O’Connell and Russell, 2005).
1. gender, 2. marital status,
3. family status (e.g. pregnant or with children or other dependants) 4. age,
5. disability,
6. race/ skin colour/ ethnic group/ nationality, 7. sexual orientation,
8. religious belief,
9. membership of the Traveller community.
1.3 Defining and Measuring Discrimination
1.3.1 Defining Discrimination
Discrimination is commonly understood as differential treatment on the basis of group membership that unfairly disadvantages a group. Discrimination has also been defined in Irish law, and the understanding of discrimination in the survey on which this report is based closely follows the legal definition. The Employment Equality Acts 1998 to 2007 prohibit discrimination in the workplace and in vocational training, and the Equal Status Acts 2000 to 2004 prohibit discrimination in the provision of goods and services, accommodation and education. Both Acts define discrimination as treating a person less favourably than another person is, has been or would be treated in a comparable situation on any of the grounds specified. Indirect discrimination (when there is less favourable treatment in effect or by impact) and discrimination by association or imputation are also defined and prohibited. The legislation also includes provisions prohibiting sexual harassment and harassment. Harassment is defined as any form of unwanted conduct related to any of the discriminatory grounds, conduct which has the purpose or effect of violating a person’s dignity and creating an intimidating, hostile, humiliating or offensive environment. Both Acts contain a number of detailed exemptions. Under the Equal Status Act the broadest general exemption is that anything mandated by an Act of the Oireachtas or EU law is allowed. A considerable number of exemptions are also outlined in relation to specific services and groups.2
The survey discussed here uses the nine grounds of discrimination identified in the equality legislation as the basis for questions on which grounds of discrimination might be the motivation for the current discrimination (see Section 1.4 for a more detailed discussion, respondents are made aware of the general terms of the legal definition though not of the exemptions). Note that while this legal definition is broadly consistent with the overall definition of discrimination described above, there are limits to this legal definition. For example, some grounds are excluded: discrimination on the basis of employment status is not illegal, for example. In fact, respondents in the survey could also list ‘other’ grounds for discrimination, and the evidence suggests that many did.
1.3.2 Measuring Discrimination
discrimination have been used in previous research, though no single approach allows researchers to address all the important measurement issues and each have their strengths and weaknesses (Blank et al., 2004). Methods include: attitude studies; differential outcome studies; audit studies; legal caseloads and indicators of the experience of discrimination from surveys. The latter is the one used in this study. The purpose of this section is to situate the measurement of discrimination in this study in the context of different approaches to measuring discrimination.
Attitude Studies
Attitude studies have their origins in the social psychological studies of ‘prejudice’, understood as individually held beliefs about ‘others’ rooted in individual experiences (via one-to-one interactions) (Allport 1954/1979; Dovido, Glick and Rudman, 2005), and much early research on discrimination focused on prejudice. Such research attempts to understand how people came to have prejudiced views or ‘stereotypes’ of certain groups. Studies of prejudice in Ireland in the 1970s (Mac Gréil, 1980) documented early prejudiced attitudes, which had declined significantly when resurveyed in 1990 (Mac Gréil, 1996). These studies of prejudice were important for understanding how personal beliefs about others can provide the impetus for discriminatory behaviour by focusing on the ‘motivation’ for the prejudiced belief. However, these types of studies found it more difficult to explain the mechanisms, the social context in which discrimination happens, or the effects that discrimination has (Feagin and Eckberg, 1980).
Large-scale EU studies have the advantage of allowing us to locate Ireland’s experience within a broader context. Studies such as the European Social Survey and the Eurobarometer survey address, for example, the attitudes of indigenous populations to immigrants. These European surveys indicate that on average, Irish respondents have been below the European average with respect to generalised resistance to a multicultural society (Hughes et al., 2007). In the context of the present report, it should be noted that while attitudinal research of this nature may be informative, there is only a moderate correlation between stereotypes and prejudice and discriminatory behaviour. Studying attitudes is not the same as measuring discriminatory behaviour.
Differential Outcome Studies
An important recent body of work on discrimination has focused on differential outcomes between groups or patterns of inequality (Darity and Mason, 1998). This approach shifts the focus from individual prejudice to differential outcomes. Many studies of differential outcomes have treated discrimination as the residual i.e., when controlling for other variables there is still an unexplained amount of disadvantage, which is then labelled ‘discrimination’ (Bridges and Nelson, 1999). Examples of this work are particularly prevalent in the analysis of labour market outcomes: a regression model is typically developed to explain an outcome variable such as wages, and includes a variable for group membership, such as gender or ethnicity, and additional observed characteristics that are expected to effect wages. The assumption is that some proportion of a gender or racial gap in earnings is related to average group differences in productivity-linked differences, and thus due to human capital differences (e.g. experience, education), and another, usually the residual part of the gap, is due to average group differences in treatment in the labour market, and thus attributed to discrimination.
(Reskin and Roos, 1990). England (1992) shows that the percentage of women in an occupation reduces wages, even controlling for a variety of other factors. Others have focused on the role of race and ethnicity in the labour market in Australia (Evans and Kelly, 1991), and in the US (Race, Ethnicity and the American Labour Market, 2005). Examples of this type of research in Ireland have looked at the wage penalty among immigrants (Barrett and McCarthy, 2006); labour market outcomes among different ethnic groups (O’Connell and McGinnity, forthcoming); the gender wage gap (Russell and Gannon, 2002); labour market outcomes among older people (Fahey and Russell, 2004); labour market outcomes among the disabled (Gannon and Nolan, 2004, 2005).
Some studies have also used large-scale data sets and similar techniques to show how institutions can be imbued with certain values which discriminate against others (Jones, 1972); how IQ testing discriminates against racial/ethnic minorities (Eckberg, 1979); how class background works to disadvantage racial/ethnic groups in education (Cox, 1948) and how racial housing segregation operates (Massey and Denton, 1998). Key to this approach is to ensure that all important influences, net of discrimination, on labour market outcomes are taken account of, so that the residual can be appropriately attributed to discrimination rather than to other differences between the groups. As this is not often the case, as differences are unobserved, the remaining difference may be partly, but not completely, due to discrimination, thus discrimination may be over-estimated. Second, some would argue the clear distinction in these approaches made between ‘in-market’ and ‘pre-market’ discrimination is problematic. ‘In-market’ discrimination is simply the last in a series of processes, and need only occur when earlier attempts to restrict access to jobs, credentials and qualifications of minority groups/women has failed. Thus analysing ‘in-market’ discrimination is giving only a partial account of discrimination in labour markets and thus may under-estimate its extent (Darity and Mason, 1998).
Audit Studies
Legal Caseloads
Another approach to the measurement of discrimination has been to look at the legal cases of tribunals or legally reported discrimination cases. Job discrimination lawsuits in the US for example, provide highly visible evidence of direct discrimination in employment (see Darity and Mason, 1998). In Ireland the Equality Tribunal is the most relevant source of such caseload data. Case files from the Equality Authority would also fall into this category.
In 2005 the Equality Tribunal recorded claims of discrimination from almost 1,700 people. These claims were in respect of discrimination related to work, pensions or access to goods and services. This was the highest number of individual claimants ever, more than 29 per cent higher than the previous peak in 2002. Studies based on such data tend to focus on those who are well informed of their rights and who are highly motivated to pursue claims of discrimination. There is thus a concern that such data may not provide representative data of the nature required to accurately measure the incidence, distribution and nature of discrimination. The unrepresentative nature of such data is emphasised when we consider the history of under-reporting of discrimination by vulnerable groups (such as undocumented immigrants) because they often do not want to ‘make trouble’ or be seen to be complaining within dominant society (Wang, 2006).
Subjective Reports of Discrimination Using Large Scale Surveys
Self-reports of discrimination measure discrimination as perceived by the respondent in response to a direct question. This is the type of data upon which the results in this report are based on. An example of such a question would be: ‘In the past two years, have you personally felt discriminated against in the workplace?’ As Blank et al. (2004) note, it is not discrimination that is being directly measured but reports of experiences of discrimination. Where such surveys use a generalisable, nationally representative sample, they can provide an excellent and comprehensive picture of the experience of discrimination. They often provide information about a range of social contexts in which discrimination can happen, often in contexts or domains not covered by other methods, for example, public transport, shops and pubs. These surveys often report discrimination towards a wide range of groups, not just minority groups or groups of particular policy or research interest.
Previous research has also shown that people who perceive discrimination may be more likely to report this incident anonymously in response to a direct question in a survey than make a complaint to a legal authority or other body (McGinnity et al., 2006). The data from surveys are thus considered more accurate and comprehensive. Reports of discrimination using large-scale surveys can also provide important baseline data for future research.
While surveys of subjective experience make up an important part of our information on discrimination it is important to be cognisant of the limits of such data sources. While the researcher may aspire to capture discrimination as defined above (‘differential treatment on the basis of group membership that unfairly disadvantages a group’) it is essential to acknowledge the subjective nature of such reports. The validity of subjective reports may be reduced in a number of ways.
is if discrimination is subtle or indirect. Discrimination may come in the form of glances or avoidance or ‘the feeling they got’, and these forms of discrimination are typically not picked up by direct questions in surveys.
Respondents may also perceive discrimination where none exists (over-reporting). This might happen if, for example, in an ambiguous situation, respondents may falsely attribute the denial of work to discrimination that is in fact due to some other reason like qualifications, timing or even chance.
The key point relating to subjective interpretation of discrimination is that two respondents may perceive the same behaviour differently: one may report it as discrimination, the other not. This variation is problematic if it varies systematically across the groups of interest. For example, previous research shows that the highly educated tend to report more discrimination in a range of situations, despite being objectively advantaged (McGinnity et al., 2006). This group tends to be outspoken, informed about equality legislation and sensitive to unequal treatment. So a highly educated person may be more likely to report the same incident as discrimination than someone with low education, and this may bias results.
In the next section we discuss the Equality Module, the survey that forms the basis of this study. We discuss how the survey addresses some of the problems of subjective reporting, for example by supplying respondents with a definition of discrimination, and how in general the survey uses best practice to limit the potential bias associated with subjective reporting.
Another way of addressing the limitations of subjective self-reports of discrimination is to cross validate the findings with other sources. In general, researchers have found direct self-reports of discrimination like these to be accurate and reliable when cross validated against other data sources (Blank et al., 2004). The current report is an important step in building an understanding of discrimination in Ireland. Ideally, this information should be supplemented with research of the types discussed above (e.g. differential outcome studies; audit studies; legal caseloads etc.) and where possible within this study we make reference to information on discrimination in Ireland gathered using other methods.
1.4 Measuring Discrimination Using the Equality Module
The data used in the current report were collected by means of a special module of the Quarterly National Household Survey (QNHS). Each quarter the Central Statistics Office (CSO) produces a Quarterly National Household Survey (QNHS), the main objective of which is to provide estimates on short-term indicators of the labour market. The QNHS is continuous and targets all private households in the state. The QNHS is the second largest statistical project undertaken by the Central Statistics Office after the Census; the total sample per 13-week quarter is 39,000. The response rate is high (93 per cent) and the survey results are weighted to agree with population estimates broken down by age, sex and region.3
Special survey modules are also included for the collection of data on social topics and in the fourth quarter of 2004 a special module on Equality was included. In this module a set of extra questions, mostly covering questions on the experience of discrimination, was asked of approximately 24,600 QNHS respondents, all aged 18 years and over and interviewed directly. The number of cases is lower than the
overall QNHS for a number of reasons. To ease respondent burden, those participating in the survey for the first time were not questioned on the module, and proxies were excluded because of the nature of the questions. Respondents could also opt out of the extra module, though this only accounts for a small proportion of difference in number of respondents. This module provides the basis for our analysis here. We also draw on additional data from the main QNHS, which was matched to the module data by the CSO specifically for this project. Through the representative and broadly based sample of the QNHS important baseline data on the experience of equality in Ireland could be collected.
In addition to the specific questions on subjective experiences of discrimination the module also included some classificatory information not routinely collected in the
QNHS. This included two questions on disability, detailed information on religious affiliation and a question on ethnicity. The latter piece of information is particularly important, as this is the first time such information was collected on a nationally representative survey in Ireland. Note that ethnicity is used in this report to define the categories White/Black/Asian/Other identified in the survey in preference to race. Elsewhere (i.e. the US), race is defined as a construct based on observable physical characteristics (e.g. skin colour) that have acquired social significant meaning (see Banton, 1994). Ethnicity more typically refers to cultural factors such as language, religion and nationality (Bobo, 2001). However, we use ethnicity to refer to these categories to be consistent with the use of the term in the Equality Module, and in the
2006 Census of the Irish Population, on which this classification is based (see Garner, 2004, for a discussion of the use of the term ethnicity in Ireland).
The module consists of a series of questions asking adult respondents whether they experienced discrimination in the last two years across nine situational contexts or domains (details of the questionnaire are provided in the Methodological Appendix). Those who made an affirmative response in any of the domains were then asked further questions about the nature of the experience. First they were asked on what grounds they felt they had been discriminated against. Respondents could choose from the nine grounds covered by the Irish equality legislation or select ‘other’. Respondents were also asked to provide some limited information on the frequency of discrimination, the actions they took (if any) in response to discrimination and their knowledge of their rights under Irish equality law. Those experiencing discrimination were also asked to assess the impact it had on their lives.
Before these questions were asked, each respondent was shown a prompt card with a definition of discrimination which closely follows the legal definition (Box 1.1). Box 1.1: Definition of Discrimination on Equality Module (Prompt Card)
Discrimination takes place when one person or a group of persons are treated less favourably than others because of their gender, marital status, family status, age, disability, ‘race’ – skin colour or ethnic group, sexual orientation, religious belief, and/or membership of the Traveller community.
Discrimination can occur in situations such as where a person or persons is/are refused access to a service, to a job, or is/are treated less favourably at work. In other words, discrimination means treating people differently, negatively or adversely because they are for instance Asian, Muslim, over 50 years of age, a single parent, and/or homosexual.
Interviewers were also well briefed on the definition of discrimination, with a whole series of examples of discrimination which they could give respondents if requested. What respondents are not made aware of are details of the exemptions of the legislation, so it is likely that responses are based on the spirit of the legal definition of discrimination rather than the detail.
Following best practice, all questions ask respondents whether they experienced discrimination in a specific situation or venue, for example:
“In the past two years, have you personally felt discriminated against in respect of obtaining housing/accommodation?”
Housing/accommodation is an example of one ‘domain’ or situation. The domains covered are usefully divided into Work-related and service domains. There are six other service domains besides obtaining accommodation, namely: using the services of banks, insurance companies etc; in shops pubs or restaurants; accessing health services; accessing other public services; using transport services; in relation to education. The questions on the experience of discrimination also cover two Work-related domains: in the workplace and in accessing work (applying for a job). The full range of questions is found in the Methodological Appendix. This is a wide range of situations where respondents might have experienced discrimination, though note as with any specific listing, some situations may be omitted.
Following the individual questions about the respondent’s experience of discrimination comes a question about why respondents think they were discriminated against, or on what ‘grounds’ they felt the discrimination was based, if they reported that they were discriminated against. This question takes the form: Why do you think you were discriminated against – was it because of your… (Multiple responses allowed)
1. gender, 2. marital status,
3. family status (e.g. pregnant or with children or other dependants), 4. age,
5. disability,
6. race/ skin colour/ ethnic group/ nationality, 7. sexual orientation,
8. religious belief,
9. membership of the Traveller community, 10. Other.
As can be seen these grounds are based on those listed in the equality legislation. Adding the ‘other’ category means that respondents are not limited to discrimination on the basis of the nine grounds listed. However, as no further information is given on what the other grounds might be, this information is limited (see Chapter 3 for a further discussion of the ‘other’ ground).
There are a number of ways in which the Equality Module follows best practice in order to maximise the validity of the information collected on subjective discrimination, by paying attention to both methodological factors (sampling, interviewing, question design – both placing and wording) and reporting biases (Smith, 2002). In terms of sampling, a random sample of the target population is clearly preferable to give an accurate picture of discrimination in the target group. This is the strategy in the QNHS Equality Module (for more details on sampling see the Methodological Appendix). For overviews of subjective discrimination it is also useful to have a wide range of target groups, where possible, to avoid excluding groups that may be experiencing discrimination. The QNHS Equality Module has a very wide range of groups that may be experiencing discrimination. Attention should also be paid to question wording (Smith, 2002). The most valuable measures of discrimination record specific instances of discrimination experienced by individuals, groups or relating to venues: questions about the overall level of discrimination are too general. Questions work best when they refer to a specific time frame (i.e. the past year) and a specific venue (in interaction with the police, housing, public transportation, banks etc). This is the strategy adopted by the QNHS Equality Module.
It should be also noted that the survey, and indeed the legislation which underpins it, does not limit discrimination to minorities, or particular groups under the nine grounds (though the examples listed in the interviewer prompt card are all of discrimination towards minorities). For example, two respondents may report that they were discriminated against on the basis of ethnicity, one Black, one White. The Black respondent may feel that they are passed over for a promotion because they are Black: the White respondent may feel that they are not promoted because they are White. Both are treated as discrimination.
An alternative strategy would be to only count discrimination against ‘minorities’ or particular groups under the nine grounds. For example, of those who responded to the question as to whether they experienced discrimination on the basis of ethnicity, only count responses from individuals from ethnic minorities, and disregard the others. Yet this involves the researcher making fairly heroic assumptions about the nature of discrimination. If we then consider gender – should all instances of discrimination on the basis of gender reported by men be excluded? Should all instances of discrimination on the basis of marital status reported by single people be excluded? The aim of this report is to map the extent of discrimination on a range of grounds and domains. Excluding certain groups risks telling a very partial story, so this strategy is not pursued.
In summary, in this survey the respondents defined for themselves what they felt qualified as discrimination, broadly guided by the legal definition in Ireland. Ultimately, the survey data gives us new nationally representative data about the nature of ‘reported discrimination’ in Ireland, and the results in this report should be understood in this light. We note that the results are subjective reports at various points throughout this study.
detect using other methods. People who perceive discrimination may be more likely to report this incident anonymously in response to a direct question, than report it to a legal authority or some other body. As mentioned above such surveys can provide important baseline data for future research. Finally, since the survey asks direct questions about discrimination, it was possible for the CSO to follow up with questions about the frequency, impact and response to discrimination.
1.5 Report Plan
This report takes the following form. In Chapter 2 we focus on the situational context or domains in which discrimination occurs. We examine self-reports of discrimination in the workplace, in looking for work and in seven service domains, investigating whether there is variation in the characteristics of those who experience discrimination in different situations. We discuss the proportions of the social/demographic groups who reported having experienced discrimination in the various domains and use regression modelling to try to unpick the most influential characteristics in this regard. The statistical methods used in the report are introduced and explained and we provide a guide to interpreting the main results. Data on the reported “grounds” of discrimination are discussed in Chapter 3. As discussed above this information is the respondent’s own interpretation of the motivation behind his or her experience of discrimination. We compare the social/demographic characteristics of respondents who selected certain grounds against the relevant social/demographic characteristics of the population. For example, we compare the marital status of those who believed they had been discriminated against on the grounds of marital status to the marital status of the whole population. This analysis allows us to see which sub groups (e.g. single people, separated etc.) are most at risk. We attempt to address the fact that almost one-third of reported grounds fall into the ‘other’ category, by exploring the characteristics of those who respond in this way.
In Chapter 4 we focus on the distribution of subjective experiences of any discrimination, Work-related discrimination and service-related discrimination across social and demographic groups. We look at a range of groups believed to embody characteristics that are important for examining experiences of discrimination. Many of these characteristics are covered by anti-discrimination legislation in Ireland such as gender, age, family status, marital status, race/ethnicity, nationality, disability and religion. We also included employment status and education level as these characteristics have been found to be associated with discrimination in international research, and because these are important lines of social stratification in Irish society. We attempt to identify exactly who is most vulnerable to discrimination. Chapter 5 is concerned with a range of data on the reported impact of discrimination, the frequency of reported incidents, action taken in response to these experiences and knowledge of equality rights. We analyse these variables individually before exploring whether they relate to one another, and if so how.
2. WHERE DO PEOPLE EXPERIENCE
DISCRIMINATION?
This chapter is concerned with where reported discrimination occurs. Discrimination is likely to affect people differently in different contexts and it is important to take account of the context in which discrimination occurs: are some situations more open to discrimination than others? Are certain groups of respondents more vulnerable to discrimination in some domains than others? Such issues will be addressed in the discussion below. By means of the questions shown in Box 2.1 subjective experience of discrimination was examined in the survey across nine situations or domains. Two domains are Work-related: looking for work and in work. A further seven domains measure the experience of discrimination in accessing or using a range of public and private services.
Box 2.1: Questions on Domain of Reported Discrimination from Equality Module Questionnaire
In the past two years, have you personally felt discriminated against… 1. in the workplace?
2. while looking for work?
3. in places like, shops, pubs, or restaurants?
4. using services of banks, insurance companies or other financial institutions? 5. in relation to education?
6. in respect of obtaining housing/accommodation?
7. in respect of accessing health services (e.g. getting access to a GP, access to hospital, access to specialist treatment)?
8. in respect of using transport services?
9. in respect of accessing other public services either at a local or national level?
It is important to note that the phrasing of some questions means they could be interpreted to include discrimination not only by service providers but also by other service users. This is particularly true for the question “have you personally felt discriminated against in places like shops, pubs and restaurants”. Similarly discrimination in the workplace could potentially be initiated by co-workers or customers as well as managers and employers. The subjective discrimination analysed here is also restricted to the domains of employment and access to services and, therefore, some sorts of discrimination are not included in the figures. As mentioned in Chapter 1, in line with best practice (Blank et al. 2004), the experience of discrimination is time delimited, with respondents asked to recall incidences in the last two years.
2.1 Risk of Discrimination Associated with Different Domains
Table 2.1 shows the percentage of respondents who reported discrimination in each of the nine domains. The table also shows estimates of how many people reported subjective discrimination (000s).4 Overall, just over 381,000 people or 12.5 per cent
of the population report experiencing discrimination in at least one of the domains covered by the questionnaire. Service-related discrimination was reported by 276,000; 157,000 reported Work-related discrimination.5
As Table 2.1 shows, the highest rate of discrimination reported was in relation to looking for work. Almost 70,000 people felt they had been discriminated against while looking for work over the preceding two years, representing 5.8 per cent of the population that had engaged in job search. Discrimination in the workplace was the next most commonly reported: almost 5 per cent of the eligible population felt discriminated against in this domain. Of those respondents who had sought accommodation in the last 2 years, 4 per cent reported experiencing discrimination, though this relates to a much smaller number of people, as many people had not sought accommodation in the last 2 years. Discrimination related to the use of financial services such as banks and insurance companies was reported by the largest overall number of respondents: 112,500 people (3.7 per cent of the population) reported discrimination in this domain. The lowest rates of discrimination are reported in accessing education by 1.3 per cent, other public services by 1 per cent and using transport services reported by 0.7 per cent of the eligible population respectively.
Table 2.1: Incidence and Rates of Discrimination Across Domains
Experienced Discrimination Experienced
Discrimination (000s)
Eligible Population
(000s)
Rate %
Any discrimination 381.6 3,061.1 12.5
Any Service-related discrimination 276.7 3,061.1 9.0
Any Work-related discrimination 156.9 2,157.4 7.2
While looking for work 73.9 1,275.8 5.8
In the workplace 100.6 2,076.2 4.8
Obtaining housing or accommodation 43.6 1,097.3 4.0
Using services of banks, insurance etc. 112.5 3,061.1 3.7
In shops, pubs or restaurants 80.7 3,061.1 2.6
Accessing health services 51.3 2,903.3 1.8
In relation to education 16.7 1,321.4 1.3
Accessing other public services 30.1 3,061.1 1.0
Using transport services 21.7 3,061.1 0.7
Notes: Respondents could report discrimination in multiple domains. 000s figures are weighted to reflect the total population aged over 18 years.
The rates (%) are calculated as a proportion of the eligible population, i.e. we exclude those who say the question is not applicable to them e.g. because they have not searched for work or looked for accommodation (see discussion in text).
Those who felt they had been discriminated against in work were asked to indicate whether this related to pay, promotion, work conditions, bullying/harassment or ‘other’ issues. Bullying/harassment was the most common form of discrimination
4 The estimates are based on a sample of the population so the figures have been multiplied or ‘grossed up’ to estimate the true population figures.
experienced in work (26 per cent), followed by other (25 per cent), work conditions (19 per cent), promotion (16 per cent) and pay (14 per cent).
It is important to note that the percentages refer to the proportion of the eligible
population. If a respondent answered “not applicable” to one of the questions listed in Figure 2.1 they are excluded from the relevant domain in Table 2.1. For example, someone who left the education system 20 years ago is likely to tick ‘not-applicable’ to the question relating to discrimination in relation to education in the last 2 years.6
Excluding respondents who answer “not applicable” results in certain selection effects. When we exclude non-applicables we are no longer discussing the same group of respondents across domains. For example, if we exclude those who have answered “not applicable” to discrimination in the workplace we reduce the population from just over 3 million to just over 2 million respondents: if we exclude those who have answered not-applicable to discrimination in education the sample is reduced from just over 3 million to 1.3 million (see Table 2.1, figures are weighted to represent the total population). As can be seen from Table 2.1, this point is most relevant to the two Work-related domains (persons who have not looked for work or been in work in the last two years are excluded) and to education, health and accommodation domains (respondents who have not used these services in the reference period are excluded).7
In the rest of the chapter we consider how the risk of discrimination in different domains varies by social and demographic groups. We do this in two ways. First we consider how the risk of discrimination varies among women and men, across age, national, ethnic, religious groups etc. These simple group averages from the data are called ‘rate’ or sometimes ‘raw risk’ in the tables.
However, if we focus on group differences alone, the relative risk of one group may be determined in part by the composition of the group in terms of their vulnerability to other risk factors. For example, non-Irish respondents have a higher reported “raw” risk of discrimination than Irish nationals in shops and pubs. Is this higher risk because of their ethnicity, religion, age… or a combination of several of these characteristics? Using multivariate modelling allows us to disentangle the effect of a whole series of factors. The method allows us to look at the effect of membership of one demographic/social group on discrimination separately by holding all the other characteristics constant. In each model a subcategory within a group (e.g. White within ethnicity) is used as the reference group and conclusions are drawn about other subcategories (Black, Asian, Other) relative to the reference group. The results of these models are presented as ‘modelled risk’ in the Tables.8 The models allow us
to assess the strength of the relationship between discrimination and, for example, socio-demographic characteristics in terms of odds ratios. This allows us to make statements such as “respondents of Black ethnicity are 4.6 times more likely to report experience of discrimination in shops, pubs or restaurants than those of White ethnicity”. The models also allow us to determine whether the results are robust or ‘statistically significant’, i.e. whether we can be confident that the differences would
6 Why does this matter? It matters because the discrimination rate is calculated as the number experiencing discrimination (numerator) as a proportion of all ‘at risk’ (denominator). If we use the whole adult population as the denominator in the case of education, the discrimination rate will be misleadingly low.
7 The exclusion of respondents who answered “not applicable” means that results are different from the CSO release on the QNHS Equality Module (Central Statistics Office, 2005).
not have been generated by chance. These detailed results are presented in the Appendix to this chapter.
In the chapter we present a simplified version of the model results, which simply states whether the modelled risk is the same, higher or lower than the reference group. In some cases the model might indicate that the group differs from the reference group, but that there are not enough people in the group to firmly establish this (i.e. establish statistical significance). In this case we say the group is the ‘same’ as the reference group, as we do not have enough evidence to establish otherwise. Interested readers may refer to the Appendix Tables at the end of this chapter for more details on both the strength of the effects and the statistical significance.
2.2 Work-related Discrimination
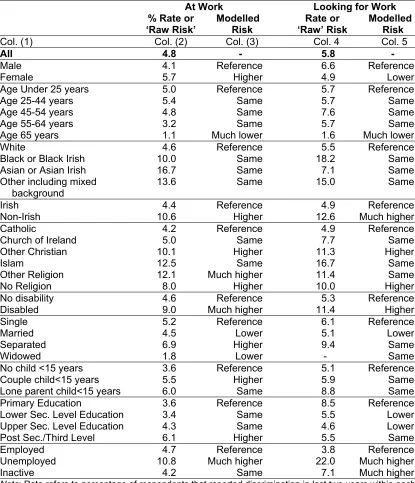
In this section we consider findings on Work-related discrimination, distinguishing discrimination in the workplace from discrimination when looking for work. We argue that for Work-related discrimination it is important to look not only at the socio-demographic characteristics of individuals but also at the characteristics of the job. Previous research among employees suggested that, for example, the industrial sector in which workers are located influences employees’ perceptions of fairness and equality in their organisations (O’Connell and Russell, 2005). In this section we construct two separate models of discrimination at work and discrimination seeking work, controlling for both socio-demographic characteristics and job characteristics. However, we discuss them separately: in Table 2.2 we look at differences between socio-demographic groups; in Table 2.3 we consider ‘organisational’ characteristics. In each case, Columns 2 and 4 of the tables present ‘raw’ or simple group differences, Columns 3 and 5 of the table present modelled results.
2.2.1 Work-related Discrimination by Socio-demographic Characteristics
Table 2.2 presents the results for social/demographic characteristics (see Table A2.1 for full model results). Here we discuss results for each group in turn, highlighting where the factors associated with discrimination differ between the two work domains. Note that as the number of people who were seeking work in the past two years was smaller than the number of people at work, the sample for the analysis of discrimination seeking work is smaller.
Gender and Age
Table 2.2: Experience of Work-related Discrimination in Last Two Years: Raw and Modelled Risk for Socio-Demographic Groups
At Work Looking for Work
% Rate or ‘Raw Risk’
Modelled Risk
Rate or ‘Raw’ Risk
Modelled Risk
Col. (1) Col. (2) Col. (3) Col. 4 Col. 5
All 4.8 - 5.8 -
Male 4.1 Reference 6.6 Reference
Female 5.7 Higher 4.9 Lower
Age Under 25 years 5.0 Reference 5.7 Reference
Age 25-44 years 5.4 Same 5.7 Same
Age 45-54 years 4.8 Same 7.6 Same
Age 55-64 years 3.2 Same 5.7 Same
Age 65 years 1.1 Much lower 1.6 Much lower
White 4.6 Reference 5.5 Reference
Black or Black Irish 10.0 Same 18.2 Same
Asian or Asian Irish 16.7 Same 7.1 Same
Other including mixed background
13.6 Same 15.0 Same
Irish 4.4 Reference 4.9 Reference
Non-Irish 10.6 Higher 12.6 Much higher
Catholic 4.2 Reference 4.9 Reference
Church of Ireland 5.0 Same 7.7 Same
Other Christian 10.1 Higher 11.3 Higher
Islam 12.5 Same 16.7 Same
Other Religion 12.1 Much higher 11.4 Same
No Religion 8.0 Higher 10.0 Higher
No disability 4.6 Reference 5.3 Reference
Disabled 9.0 Much higher 11.4 Higher
Single 5.2 Reference 6.1 Reference
Married 4.5 Lower 5.1 Lower
Separated 6.9 Higher 9.4 Same
Widowed 1.8 Lower - Same
No child <15 years 3.6 Reference 5.1 Reference
Couple child<15 years 5.5 Higher 5.9 Same
Lone parent child<15 years 6.0 Same 8.8 Same
Primary Education 3.6 Reference 8.5 Reference
Lower Sec. Level Education 3.4 Same 5.5 Lower
Upper Sec. Level Education 4.3 Same 4.6 Lower
Post Sec./Third Level 6.1 Higher 5.5 Same
Employed 4.7 Reference 3.8 Reference
Unemployed 10.8 Much higher 22.0 Much higher
Inactive 4.2 Same 7.1 Much higher
Note: Rate refers to percentage of respondents that reported discrimination in last two years within each group. Weighted. “Modelled risk” refers to relative risk of subcategories to discrimination when compared to the reference subcategory within group, when other characteristics are controlled (e.g. married respondents compared to single respondents). Much higher = more than twice the risk; Much lower = less than half the risk compared to reference group. Same = group does not differ significantly to reference group. Models are not weighted following convention. Models also include organisational characteristics. Full model results are reported in Appendix Table A2.1.
The very marked increase in the demand for female labour in the past ten years, particularly in service sector jobs, may be one reason for this (O’Connell and Russell, 2007). It is plausible that men may have found it more difficult to get a job than women in the two years preceding the survey.