METHOD DEVELOPMENT AND VALIDATION OF SIMULTANEOUS ESTIMATION OF TENOFOVIR AND LAMIVUDINE I N
PHARMACEUTICAL DOSAGE FORMS BY RP-HPLC
Dissertation work submitted to
The Tamilnadu Dr. M. G. R. Medical University, Chennai In partial Fulfillment for the award of degree of
MASTER OF PHARMACY
IN
PHARMACEUTICAL ANALYSIS
Submitted by
K.V.PULLA REDDY Reg. No: 26106423
Under the guidance of
Institutional Guide Industrial Guide
Mr. R. Siva Kumar (Ph.D), Mr. A.V. Raghuram
Asst. Professor Sr. Research Analyst
Department of Pharmaceutical Analysis Qps- Bioserve India Pvt Limited R V S College of Pharmaceutical Sciences Hyderabad
Sulur, Coimbatore.
MAY 2012
DEPARTMENT OF PHARMACEUTICAL ANALYSIS
R.V.S. COLLEGE OF PHARMACEUTICAL SCIENCES
CERTIFICATE
This is to certify that the dissertation work entitled “METHOD DEVELOPMENT AND VALIDATION OF SIMULTANEOUS ESTIMATION OF TENOFOVIR
AND LAMIVUDINE IN PHARMACEUTICAL DOSAGE FORMS BY RP-HPLC” is a bonafide work of Mr. K.VENKATA PULLA REDDY carried out in BIOSERVE LABORATORIES, HYDERABAD under my guidance and under the supervision of Mr. A.V. RAGHURAM Senior research Analyst and has completed to my fullest satisfaction for partial fulfillment of the award of degree of Master of Pharmacy in Pharmaceutical Analysis, RVS college of Pharmaceutical Sciences, Sulur, Coimbatore, which is affiliated to The Tamilnadu Dr. M.G.R Medical University, Chennai. It is to certify that the part or whole of the work has not been submitted either to this university or any other university. This work is original and confidential.
INSTITUTIONAL GUIDE
Mr. R.SIVA KUMAR, M.Pharm.,(Ph.D) Assistant Professor,
Department of Pharmaceutical Analysis, R.V.S College of Pharmaceutical Sciences, Sulur, Coimbatore-641402.
CERTIFICATE
This is to certify that the dissertation work entitled “METHOD DEVELOPMENT AND VALIDATION OF SIMULTANEOUS ESTIMATION OF TENOFOVIR
AND LAMIVUDINE IN PHARMACEUTICAL DOSAGE FORMS BY RP-HPLC” is a bonafide research work done by Mr .K.VENKATA PULLA REDDY carried out in , BIOSERVE LABORATORIES, HYDERABAD under the guidance of Mr.R.SIVAKUMAR,M.Pharm.,(Ph.D.),Assistant Professor, RVS College of pharmaceutical science, Sulur and Mr. A.V. RAGHURAM Senior research Analyst , for partial fulfillment of the requirement for the award of Master of Pharmacy in Pharmaceutical Analysis, RVS college of Pharmaceutical Sciences, Sulur, Coimbatore, which is affiliated to The Tamilnadu Dr.M.G.R Medical University, Chennai.
Dr.R.VENKATANARAYANAN, M.Pharm. Ph.D
PRINCIPAL,
R.V.S College of Pharmaceutical Sciences, Sulur, Coimbatore-641402.
CERTIFICATE
This is to certify that the dissertation work entitled “METHOD DEVELOPMENT AND VALIDATION OF SIMULTANEOUS ESTIMATION OF TENOFOVIR
AND LAMIVUDINE IN PHARMACEUTICAL DOSAGE FORMS BY RP-HPLC” is a bonafide research work done by Mr. K. VENKATA PULLAREDDY carried out in BIOSERVE LABORATORIES,HYDERABAD under the guidance Of Mr.R.SIVAKUMAR M.Pharm.,(Ph.D.),Assistant Professor, RVS College of pharmaceutical sciences, Sulur and Mr. A.V. RAGHURAM Senior research Analyst for partial fulfillment of the requirement for the award of Master of Pharmacy in Pharmaceutical Analysis, RVS college of Pharmaceutical Sciences, Sulur, Coimbatore, which is affiliated to The Tamilnadu Dr.M.G.R Medical University, Chennai.
Dr. W.D. SAMSOLOMON, M.Pharm., Ph.D Professor and Head,
Department of Pharmaceutical Analysis, R.V.S College of Pharmaceutical Sciences, Sulur, Coimbatore-641402.
CERTIFICATE
This is to certify that the dissertation work entitled “METHOD DEVELOPMENT AND VALIDATION OF SIMULTANEOUS ESTIMATION OF
TENOFOVIR AND LAMIVUDINE IN PHARMACEUTICAL DOSAGE FORMS
BY RP-HPLC” is a bonafide research work done in ORCHID HEALTHCARE, CHENNAI by Mr. K.VENKATA PULLA REDDY in partial fulfillment of the requirement for the award of Master of Pharmacyin Pharmaceutical Analysis, R V S college of Pharmaceutical Sciences, Sulur, Coimbatore,. under the supervision and guidance of Mr.R.SIVA KUMAR. M.Pharm, (Ph.D.), Assistant Professor, Department of Pharmaceutical Analysis, RVS College of pharmaceutical science, Sulur and Mr. A.V. RAGHURAM Senior research Analyst.
INTERNAL EXAMINER EXTERNAL EXAMINER
Place: Place: Date: Date:
ACKNOWLEDGEMENT
Firstly, I would like to express my whole hearted gratitude to ‘The Almighty’, without whose blessings, this endeavor would not have been completed.
It gives me immense pleasure to convey my deep sense of gratitude and heartfelt thanks to my guide Mr. R. SIVA KUMAR, AssistantProfessor, Department of Pharmaceutical Analysis, RVS college of Pharmaceutical Sciences, Sulur, Coimbatore for his help, suggestions, guidance, and the confidence that he has shown in me throughout the course of my work.
My profound gratitude to Mr. RAGHURAM Senior Research Analyst, who owed best on me to bring about successful completion of the project.
I sincerely thank Dr. R. VENKATANARAYANAN, Professor and Principal, RVS college of Pharmaceutical Sciences, Sulur, Coimbatore, for his inspirations and for being a great facilitator.
It gives me immense pleasure to convey my deep sense of gratitude and heartfelt thanks to Dr.SAM SOLOMON, Professor and HOD, Department of Pharmaceutical Analysis, RVS College of Pharmaceutical Sciences, Sulur, Coimbatore
I express my sincere gratitude to my teachers, Mr.KUMAR NALLASIVAN, Mr.VIJAYANAND, Mr.AKELESH, Mr.BARISH, Mrs.UMADEVI for their meticulous guidance and encouragement provided to me for the completion of my dissertation work.
I would like to express my gratitude to my Mr. RAMESWARA REDDY,
Mr. V. SRINIVAS REDDY, for his substantial guidance, detailed and constructive comments and supervision.
I express my sincere thanks to my respected ones,prominently to Mr. P.Rangaswami for his immense support and suggestions
Above all, I am very grateful to my family, for providing me moral support, encouragement and blessings.
My special thanks to Raviteja Pentyala, Pendyala Venkatesh, Deepika, Suresh, Dibin, Muthu, Rajeswari, Paramaleshwari, Nisha, Srinivas Reddy Yelala,
Koumudi.A and fellow trainees for their support, encouragement and help with abilities in completing my project work.
However, it would not have been possible without the kind support and help of many individuals. As a final word, I would like to extend my sincere thanks to each and every individual who have been a source of support and helped me to complete my dissertation work successfully.
1. INTRODUCTION
ANALYTICAL CHEMISTRY
Analytical chemistry1,2 may be defined as the science and art of determining the composition of materials in terms of the elements of compound contained. By means of analytical techniques both qualitative and quantitative analysis can be done.
Analytical chemistry is basically concerned with the determination of the chemical composition of matter however, identification of substance, the elucidation of its structure and quantitative analysis of its composition are the aspects covered by modern analytical techniques.
Qualitative methods yield information about the identification of atomic or molecular species or functional groups in the sample.3
Quantitative analysis establishes the relative amount of one more of the species or analyte in numerical terms. Qualitative information is required before a quantitative analysis is undertaken.
Steps involved in quantitative analysis: 3,4 Selection of method. Chemical nature of sample
Elimination of possible interferences Measurement of analyte
Calculation of results
Estimation of reliability of the results(validation) Classification of analytical methods:
Classical methods:
The classical methods for separating and determining analyte still find use in many laboratories. For qualitative analysis the separated components were then treated with reagents that yield products that could be recognized by their colors, their boiling or melting point the solubility in a series of solvents, their odour, optical activities and their refractive indexes. For quantitative analysis the amount of analyte was determined by gravimetric or titrimetric measurements the mass of the analyte or some compounds produced from the analyte was determined. In gravimetric measurements the mass of the analyte or some compounds produced from the analyte was determined.
In titrimetric procedures the volume or mass of a standard reagent required to react completely with analyte was measured.
Instrumental methods:
In the instrumental methods6 the measurement of physical properties of analysis such as conductivity, electrode potential, light absorption, emission. Mass to charge ratio and fluorescence began to be used for quantitative analysis of a variety of inorganic, organic & biochemical analytes.
Chromatographic and electrophoretic techniques for the separation of components complex mixtures prior to their qualitative or quantitative determination. Analytical methods classification 3,7
• Spectral methods
• Chromatographic methods • Electrochemical methods • Miscellaneous methods • Hyphenated methods Spectral methods:
• UV visible spectroscopy • Atomic absorption spectroscopy
• Nuclear magnetic resonance spectrometry • Electron spin resonance spectroscopy • Turbidometry
• Nephlometry
• Raman spectroscopy • X ray diffraction etc. Chromatographic methods
• Thin layer chromatography
• High performance liquid chromatography • Gas chromatography
• Super critical fluid chromatography • Paper chromatography etc...
Electrochemical methods
• Conductometry • Potentiometry • Coulometry • Voltametry • Polarography • Amperometry • Elecrogravimetry • Paper electrophoresis • Colorimetry
Miscellaneous methods
Other Hyphenated methods:
• Liquid chromatography-Mass spectroscopy,[LC-MS]
• Liquid chromatography- Nuclear magnetic resonance spectroscopy,[LC-NMR] • Gas chromatography-Mass spectroscopy[GC-MS]
• Mass spectrometry-Mass spectroscopy[MS-MS] CHROMATOGRAPHY
Chromatography8,9 is a technique used for the separation, purification and identification of the compounds of mixtures by their continuous distribution, between two phases. One is stationary phase and the other is mobile phase. As a general rule, highly polar materials are best separated using partition chromatography, while very nonpolar materials are separated using adsorption chromatography. Between extremes, either process might be applicable.
The Chromatographic technique was first invented by M.TSWETT in 1906.The term chromatography (Greek: - Khromatos – color and graphos –written) and its principles were first discovered by Mikhail Tswett.
On the general progress of science, chromatography may be regarded as an analytical technique employed for the purification and separation of organic and inorganic substances. It is also found useful for the fractionation of complex mixture, separation of closely related compound such as isomers and in the isolation of unstable substances.
In adsorption chromatography the adsorbent is usually kept constant, and the eluting solvent polarity is increased until elution is achieved. Some commonly used solvents in order of increasing polarity are: light petroleum solvents (hexane, heptanes, petroleum ether) < cyclohexane < toluene < dichloromethane < chloroform < ethyl ether < ethyl acetate < acetone < n-propanol < ethanol < water.
Principles of Chromatographic Separation:10,11
• Adsorption chromatography: a solid stationary phase and a liquid or gaseous
• Partition chromatography: a liquid stationary phase and a liquid or gaseous mobile phase.
• Size exclusion chromatography: an inert gel which acts as a molecular sieve,
and liquid mobile phase.
• Ion exchange chromatography: a solid polymeric stationary phase containing replaceable ions.
Adsorption chromatography:
In adsorption chromatography, mixture of compounds dissolved in the mobile phase, moves through a column of stationary phase, due to the affinity of the solute towards mobile or stationary phase, Solutes get separated. Which compounds have lesser affinity elute first. In normal phase the mobile phase is non polar and the stationary phase is polar where in reverse phase the mobile phase is polar and the stationary phase is non polar.1
Partition chromatography:
In partition chromatography the principle of separation is readily understood by considering the partitioning behavior of substance between two immiscible liquids. Few substances, when shaken with two immiscible liquids, partition take place completely in to one or other liquid. Instead, most distribute themselves between the liquids such that the partition coefficient (the ratio of concentrations of the substance in each phase) is a constant value independent of the total amount, provided neither phase is saturated with the substance.27
Mode of chromatographic operations:
There are three modes of chromatographic12,13 operation they are as follows: • Elution techniques
Types of chromatography techniques:
• Planar chromatography • Column chromatography
TYPES OF LIQUID CHROMATOGRAPHY14,15
• Liquid – Solid chromatography • Liquid – liquid chromatography • Gas liquid chromatography
These three types are the basic types of chromatography and these are modified to different types of chromatography. They are as follows;
• Normal phase chromatography • Reverse phase chromatography
• High performance liquid chromatography • Ion exchange chromatography
• Size exclusion liquid chromatography • Super critical fluid chromatography • Chiral chromatography
• Affinity chromatography Basic operations
Liquid chromatography16,17
1. Feed Injection:
The feed is added into the mobile phase and it is injected. The mobile phase flows through the column by the action of a pump.
2. Separation in the column:
3. Elution from the column:
After the sample is flushed or displaced from the stationary phase, the different components will elute from the column at different times. The components with the least affinity from the stationary phase (the most weakly adsorbed) will elute first, While these with the greatest affinity from the stationary phase (the most strongly adsorbed) will elute last.
4. Detection
The different components are collected as they emerge from the column. A detector analyses the emerging stream by measuring a property which is related to concentration and characteristic of chemical composition. For example the refractive index or ultra violet absorbance is measured.
High performance liquid chromatography – [HPLC]
High performance liquid chromatography (HPLC)18 is a form of column chromatography used frequently in biochemistry and analytical chemistry. The analyte is forced through a column (stationary phase) by a liquid (mobile phase) at high pressure, and the components get separated.
Principles of HPLC:
There are two types of principles which are as follows: • Isocratic elution
• Gradient elution Isocratic HPLC:
Gradient HPLC:
A further refinement to HPLC is to vary the mobile phase composition during the analysis, this is known as gradient elution. A normal gradient for reverse phase chromatography might start at 5% methanol and progress linearly to 50% methanol over 25 minutes, depending on how hydrophobic the analyte is.
Different types of HPLC Techniques:
• Normal phase chromatography. • Reverse phase chromatography. • Size exclusion chromatography. • Ion exchange chromatography.
Reverse Phase Chromatography: Reverse phase HPLC (RP-HPLC) consists of a non
polar stationary phase and a polar mobile phase and was developed due to the increasing interest in large non-polar biomolecules One common stationary phase is a silica which has been treated with RMe2SiCl, where R is a straight chain alkyl group such as C18H37 or C8C17 etc. The retention time is therefore longer for molecules which are more non-polar in nature, allowing polar molecules to elute more readily. Eluent time is increased by addition of less polar solvent.
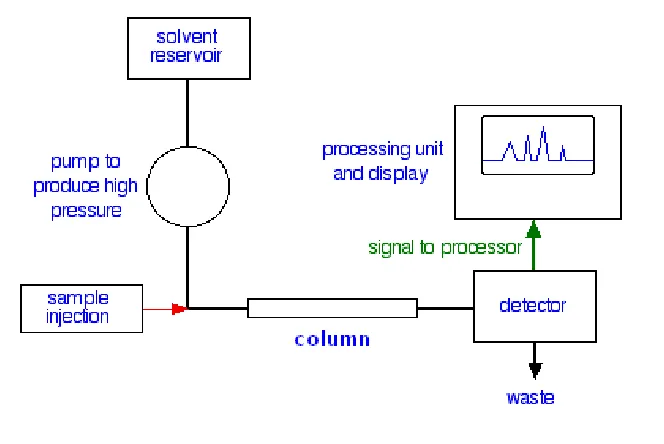
[image:15.612.138.470.493.715.2]INSTRUMENTATION OF HPLC:6,9
Fig No:1.1 FLOW SCHEME FOR HPLC
• Mobile phase • Pumps • Injector port • Stationary phase • Detector
MOBILE PHASE AND PUMPS:
MOBILE PHASE:
The mobile phase in RP-HPLC16,19 however, has a great influence on the retention of the solutes and the separation of component mixture.
The primary constituents of reverse phase-mobile phase are water miscible solvents such as methanol, ethanol, acetonitrile, dioxin, and tetra hydro furan are added to adjust the polarity of the mobile phase. The water should be high quality, either distilled or demineralised. The most widely used organic modifiers are methanol, acetonitrile and tetrahydrofuran. Methanol and acetonitrile have comparable polarities but the latter is an aprotic solvent. This factor may be important if hydrogen bonding plays a significant role in the separation. When inorganic salts and ionic surfactants are used, the mobile phase should be filtered before use, since these additivies frequently contain a significant amount of water insoluble contaminants that may damage the column. Reverse phase mobile phase are generally noninflammable due to high water content. Degassing is quite important with reverse phase mobile phase.
Selection of Mobile phase:
Soluble in organic solvent:
• Non-polar compounds
- Normal phase chromatography - Reverse phase chromatography • Polar compounds
- Non ionic
Reverse phase chromatography Ion forming
Reverse phase ion paring chromatography - Basic
Normal phase chromatography Reverse phase chromatography Reverse phase with alkaline – eluent Soluble in water:
* Non-ionic – Reverse phase chromatography
* Ion forming – Reverse phase with pH control chromatography * Strong acid or bases – Reverse phase with ion pair chromatography * Inorganic cations – Ion exchange chromatography
* Inorganic anion – Ion exchange chromatography * Organic acids – Ion exchange chromatography * Mono saccharides – Ion exchange chromatography
Reverse phase chromatography * Mono-Disaccharides– Ligand exchange chromatography
Reverse phase chromatography HPLC PUMPS:
Pumps system in HPLC is constructed from the materials that are inert to all mobile phase or solvent system used. The most commonly used materials are glass, stainless steel, Teflon and sapphire. The pumps are required to deliver a constant flow of mobile phase at pressure from 1 to 550 bar and 14.6 to 800 psi. Pumps capable of generating pressure up to 8000 psi provides a wide range of flow rate of mobile phase typically from 0.01 to 10ml min-1.
HPLC INJECTION PORT AND COLUMN:
INJECTION PORT FOR HPLC:
• Samples are injected into the HPLC via an injection port.
• The injection port of an HPLC commonly consists of an injection valve and the sample loop.
• The sample is typically dissolved in the mobile phase before injection into the sample loop.
• The sample is then drawn into a syringe and injected into the loop via the injection valve.
• A rotation of the valve rotor closes the valve and opens the loop in order to inject the sample into the stream of the mobile phase.
• Loop volumes can range between 10 µl to over 500 µl. In modern HPLC systems, the sample injection is typically automated.
STATIONARY PHASE (COLUMN):
• The stationary phase 20
in HPLC refers to the solid support contained within the column over which the mobile phase continuously flows.
• The sample solution is injected into the stationary phase through the injector port.
• As the sample solution flows with the mobile phase through the stationary phase, the components of that solution will migrate according to the non-covalent interactions of the compounds with the stationary phase.
• The chemical interactions of the stationary phase and the sample with the mobile phase, determines the degree of migration and separation of the components contained in the sample.
• There are various columns that are secondary to the separating column or stationary phase. They are: Guard, Derivatizing, Capillary, Fast, and Preparatory Columns.
COLUMN EFFICIENCY:
• Column efficiency21 refers to the performance of the stationary phase to accomplish particular separations.
• This entails how well the column is packed and its kinetic performance.
• The efficiency of a column can be measured by several methods which may or may not be affected by chromatographic anomalies, such as "tailing" or appearance of a "front."
• This is important because many chromatographic peaks do not appear in the preferred shape of normal Gaussian distribution.
• For this reason efficiency can be an enigmatic value since manufacturers may use different methods in determining the efficiency of their columns.
DETECTORS:
• The detector9 for an HPLC is the component that emits a response due to the eluting sample compound and subsequently signals a peak on the chromatogram.
• It is positioned immediately posterior to the stationary phase in order to detect the compounds as they elute from the column.
• The bandwidth and height of the peaks may usually be adjusted using the coarse and fine tuning controls, and the detection and sensitivity parameters may also be controlled (in most cases).
• There are many types of detectors that can be used with HPLC. Some of the more common detectors include: Refractive Index (RI), Ultra-Violet (UV), Fluorescent, Radiochemical, Electrochemical, Near-Infra Red (Near-IR), Mass Spectroscopy (MS), Nuclear Magnetic Resonance (NMR), and Light Scattering (LS).
• There are several ways of detecting when a substance has passed through the column. A common method which is easy to explain uses ultra-violet absorption.
• Many organic compounds absorb UV light of various wavelengths. If you have a beam of UV light shining through the stream of liquid coming out of the column, and a UV detector on the opposite side of the stream, you can get a direct reading of how much of the light is absorbed.
• The amount of light absorbed will depend on the amount of a particular compound that is passing through the beam at the time.
• One might wonder why the solvents used don't absorb UV light. They do! But different compounds absorb most strongly in different parts of the UV spectrum. • Methanol, for example, absorbs at wavelengths below 205 nm, and water below 190 nm. If you were using a methanol-water mixture as the solvent, you would therefore have to use a wavelength greater than 205 nm to avoid false readings from the solvent.
Fixed wave length measures at one wavelength, usually 254 nm.
Variable Wavelength measures at one wavelength at a time, but can detect over a wide
range of wavelengths.
Diode Array measures a spectrum of wavelengths simultaneously
• Calculation of column efficiency value:
All the following methods use this formula that measures N, or number of theoretical plates:
HPLC Methods of Analysis for Drugs14:
Most of the drugs in multicomponent dosage forms can be analyzed by HPLC method because of the several advantages like rapidity, specificity, accuracy, precision and ease of automation in this method. HPLC method eliminates tedious extraction and isolation procedures. Some of the advantages are:
 Speed (analysis can be accomplished in 20 minutes or less),  Greater sensitivity (various detectors can be employed),  Improved resolution (wide variety of stationary phases),
 Reusable columns (expensive columns but can be used for many analysis),  Ideal for the substances of low volatility,
 Easy sample recovery, handling and maintenance,
 Instrumentation tends itself to automation and quantitation (less time and less labour),
 Precise and reproducible,
 Calculations are done by integrator itself,
QUANTITATION
Quantitation Methods in HPLC:4, 17
Peak height or peak area measurements only provide a response in terms of detector signal. This response must be related to the concentration or mass of the compound of interest. To accomplish this, some type of calibration must be performed.
The four primary techniques for quantitation are 1. Normalized peak area method
2. External Standard method 3. Internal Standard method 4. Method of Standard addition
1. Normalized peak area method:
The area percent of any individual peak is referred to the normalized peak area. This technique is widely used to estimate the relative amounts of small impurities or degradation compounds in a purified material and in this method; the response factor for each component is identified.
2. External Standard method:
This method includes injection of both standard and unknown and the unknown is determined graphically from a calibration plot or numerically using response factors. A response factor (Rf) can be determined for each standard as follows.
Standard Area (Peak height)
Rf =
Standard Concentration
3. Internal Standard method:
A widely used technique of quantitation involves the addition of an internal standard to compensate for various analytical errors. In this approach, a known compound of a fixed concentration is added to the known amount of samples to give separate peaks in the chromatograms to compensate for the losses of the compounds of interest during sample pretreatment steps. Any loss of the component of interest will be accompanied by the loss of an equivalent fraction of the internal standard. The accuracy of this approach obviously dependence on the structural equivalence of the compounds of interest and the internal standard.
The requirements for an internal standard are:
a. It must have a completely resolved peak with no interferences, b. It must elute close to the compound of interest,
c. It must behave equivalent to the compound of interest for analysis like pretreatments, derivative formations, etc.
d. It must be added at a concentration that will produce a peak area or peak height ratio of about unity with the compound,
e. It must not be present in the original sample,
f. It must be stable, unreactive with sample components, column packing and the mobile phase and
g. It is desirable that this compound is commercially available in high purity.
The internal standard should be added to the sample prior to sample preparation procedure and homogenized with it. To be able to recalculate the concentration of a sample component in the original sample, we have to demonstrate first the response factor. The response factor (RF) is the ratio of peak areas of sample component (Ax) and the internal standard (AISTD) obtained by injecting the same quantity. It can be calculated by using the formula,
STD I A
Ax Rf
On the basis of the response factor and strength of the internal standard (NISTD), the amount of the analyte in the original sample can be calculated using the formula,
STD
STD F
S xN
A R
A
X 1.
1
.
=
The calculations described above can be used after proving the linearity of the calibration curve for the internal standard and the analytical reference standard of the compound of interest. When more than one component is to be analyzed from the sample, the response factor of each component should be determined in the calculations using similar formula.
4. Method of Standard addition:
The method of standard addition can be used to provide a calibration plot for quantitative analysis. It is most often used in trace analysis. An important aspect of the method of standard addition is that the response prior to spiking additional analytes should be high enough to provide a reasonable S/N ratio (>10), otherwise the result will have poor precision.
ANALYTICAL METHOD DEVELOPMENT22,23
Selecting an accurate assay procedure for each ingredient present in pharmaceutical dosage forms, either individually or complex dosage formulation containing several therapeutically and chemically compatible drugs with very similar chemical nature is a monumental undertaking.
Separation, identification and estimation of each ingredient in such complex formulation are a challenging task. The presence of excipients, additives and decomposition products further complicates the analysis. Therefore analytical development is done for new drug where no methods are available. Or, alternate method development for existing (non pharmacopoeia) products to reduce cost and time of analysis.
Method development is done for 1. New products
Methods are developed for new products when no official methods are available. Alternate methods for existing (non-pharmacopoeia) products are developed to reduce the cost and time for better precision and ruggedness.
STEPS TO BE FOLLOWED IN METHOD DEVELOPMENT
Method development22 starts with the documentation of the developed studies. All data related to these studies must be established and they must be recorded in laboratory notebook or an electronic data base.
1. Standard Analyte Characterization:-
¾ Collection of information about the analyte or drug should be collected starting from the structure, physical, chemical properties toxicity, purity, hygroscopic nature, solubility and stability.
¾ Reference standard for the sample should be obtained. In case of multiple components for the analysis to be analyzed in the sample, number of components should be noted, data is assembled and the availability of standards for each one is determined.
¾ Proper storage are set for the reference standards (refrigerators, dessicator, freezer).
¾ A suitable method for the sample is considered. 2. Method Requirements:-
The aim or requirement of the analytical method that need to be developed all considered and the analytical figures of merit are defined. The required detection limits, selectivity, linearity, range, accuracy and precision are defined.
3. Literature Search and prior Methodology:-
4. Choosing of Method:-
¾ Adaptation is more efficient than “reinventing the wheel”. If any of the reported methods from the literature are adaptable to the current laboratory setting and future needs, it is determined.
¾ From the various source a methodology is adopted. The methods are modified.
¾ If there are no reported details for the drug or the chemical then the drugs are investigated and are worked out.
5. Instrumental Setup and Initial Studies:-
¾ By using the data made for the analyte a suitable instrument method is selected. The instrument is set up by using standard operation procedure. ¾ Analyte reference standard is prepared in suitable concentration by using
various combination of solvent system. It is important to start with reference standard substance rather then complex sample components.
¾ The analysis is made for the various conditions described in the existing literature.
6. Optimization:
During optimization one parameter is changed at a time, and set of conditions are isolated, rather than using a trial and error approach. Work has been done from an organized methodological plan, and every step is documented (in a lab note book) in case of dead ends.
7. Documentation of analytical figures:
The originally determined analytical figures of merit, Limit of quantitation [LOQ] and Limit of the detection [LOD], linearity, time per analysis cost, sample preparation etc are documented.
8. Evaluation of Method Development with actual Sample:
9. Determination of Percent Recovery of Actual Sample and Demonstration of Quantitative Sample Analysis:
Percent recovery for the standard analyte into a sample matrix that is shown to contain no analyte is determined. Reproducibility of recovery from sample to sample and whether the recovery has been optimized has been shown. It is not necessary to obtain 100% recovery as long as the results are reproducible and known with high degree certainty.
The validity of analytical method can be verified only by laboratory studies. Therefore documentation of the successful completion of the studies is the basic requirement for determining whether a method is suitable for its intended applications.
Validation is an approach to form a basis for written procedures for production and process control which are designed to assure that the drug products have the identity strength, quality, and purity they purport or are represented to possess.
VALIDATION OF ANALYTICAL METHOD DEVELOPMENT
Introduction:
Analytical method validation24,25
is the process of demonstrating that analytical procedures are suitable for their intended use and provide accurate test results that evaluate a product against its defined specification and quality attributes.
It is process involving confirmation or establishing by laboratory studies the method / procedure/ system/ analyte gives accurate and reproducible result for intended application in a proven and established range. That performance characteristic of the method (accuracy, precession, sensitivity, ruggedness etc).
Definitions of validation:
World health organization (WHO): Action of providing that any procedure, process,
equipment, material activity, or system actually reads to the expected results.
Food and drug administration (FDA US): Establishing documentation evidence,
European committee(EC): action of providing in accordance with the principle of
good manufacturing practice, that any procedure process equipment material, activity or system actually read to the expected result.
Types of validation:26
Prospective Validation: At least three successive production size (US Via) batches, all
batches made tested and report approved before distribution facilities and equipment qualified.
Concurrent Validation: Generation of validation data concurrent or simultaneously
with normal production schedules used in exceptional cases (low volume products); interim reports required.
Retrospective Validation: This is establishing documented evidence that the process is
performed satisfactorily and consistently over time, based on review and analysis of historical data. The source of such data is production and QA/QC records. The issues to be addressed here are charged to equipment, process, specification and other relevant changes in the past.
1.9.1 VALIDATION OF ANALYTICAL PROCEDURES 19,27
Definitions, Methodologyand Acceptance Criteria:
Different Types of Validation characteristics:
Precision Accuracy
Specificity and Selectivity Linearity and Range Solution stability
Limit of Detection (LOD) Limit of Quantification (LOQ) Robustness
Generalized validation process for an HPLC assay method:
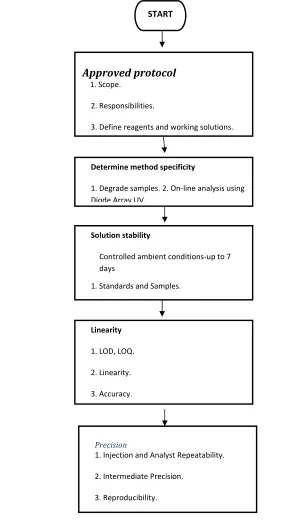
[image:29.612.137.419.201.724.2]Validation11 is the process of collecting documented evidence that the method performs according to its intended purpose. The validation process has been described as follows:
Table No: 1 schematic diagram of method development
START
Approved protocol
1. Scope.
2. Responsibilities.
3. Define reagents and working solutions.
Determine method specificity
1. Degrade samples. 2. On‐line analysis using Diode Array UV.
Solution stability
Controlled ambient conditions‐up to 7 days
1. Standards and Samples.
Linearity
1. LOD, LOQ.
2. Linearity.
3. Accuracy.
Precision
1. Injection and Analyst Repeatability.
2. Intermediate Precision.
1. Accuracy
Accuracy2 is the closeness of test
results obtained by that method to the true value. The accuracy of an analytical method should be established across its range. There are several methods that can be used for determining accuracy. The most common include
Analyze a sample of known concentration and compare the measurement to the true value. In this case, method accuracy is the agreement between the difference in the measured analyte concentration and the known amount of analyte added. That is the accuracy or % recovered is calculated as:
Cm × 100
Ct
Where Cm is the measured concentration
Ct is the theoretical concentration.
Accuracy has also been reported as a sample is analyzed and the measured value should ideally be identical to the true value. Accuracy is represented and determined by recovery experiments. The usual range is being 10% above or below the expected range of claim. The % recovery was calculated using the formula,
(a + b) -a
Percentage Recovery = b×100 Where,
a – Amount of drug present in sample
b – Amount of standard added to the sample
Evaluation and Final Report
1. Process and Evaluate Results and Data.
2. Compare Results Vs Acceptance Criteria.
ICH states that accuracy should be assessed using a maximum 9 determination over a minimum of 3 concentration levels covering the specified range (eg. 3 concentration /3 replicates each of the total analytical procedure).
Acceptance Criteria:
¾ For an assay method, mean recovery will be 100%± 2% at each concentration over the range of 80-120% of the target concentration. ¾ For an impurity method, mean recovery will be 0.1%
absolute of the theoretical concentration or 10% relative, whichever is greater for impurities in the range of 0.1-2.5 % (V/W).
2. Precision:
Precision25,28 of an analytical procedure expressed the closeness of agreement (degree of scatter) between a series of measurement obtained from multiple samplings of the same homogeneous sample under prescribed condition.
The precision of test method is usually expressed as the standard deviation or relative standard deviation of a series of measurements. Precision may be considered at three levels: Repeatability, Intermediate Precision and Reproducibility.
System precision:
A System precision was evaluated by measuring the peak response of drug for six replicate injection of the standard solution preparation as per the proposed method. Method precision:
The method precision was determined by preparing the sample of a single batch of the drug for tablet formulation six times and analysed as per the propsed method. Acceptance Criteria:
¾ Percentage Relative standard deviation (%RSD) NMT 1 % (Instrument precision)
3. Specificity: Specificity28
is the ability to assess unequivocally the analyte in the presence of components which may be expected to be present. Typically these might include impurities, degradants, matrix, etc. Specificity shall be demonstrated by performing Placebo / blank interference and forced degradation studies.
a. Blank interference:
Blank solution is prepared and analysed as per test method. b. Placebo interference (In case of Drug products):
The placebo solution equivalent to the test concentration is also prepared and analysed as per the test method.
4. Forced Degradation studies:
The sample is degraded forcefully under the various stress conditions like Light, heat, humidity, acid / base / water hydrolysis and oxidation to ensure the degradation ranging 1 % to 20 %.
a) Light: The Drug product, drug substance and placebo are exposed to UV light
for about 200 watt hours / square meter and the overall illumination not less than 1.2 million Lax hours for visible light. The sample and placebo solution are prepared as per test method and analyzed.
b) Humidity: The Drug product, drug substance and placebo are exposed for about 80% RH at about 25°C for about one week. Prepare the sample and placebo solution as per test method and analyzed.
e) Oxidation: The sample was refluxed for 12 hour at 60°C with 1 % H2O2 or suitable oxidant and dissolved the contents in diluents as per test method. The reflux time was changed so as to ensure the desired degradation.
f) Water: The sample / placebo was refluxed with 100 ml of purified water for 12
hour at 60°C. Dissolve the contents in diluents as per test method. Change the reflux time so as to ensure the desired degradation.
Note: Based on the physic-chemical properties and literature stress conditions can be decided.
Acceptance Criteria:
¾ Placebo / Blank should not elute at the retention time of analyte peak and known impurity peak.
¾ Peak purity of analyte peak should be confirmed.
¾ Degradation of active analyte peak should be from 1% to 20%.23
5. Limit of Detection:
The limit of detection4 is the lowest concentration of analyte in a sample that can be detected but not necessarily determined in quantitatively using a specific method under the required experimental conditions. Such a limit is expressed in terms of concentration of analyte in the sample.
Following are different approaches:
1. Visual Evaluation Method:
The sample solutions have to be prepared with known lowest concentrations of analyte and establish the minimum concentration at which the analyte can be reliably detected by analyzing as per test method.
a. Based on Signal to Noise Ratio Method:
The LOD can be expressed as a concentration at specified signal-to-noise
b. Based on the standard Deviation of the Response and the Slope:
¾ The blank solution has to be prepared as per test method and inject six times into the chromatographic system.
¾ Similarly the linearity solution staring from lowest possible concentration of analyte to 150 % (or as per protocol) of target concentration have to be prepared to establish the linearity curve.
The detection limit (DL) may be expressed as :
3.3 X Standard deviation of the response of the blank (σ)
LOD =
Slope
S= slope of the calibration curve of the analyte.
The slope shall be estimated from the calibration curve of the analyte. 6. Limit Of Quantitation:
The limit of quantitation4 is the lowest concentration of the analyte in a sample that can be determined with acceptable precision and accuracy under the stated experimental conditions quantitation limit is expressed as the concentration of analyte (eg. Percentage, parts per million) in the sample.
Following are different approaches:
a. Visual Evaluation Method:
The sample solutions with known lowest possible concentrations of analyte and establish the minimum concentration at which the analyte can be reliably quantified by analyzing as per test method.
b. Based on signal to noise ratio method :
concentration and the required precision and accuracy. That is, as the LOQ concentration level decreases, the precision increases.
c. Based on the standard Deviation of the Response and the Slope:
The blank solution as per test method and inject six times into the chromatographic system. Similarly the linearity solution staring from lowest possible concentration of analyte to 150% (or as per protocol) of target concentration and establish the linearity curve.
The limit of quantitation (LOQ) may be expressed as :
10 X Standard deviation of the response of the blank(σ)
LOQ =
Slope
The slope shall be estimated from the calibration curve of the analyte. Acceptance Criteria:
¾ In Pharmaceutical application, the LOQ is typically set at minimum 0.05% for active pharmaceutical ingredients.
¾ LOQ is defined as the lowest concentration providing a RSD of 5%.
¾ LOQ should be at least 10% of the minimum effective concentration for clinical applications.
¾ Signal -to- noise ratio is 10:1. 7. Linearity and range:
Linearity: Linearity is the ability of the method to obtain test results that are directly proportional to the analyte concentration within a given range.
Range: Range of analytical procedure is the interval between the upper and lower
concentration of analyte in the sample (including concentrations) for which it has been demonstrated that the analytical procedure has a sutable level of precision, accuracy, and linearity.
Measurement: A range of standards should be prepared containing at least 5 different
At least 6 replicates per concentration to be studied. Plot a graph of concentration (on X-axis) Vs mean response (on Y-axis) calculates the regression equation.
Y – Intercept and correlation coefficient. Plot another graph of concentration (on X-axis) Vs response ratio (replicate response divided by concentration on Y-axis).
The range of the method is validated by verifying that the analytical method provides acceptable precision, accuracy, and linearity when applied to sample containing analyte at the extreme of the range as well as within the range.
Acceptance criteria:
Coefficient of correlation should be NLT 0.99. 8. Ruggedness:
Degree of reproducibility of test results obtained by the analysis of the same sample under a verity of conditions, such as different laboratories, different analysts, different instruments etc.
Normally expressed as the lack of influence on test results of operational and environmental variable of the analytical method.
Ruggedness is a measure of reproducibility of test results under the variation in condition normally expected from laboratory to laboratory and from analyst to analyst
The following are the typical method parameters need to tested during method validation:
¾ Analyst-to-Analyst variability. ¾ Column-to-Column variability. ¾ System-to-System variability. ¾ Different days.
¾ Different Laboratories.
9. Robustness:
Robustness of an analytical method is a measure of its capacity ti remain un
affectedly small but deliberate variations in method parameters and provides an indication of its reliability during normal usage.
For example a chromatographic method, the typical method parameters need to change deliberately and verify during method validation:
Flow rate : (+/- 0.2ml/minutes). Mobile phase composition : (+/- 10% of organic phase). Column oven temperature : (+/- 5°C).
PH of buffer in mobile phase : (+/- 0.2 units). Filter suitability : (At least two filters). For Variations:
1. System suitability should meet the acceptance criteria as per test method.
2. If system suitability doesn’t meet, the variation range is narrowed and carried out the experiment again to meet system suitability.
10. SYSTEM SUITABILITY TESTING
System suitability testing14 is an integral part of many analytical procedures. The tests are based on the concept that the equipment, electronics analytical operation and samples to be analyzed constitute an integral system that can be evaluated as such. System suitability test parameters to be established for a particular procedure depend on the type of procedure being validated.
System Suitability Parameters ¾ Tailing factor
¾ Resolution factor ¾ Capacity factor
¾ Precision / Injection repeatability ¾ Relative retention
a. Tailing factor:
Asymmetry factor24 of a peak was calculated from the following expression: Peak tailing factor =
A
2
B
A
+
A – Left half of the peak at 5% peak height when the peak is bisected with a perpendicular line dropped from the maximum of peak interest.
B – Right half of the peak at 5% peak height when the peak is bisected with a perpendicular line dropped from the maximum of peak interest.
b. Theoretical plate number (N):24
The assessment of performance of column efficiency of a column is in terms of number of theoretical plate
An equation shown below:
N = 5.54[t/wh/2] Where,
t = Retention time
Wh/2 = width of peak at half weight
Theoretical plate number is a measure of column efficiency. i.e. how many peaks can be located per unit run time of the chromatogram ,‘H’ or ‘HETP’, the height equivalent to the theoretical plate, measures the column efficiency per unit length of the column. Parameters which can affect ‘N’ or ‘H’ include peak position particle size in column, flow rate of mobile phase and molecular weight of the analyte.
c. Capacity factor:22
K1= (tr-to)-to
[tr – retention of analyte, to – retention of void or unretained component.]
Methods used for the examination of pharmaceutical material may be broadly classified as;
d. Resolution: 27
R = 2 [(t2-t1)/ w2+w1]
t2, t1 are the retention time
w2, w1 are the peak width at base line respectively.
Resolution is to measure how well the resulting two peaks are separated. For reliable quantitation well separated peaks are essential for quantitation. This is a very useful parameter if potential interference peak may be of concern. The closest eluting peak to the analyte should be selected.
System Suitability Parameters and Recommendations (ICH Guidelines)
Parameter Recommendation
Capacity Factor (k’) the peak should be well-resolved from other peaks and the void volume, generally k’>2.0
Repeatability RSD </= 1% for N >/= 5 is desirable.
Relative retention not essential as long as the resolution is stated.
Resolution (Rs) Rs of > 2 between the peak of interest and the closest eluting potential interferent (impurity, excipients, degradation product, internal standard, etc). Tailing Factor (T) T of </= 2
Class A: Test designed to establish identity, whether of bulk drug substances or particular ingredient in a finished dosage form.
Class B: Method designed to detect and quantitative impurities in a bulk drug substance or finished dosage form.
Class C: Methods used to determine quantitatively the concentration of a bulk drug substance or of a major ingredient in a finished dosage form.
Class D: Methods used to assess the characteristics of finished dosage forms such as dissolution profile and content uniformity.
Table No: 2 Characteristics that should be considered for different Type of analytical procedure:-
S.No Parameters Class A
Class B
Class C Class D Quantitative
test
Limit test
1. Accuracy - Yes - Yes Yes
2. Precision - Yes - Yes Yes
3. Robustness Yes Yes Yes Yes Yes
4. Linearity and
Range - Yes - Yes Yes
5. Selectivity Yes Yes Yes Yes Yes
6. LOD Yes Yes Yes - -
2. LITERATURE REVIEW
1. Anindita Behera et al 29., (2011) have down Development and validation of Spectrophotometric method for determination of Emtricitabine and Tenofovir Disoproxil Fumarate in Bulk and Tablet dosage form. Three simple Spectrophotometric methods have been developed for simultaneous estimation of Emtricitabine and Tenofovir Disoproxil Fumarate from tablet dosage form. Method A is Least Square method, involves the measurement of Emtricitabine and Tenofovir
Disoproxil Fumarate at their λmax at 281.0 nm and 260.5nm respectively. Method B
is First order derivative spectroscopy, wavelength selected for quantitation were 234.5nm for Emtricitabine (zero cross for Tenofovir Disoproxil Fumarate ) and 281.0nm for Tenofovir Disoproxil Fumarate (zero cross for Emtricitabine). Method C is Area under Curve method, AUC in the range of 278.0- 283.0nm (for Emtricitabine) and 258.0- 262.0nm (for Tenofovir Disoproxil Fumarate) were selected for the
analysis. The linearity lies between 5-25μg/ml and 10–50μg/ml for Emtricitabine and
Tenofovir Disoproxil Fumarate respectively for method A, B and C.
2. Rajesh Sharma1 et al 30., (2009) have developed RP- HPLC Method for Simultaneous Estimation of Emtricitabine and Tenofovir Disoproxil Fumerate in a Tablet Dosage Form. The estimation was carried out on Luna C18 (25cm x 4.60 mm,
particle size 5μm) column with a mixture of acetonitrile: potassium dihydrogen
phosphate buffer (pH 3.0 ± 0.05 adjusted with orthophosphoric acid): triethylamine in the ratio of 70:30:0.5(v/v) as mobile phase. UV detection was performed at 260 nm. The method was validated for linearity, accuracy, precision, specificity and sensitivity as per ICH norms. The developed and validated method was successfully used for the quantitative analysis of commercially available dosage form. The retention time was 1.78 and 2.27 min. for emtricitabine and tenofovir disoproxil fumarate respectively and total run time was 4 min. at a flow rate of 1.5 mL min-1. The calibration curve
was linear over the concentration range of 5-50 μg mL-1 for emtricitabine and 5-50 μg
mL-1 for tenofovir disoproxil fumarate. The LOD and LOQ values were found to be
0.015 and 0.045 μg mL-1 for emtricitabine and 0.039 and 0.117 μg mL for tenofovir
coefficient of variance confirm the suitability of the method for the simultaneous estimation of emtricitabine and tenofovir disoproxil fumarate in tablet dosage form
3. Shirkhedkar Atul A et al31., (2009) have work down application of uv- spectrophotometric methods for estimation of Tenofovir disoproxil fumarate in tablets. Tenofovir disoproxil fumarate was estimated at 260 nm in 0.1N HCl. It showed amplitude at 273 nm, In both the methods linearity was found to be in the
range of 5 - 40 μg/ml. UV- Spectrophotometric method (Y=0.02586 X+0.0083;
r2=0.9999) and for first order derivative spectrophotometric method (Y=0.00132 X+0.00035; r2=0.9995), respectively. These methods were tested and validated for various parameters according to USP guidelines. The quantitation limits were found
to be 1.546 and 1.986μg/ml, for both the methods.
4. Manish Yadav et al 32., (2010) have done Selective Determination of Antiretroviral Agents Tenofovir, Emtricitabine, and Lamivudine in Human Plasma by a LC-MS-MS Method for a Bioequivalence Study in Healthy Indian Subjects. The chromatographic separation is achieved in a run-time of 3.0 min on an ACE 5 CN column under isocratic conditions. The mobile phase consisted of 0.5% formic acid in water and acetonitrile (55:45, v/v). The protonated precursor product ion transitions for TFV, FTC, 3TC, and internal standard were monitored on a triple quadrupole mass spectrometer operating in the multiple reaction monitoring (MRM) and positive ion mode. A linear dynamic range of 4.0-802 ng/mL, 15.0-3006 ng/mL, and 20.1-4023 ng/mL is established for TFV, FTC, and 3TC, respectively, using 0.2 mL plasma sample. The method is fully validated for its sensitivity, selectivity, accuracy and precision, ion suppression, matrix effect, recovery, stability, and dilution integrity. It is successfully applied to a bioequivalence study of [300(TFV) + 200(FTC) + 300(3TC)] mg tablet formulation in 43 healthy human subjects under fasting conditions.
pharmacetuical dosge form. Chromatography was carried out by using Chromosil C-18 column internal diameter with a mixture of methanol, acetonitrile and TEA in the ratio of 46:50:04 (v/v/v) as mobile phase. Determination of the different analytical parameters such as linearity, precision, accuracy, and specificity, limit of detection (LOD) and limit of quantification (LOQ) was done. The calibration curve was found to be linear for each analyte in the desired concentration range. The % recovery was found to be 99.59 and 99.61 for Tenofovir and Emtricitabine respectively. The proposed method is highly sensitive, precise and accurate, which was evident from the LOD value of 0.05 and 0.02 ppm for Tenofovir and Emtricitabine respectively and hence the present method can be applied successfully for the quantification of active pharmaceutical ingredient (API) content in the combined formulations of Tenofovir and Emtricitabine.
6. P.Chandra et al.,34 have done application of high-performance thin-layer chromatographic method for the simultaneous determination of lamivudine and tenofovir disoproxil fumarate in pharmaceutical dosage form The separation was
carried out on Merck HPTLC aluminum plates of silica gel 60 F254, with 250 µm
thickness using chloroform: methanol: toluene (8: 2: 2, v/v/v) as mobile phase. HPTLC separation of the two drugs followed by densitometric measurement was carried out in the absorbance mode at 265 nm. The drugs were satisfactorily resolved
with Rf values of 0.27± 0.01 and 0.51± 0.01 for LAM and TDF, respectively. The
linear regression analysis data for the calibration plots showed good linear relationship
with r2=0.9999 and 0.9996 for Lamivudine and Tenofovir disoproxil fumerate
respectively in the concentration range of 60-210 ng spot1 for each drug.
7. R.Sharma etal35.,(2010) developed a Simultaneous spectrophotometric estimation of tenofovir disoproxil fumarate and lamivudine in three component tablet formulation containing efavirenz. The absorption maxima of the drugs were found to be 247, 259 and 272 nm, respectively for efavirenz, tenofovir disoproxil fumarate and lamivudine in methanol : water (50:50) solvent system. Efavirenz, tenofovir disoproxil fumarate and
respectively. Results of analysis for all the three methods were analysed and validated for various parameters according to ICH guidelines.
8. Ramesh.J et al 36 ., have done Simultaneous Estimation of Lamivudine and Tenofovir
Disoproxil Fumerate in Pure and in Tablet Formulation by First Derivative
Spectrophotometric Method. The solutions of standard and sample were prepared in methanol. Quantitative determination of the drugs was performed at 261 nm and at 249 nm for Lamivudine and Tenofovir disoproxil fumerate, respectively. Proposed method was evaluated for the different validation parameters. The specificity test showed that there was no interference from excipients commonly found in the commercial pharmaceutical formulations at the analytical wavelengths of Lamivudine and Tenofovir disoproxil fumerate. Quantification was achieved over the concentration
range of 5 – 30 μg/ ml for Lamivudine and for Tenofovir disoproxil fumerate
respectively. The correlation coefficient of Lamivudine and Tenofovir disoproxil fumerate was found to be 0.9991 and 0.9992 respectively.The mean recovery was 100.21and 98.96 % for Lamivudine and Tenofovir disoproxil fumerate, respectively. This method is simple, precise, and sensitive and applicable for the simultaneous determination of Lamivudine and Tenofovir disoproxil fumerate in pure powder and formulation.
9 Malipatil S M et al 37., (2009) have reported the determination of Tenofovir Disoproxil Fumarate by a sensitive simple isocratic RP-HPLC method using Luna C18 column, mobile phase is 0.1%formic acid: acetonitrile (50:50), flow rate is 0.8ml/min with UV detection is 305nm.
10. S. Sentenac, et al 38., (2003) have done the Sensitive determination of tenofovir in
human plasma samples using reversed-phase liquid chromatography. A solid–liquid extraction procedure was coupled with a reversed-phase HPLC system. The system
requires a mobile phase containing Na2HPO4 buffer, tetrabutylammonium hydrogen
sulfate and acetonitrile for different elution through a C18 column with UV detection.
11. Alain Pruvost et al39., have done Pilot Pharmacokinetic Study of Human Immunodeficiency Virus-Infected Patients Receiving Tenofovir Disoproxil Fumarate (TDF) Investigation of Systemic and Intracellular Interactions between TDF and
Abacavir, Lamivudine, or Lopinavir-Ritonavir Liquid chromatography-tandem mass
spectrometry was used to measure NRTIs and NRTI-TPs. Statistical analyses were performed on pharmacokinetic parameters: the area under the concentration-time curve
from 0 to 4 h , the maximum concentration of the drug (Cmax), and the residual
concentration of the drug at the end of the dosing interval (Ctrough) for plasma and the
3.1 LAM
Molecula
Molecula
Chemica
Molecula
Category
MIVUDINE
3ar Structur
ar Formula
al Name
ar Weight
y
32
re :
a : C8H11
:
4-ami
oxathiola
:
229.2
:
Anti-H
Nucleo
Revers
3. DRU
Lamiv
1N3O3S
ino-1-[(2
R
,5
an-5-yl]-1,2-6 g/mol
HIV Agents
oside and Nu
se Transcript
UG PROF
vudine
5
S
)-2-(hydro
Physical Properties of Lamivudine
Color :
White crystalline solid
Melting Point :
160-162
oC
State :
Tablet
Solubility :
Aqueous solubility - 70mg/ml at 20
0c
Highly Soluble in 0.01 N Hcl
Pharmacological Properties
Dosage Form :
Tablet
Route of administration :
Oral
Pharmacology :
Lamivudine was rapidly absorbed after oral administration in HIV-infected
patients. Absolute bioavailability in adults is 86% ± 16% for the tablet and 87% ± 13% for the
oral solution
Mechanism of Action :
Lamivudine is an analogue of cytidine. It can inhibit both types (1 and
2) of
HIV
reverse transcriptase
and also the reverse transcriptase of
hepatitis B. It is
phosphorylated to active metabolites that compete for incorporation into viral DNA. They inhibit
the HIV reverse transcriptase enzyme competitively and act as a chain terminator of DNA
synthesis. The lack of a 3'-OH group in the incorporated nucleoside analogue prevents the
formation of the 5' to 3'phospho di ester linkage essential for DNA chain elongation, and
3.2 TEN
Molecul
Molecula
Chemic
Molecula
Category
Color
Melting
State
NOFOVIR
29lar Structur
ar Formula
al Name
ar Weight
y
Physica
Point
:
9
re:
a :
C
9H
14:
({[(2
R
)
methy
:
287.21
:
Anti-H
Nucle
Reve
l Properties
:
White cr
:
276-28
Tablet
Tenofovir
N
5O
4P
)-1-(6-amino
yl) phosphor
13 g/mol
HIV Agents
eoside and N
rse Transcrip
s of Tenofov
rystalline
0
oC
r disoproxil
o-9
H
-purin-9
Solubility :
Slightly soluble in water, soluble in methanol, sparingly
soluble in acetone, very slightly soluble in
methylene chloride.
Pharmacological Properties
Dosage Form :
Tablet
Route of administration :
Oral
Pharmacology :
Tenofovir exhibits longer serum (7 hours) and intracellular (>60 hours) half –
lives than those of nucleoside analogues, which supports a flexible once – daily administration
schedule. The pharmacokinetics of Tenofovir are dose – proportional and similar in healthy
volunteers and HIV – infected individuals. The oral bioavailability of Tenofovir is enhanced by
administration with a
high – fat meal, but is similar at steady state when administered with or
without a typical meal
.
Mechanism of Action :
Before phosphorylation, tenofovir disoproxil fumarate is converted to
tenofovir in the intestinal lumen and plasma by di ester hydrolysis. Tenofovir is then internalized
into cells, possibly by endocytosis, and subsequently phosphorylated in sequential steps to
tenofovir monophosphate and to the active metabolite, tenofovir di phosphate. In a mechanism
similar to that of NRTIs, tenofovir di phosphate competes with its natural nucleotide counterpart,
deoxy adenosine 5´-triphosphate, for incorporation into newly forming HIV DNA. Once
successfully incorporated, termination of the elongating DNA chain ensues, and DNA synthesis
is interrupted. Although the end result of tenofovir activity is similar to that of the NRTIs, subtle
differences exist between this class of drugs and tenofovir. Like tenofovir, NRTIs also must be
phosphorylated to active metabolites to inhibit reverse transcription of RNA into DNA.
However, since tenofovir already contains a phosphate group attached to the adenine base, the
initial addition of a phosphate group is circumvented; thus, only two steps are required in the
4. AIM AND OBJECTIVE
¾
Lamivudine is a nucleoside reverse transcriptase inhibitor. It can inhibit both types of
HIV reverse transcriptase and also the reverse transcriptase of Hepatitis B. Tenofovir
Disoproxil Fumarate is fumaric acid salt of the bis isopropoxy carbonyl oxy methyl ester
derivative of tenofovir. Nucleotide reverse transcriptase inhibitors used in combination
for the treatment of HIV infection.
¾
Literature survey reveals that Tenofovir Disoproxil fumerate and Lamivudine is
estimated individually by UV, derivative – HPLC, Plasma RP-HPLC and Plasma
LC/MS/MS methods. Few RP-HPLC methods were reported for estimation of
Emtricitabine, Tenofovir and efavirenz in pharmaceutical formulation.
¾
RP-HPLC, LC-MS/MS and HPTLC methods were reported for the simultaneous
estimation of Emtricitabine and Tenofovir disoproxil fumerate in human plasma and in
formulations. Also UV, HPLC, LC–MS, HPTLC and enzymatic assay methods were
reported for the simultaneous estimation of Lamivudine with other antiretero viral drugs.
¾
To the best of our knowledge, there is no reported RP-HPLC method for Simultaneous
Estimation of Lamivudine and Tenofovir disoproxil fumerate in pharmaceutical
formulations, previous to our work.
¾
Thus, efforts were made to develop fast, selective and sensitive analytical method for
Simultaneous estimation of Lamivudine and Tenofovir disoproxil fumerate in their
5. PLAN OF WORK
Aimed to develop Simultaneous estimation method and validation for Lamivudine and
Tenofovir in Pharmaceutical dosage form.
The plan of the proposed work includes the following steps:
•
The extensive survey of literature for Lamivudine and Tenofovir regarding their
physico-chemical properties and analytical methods. This forms the basis for the development of