RIT Scholar Works
Theses Thesis/Dissertation Collections
5-1-1977
Correlation Study Between Subjective and
Objective Scene Classifications
Craig Campbell
Follow this and additional works at:http://scholarworks.rit.edu/theses
This Thesis is brought to you for free and open access by the Thesis/Dissertation Collections at RIT Scholar Works. It has been accepted for inclusion in Theses by an authorized administrator of RIT Scholar Works. For more information, please [email protected].
Recommended Citation
Rochester, New York
CERTIFICATE OF APPROVAL
MASTER'S THESIS
This 1.S to certify that the Maste·r' s Thesis of
Craig A. Campbell
with a major in Printing Technology
has been approved by the Thesis .Committee as satisfactory for the thesis requirement for the Master of Science degree at the convocation of
May, 1977
Thesis Connnittee: Milton Pearson Thes1.s Adv1.sor
Name Illegible Graduate Adv1.sor
Name Illegible
SUBJECTIVE AND OBJECTIVE
SCENE CLASSIFICATIONS
by
Craig A. Campbell
An Abstract
A< thesis submitted in partial fulfillment of the
requirements for the degree of Master of Science in the
School of Printing in the College of Graphic Arts and Photography of the Rochester Institute of Technology
May, 1977
ABSTRACT
In addition to the quality of an original (transparency
or reflection) preferred halftone reproduction is also depend
ent on scene classification. That is, how the tones of the
original are rendered. If the majority of the picture area
contains light tones, it is referred to as a high key image.
Should the majority of picture area be confined to dark
tones, it is referred to as a low key image. When the picture
area is composed of the entire tone scale (white, grays, and
black), it is referred to as a normal key image.
The problem of how to objectively classify images into
high, normal, and low key scene classification still continues
in the graphic arts. The intent of this thesis was to deter
mine if a scanning device could be attached to a HCM 286
Color Scanner and applied to a correlation study between the
classification and ranking of images by observers and that
of an objective measure of the images.
One experiment was devoted to psycho-physical testing
in which several black and white photographs were subjectively
classified and ranked into high, normal, and low key image
types. Installation of the scanning device revealed compli
cations that made it necessary to go ahead and obtain the
computer to derive the images' tone distribution curves
(TDCs). The TDC is a statistical representation of the
images' tone information; nota test object.
Because of the tediousness of manual density
measure-ment brought about by the inavailability of the scanning
device, only eight images were measured objectively. Based
on the complexity of their TDC shapes, the existence of a
real relationship between subjective and objective scene •
classification cannot be inferred presently. It is believed
that this relationship can be found when a larger sample size
of objective data is available. However, it is only reasonable
to consider a larger sample size when a less tedious method
becomes available, such as the scanning device. Discussions
and recommendations are also given for further investigation
between sequential viewing (one image at a time) and
simul-taneous viewing (all images at one time).
Abstract approved: Milton Pearson Thesis Advisor
---
, Title and Departmentwithout the recognition of those who contributed valuable
time and ideas. Sincere -thanks to Milt Pearson for his
suggestions and advice. My appreciation is aiso extended to Dr. Julius Silver and Dr. Mark Guldin for serving on my
thesis committee. A very special thanks to Mary, Dave, Randy, JTF, TC, and Harvey for all their encouragement.
Page CHAPTER I
-INTRODUCTION 1
General Problem 3
The Zone System 5
Statement of Problem Proper 5
Statistical Sampling 6
Tone Distribution Curve 7
Purpose 9
Assumptions 9
Research Questions 10
Hypothesis 10
Footnotes for Chapter One. 11
CHAPTER II
-LITERATURE REVIEW 13
Lightness Values 13
Preferred Tone Reproduction 15
Scene Classification 16
Statistical Sampling Approach 19
TDC Technique 23
Literature Review Summarization 24
Footnotes for Chapter Two 26
Selection of Images 28
Selection of Observers 28
Subjective Sealing System 29
Viewing Conditions 30
Averaging of Subjective Scores 30
Footnotes for Chapter Three 32
CHAPTER IV
-OBJECTIVE METHODOLOGY 33
Installation of Scanning Device 33
Acquisition of Data via Densitometer 34
Construction of Film Overlay 34
Calibration and Sampling 35
Selection of Images to be Measured
Objectively 35
Calculation of TDCs 36
Footnotes for Chapter Four 39
CHAPTER V
-RESULTS 40
Subjective Scene Classification and Rank
Order of Prints 40
Correlation Between Experienced and
Naive Judges 40
Graphical Presentation of TDCs from
Eight Images Sampled by the Densitometer 42
Correlation Between Subjective Scaling
and Objective Measurements 45
Footnotes for Chapter Five 47 CHAPTER VI
-DISCUSSION 48
Observations During Subjective Testing 48
Biased Distribution of Prints 48
Simultaneous Viewing vs. Sequential
Viewing 50
Recommendations 52
BIBLIOGRAPHY 53
APPENDIX A 57
The Jones Diagram 58
APPENDIX B 60
The Zone System 61
APPENDIX C 63
Instruction for Subjective Classification
and Rank Order of Scene Category 64
APPENDIX D 66
PMT Reproductions of Obvious Low, Normal,
and High Key Samples 66
APPENDIX E 70
Computer Listing of Subjective Raw Data
and Statistics 71
APPENDIX F. . 73
Computer Listing for Arranging Density
Measurements into Equal Munsell
Computer Functions for Calculation
of TDCs 78
APPENDIX H 79
Computed Data Analysis for Plotting of
Eight TDCs 80
APPENDIX I
*
83
Computer Output for Correlation
Coefficient of Experienced vs.
Naive Observers 84
Footnotes for Appendices 85
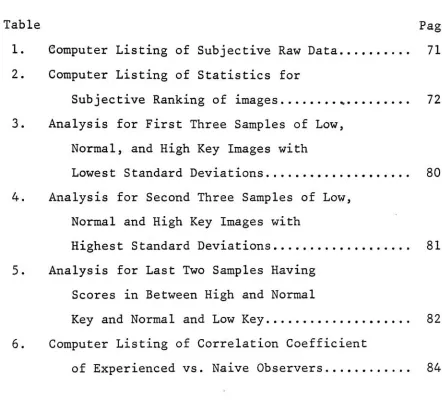
Table Page
1. Computer Listing of Subjective Raw Data 71 2. Computer Listing of Statistics for
Subjective Ranking of images * 72
3. Analysis for First Three Samples of Low,
Normal, and High Key Images with
Lowest Standard Deviations 80
4. Analysis for Second Three Samples of Low,
Normal and High Key Images with
Highest Standard Deviations 81
5. Analysis for Last Two Samples Having
Scores in Between High and Normal
Key and Normal and Low Key 82
6. Computer Listing of Correlation Coefficient
of Experienced vs. Naive Observers 84
[image:11.547.72.514.142.561.2]1. Chung's Transformation of Density
to (a) Munsell Value, (b) USSR Lightness
Value, and (c) Bartleson and
Breneman*' s
Lightness Value 14
2. Tone Reproduction Curves of Best Picture
Quality and the Most Accurate Reproduction
Derived by Yule.
2 16
3. Average Density Distribution Curve of Twelve
Images Tested by Archer1'
17
4. Preferred Tone Reproduction Curves for High,
Normal,, and Low Key Images as Determined
by Jorgensen** 19
5. Diagram of USSR Scanning Analyzer20 21
6. USSR Technique for Graphically Deriving
the Optimum Tone Reproduction Curve20
22
7. Arbitrary Nine Value Scaling System for
Subjective Scene Classification and
Ranking of Images 29
8. Diagram of Macbeth Viewing Booth 30
9. Graphical Illustration of Subjective Class
ification and Ranking of Prints 41
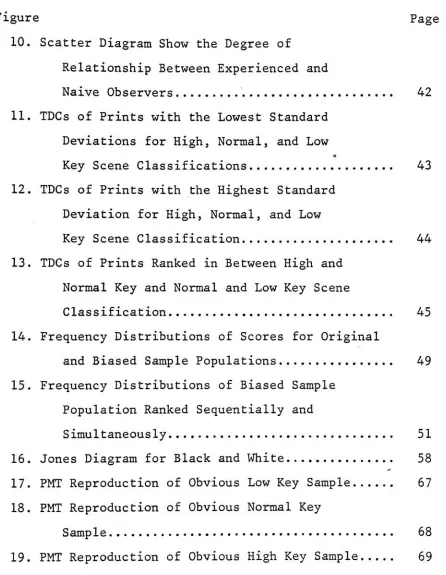
[image:12.547.74.504.163.688.2]Figure Page 10. Scatter Diagram Show the Degree of
Relationship Between Experienced and
Naive Observers 42
11. TDCs of Prints with the Lowest Standard Deviations for High, Normal, and Low
*
Key Scene Classifications 43
12. TDCs of Prints with the Highest Standard Deviation for High, Normal, and Low
Key Scene Classification 44
13. TDCs of Prints Ranked in Between High and Normal Key and Normal and Low Key Scene
Classification 45
14. Frequency Distributions of Scores for Original
and Biased Sample Populations 49
15. Frequency Distributions of Biased Sample Population Ranked Sequentially and
Simultaneously 51
16. Jones Diagram for Black and White 58
17. PMT Reproduction of Obvious Low Key Sample 67 18. PMT Reproduction of Obvious Normal Key
Sample 68
19. PMT Reproduction of Obvious High Key Sample 69
[image:13.547.81.527.90.665.2]study is to produce an identical rendition of an original scene. Albeit, it is
virtually impossible to make an exact photographic facsimile of an original scene. One must realize
that there are limitations in photographic materials and
processing that restrict the photographic reproduction capa
bilities. .These limitations dictate departures from the
exact objective tone reproduction of an original scene. Fortunately, the human visual system does not require the
photographic reproduction to have the exact luminances
(measurable intensities of light stimuli) as those depicted
in the original scene.
In most practical instances, it is the photographer
who must concern himself with the reproduction of an original scene. In doing so, he produces a photographic image of the original scene. Afterward, the printer is requested to
reproduce that original image. But here again, like the
photographer, the printer is restricted by his materials and processing. In the past it has been assumed one would
like the density at every point of the reproduction equal to
duction. Thus, the tone scale of the original must be
compressed within the tone limitations of the printing pro
cess.2
An objective tone reproduction study provides the
printer with a means by which he can maximize his reproduction
quality in spite of all the inherent limitations in materials
and processing. Nonetheless, such a study is only relevant
when the printing characteristics remain stable. Once these
have been established, the reproduction quality can be con
trolled by standardization of each manufacturing phase for
the entire printing process.
Tone reproduction study techniques have been avail
able to the graphic arts for many years. Until recently,
all halftone reproduction study techniques have been forced
to include a tone reproduction test object, such as a gray
scale, to be reproduced along with the original. Rather
than trying to measure individual tone elements of the image
itself, one measures the test object. Density measurements
from the test object are used to derive the objective or
preferred tone reproduction characteristics. These will
become the halftone screening requirements needed to achieve
the desired tone reproduction characteristics. The objective
tone reproduction characteristics are expressed in terms of
a curve whereby the density of the reproduction is plotted
displays several relationships involved in the reproduction
of the original; the ink, plate, press, and paper combination.
To derive the objective tone reproduction curve, the printing
and halftone characteristics are graphically analyzed. Again,
this information is generally obtained from some sort of
test object. An example of the Jones diagram technique for
black and white is explained in Appendix A.
General Problem
There has been a need for more precise optimum tone
reproduction study techniques. The Jones diagram technique
is rarely used for this evaluation. It seems that regular
production takes precedence over time-consuming analyses. When it is used, the objective tone reproduction curve is
derived for a specific type of original which is to be
tested. More times than not, this one curve will be applied
to all subsequent originals in the future, even though they may vary dramatically when compared to the tested original. While developing STORC, a simpler technique for optimizing
tone reproduction, Archer and Elyjiw-3 found that preferred
tone reproduction is tremendously influenced by the quality
of the original. The majority of copy can be classified into
is judged by its image contrast rendition and how it relates
to the luminances of an original scene. The image contrast
rendition is controlled by the sensitometric characteristics of the reproduction process.6 Such factors as exposure and development will effect the subjective evaluation of an orig
inal. Graininess, sharpness, and resolution are other factors
considered in quality evaluations.7 Although STORC has elim inated time-consuming graphical analyses, it still requires
the use of a test object.
In addition to the quality of an original, preferred
halftone reproduction is also dependent on scene classifi
cation. That is, how the tones of the original are rendered. It is up to the discretion of the photographer and/or customer
as to what part of the tone scale will contain the main
interest area. The main interest area is that part of the image which is intended to attract the observer's attention.
If the majority of the picture area contains light tones, it is referred to as a high key image. Should the majority
of the picture area be confined to dark tones, it is referred to as a low key image. When the entire tone scale is used
for the main interest area, it is referred to as a normal
key image. This terminology implies the predominant tones
of the main interest area. Even so, some parts of the main
as the zone system. The zones are divided into nine categories
related to tone gradation. The zone system analyzes the scene
classification of tone reproduction by means of nine subjective
descriptions and examples rather than density. It is inter
esting to note that a low key image must have a highlight in addition to its dark tones. On the otherhand, a high key image does not require a black; only light tones.^ The zone
system is described in more detail in Appendix B.
Statement of Problem Proper
Like Archer and Elyjiw,-* others have found that preferred
halftone reproduction is dependent on the contrast rendition
of the original. Specifically, Jorgensen" has demonstrated
the preferred tone reproduction curve of classified high
key originals to be significantly different from that of images classified as normal and low key. In both studies,
scene classification was purely subjective.
Consequently, a problem still persists in photomechanical
reproduction. That problem is how to objectively classify
originals. If the tone information of the originals could
be expressed quantatively, it would provide an objective
means of scene classification. Such a method may also
test objects since one would be dealing with measurements
directly obtained from the image itself.
Past experience has shown that test objects are not
truly representative of many original images.1" Numerous
discrepancies between test objects and originals are attri
buted to differences in their respective tone configura
tions. Processing variations resulting in adjacency effects,
such as bromide drag and valing, may also lead to discrep
ancies. * Another possible cause, often ignored, is that of
metamerism.**
Statistical Sampling
A new approach to the study of optimum tone reproduc
tion has been developed by Ovchinnikov1^
and others of the
USSR. They have introduced a system for programming the
preferred tone reproduction curve of a wide variety of images
which have different tone information. It is based on
objective data that is obtained by optically scanning and
statistically analyzing the informational part of the image.
The informational part is considered to be the non uniform
lightness areas which contain tone gradation. The non in
formational part is composed of the uniform lightness areas
which have no tone gradation.
The instrument can measure the entire image or solely
its informational part. Basically, it accomplishes this
The informational part of a high key image is presumed to
be similar to that of a low key image since their respective
light and dark tones have no tone gradation. Hence, these
non informational parts are neither recorded nor sampled.13
In effect, the informational part of an image is not
con-tingent upon scene classification.
The.Russians determined that a statistical lightness
curve of the informational part of an image should resemble
a Gaussian, bell-shaped curve. The tone reproduction curve
is the transfer function necessary to transform the relative
frequency histogram of lightness of the original image to
the desired Gaussian curve. This concept makes it possible
to produce optimum tone reproductions from poor tone quality
originals. The optimum tone reproduction curve is derived by
converting the lightness distribution from the informational
part of the original through the tone reproduction curve to
the Gaussian function. This process is said to yield a cust
omized optimum tone reproduction. curve for any type of original
image.
Tone Distribution Curve
A later, but similar approach to that of the USSR has
been investigated by Chung. 2 It is similar in that the
However, his methodology and objectives differed in some respects. For example, he had no sophisticated scanner. His instrumentation consisted of a reflection densitometer
interfaced with a computer. Due to this fact, the total image areas, both uniform and non uniform lightnesses, were
included in the sampling.
The tone information of the original was also viewed
differently. Statistical sampling of the tone .information was expressed in terms of a tone distribution curve (TDC)l2 which is the relative accumulative frequency of the image
lightnesses. The curve is derived by first obtaining a frequency histogram of image lightnesses with an in-line
densitometer. The histogram gives the absolute frequency
of densities appearing at various tone values in the image.
A computer program then transforms the absolute frequency
into its relative cumulative frequency. Also, the density
values are converted into corresponding Munsell values. When the relative cumulative frequency of the sampled image
lightnesses are plotted against their corresponding Munsell
value, one has derived the tone distribution curve.
The TDC is a statistical representation of the image's tone information. It can be used to classify originals by scene type and contrast, in addition to determining their optimum tone reproduction curves. The ability to objectively classify images is significant in that it may permit a
Purpose
The purpose of this thesis is to determine if a scanning
device can be attached to GARC's HCM 286 Color Scanner and
applied to a correlation study expanding the work of Chung.12
This study consists of five major experiments. , One experiment
is devoted to psycho-physical testing in which several black
and white photographs are subjectively classified and ranked
to be indicative of high, normal, and low key images. The
next phase concerns the installation and debugging operations
of the scanning device. One subsequent experiment involves
manual density measurements from eight of the pre-tested
images to obtain their objective TDC attributes. The last
experiment entails a statistical comparison of the subjective
classification of the images versus their objective charac
teristics as determined by their TDC.
Assumptions
A random sampling of the entire tonal content of the
images was used. In this case, there is a single true tone
distribution curve for any one given image. More importantly,
it is assumed that this true curve is obtainable by scanning
all the tone values and statistically analyzing them when
Research Questions
The research questions concern two aspects. First
of all, can a scanning device be attached to a modified
color scanner so that it will read all the tone information contained in a given image?
The second and most important research question: is
it possible to subjectively classify an image and then obtain
an objective classification from a statistical analysis of
the lightness of the image?
Hypothesis
The following is expressed as a null hypothesis:
there is no significant correlation between the classification and ranking of images by observers and that of an objective
measure of the images .
No association between the given conditions is to be initially presumed. One will be able to infer the existence
FOOTNOTES FOR CHAPTER ONE
1. Mees, C.E.K. and James, T.H., (editors), The Theory of
the Photographic Process, Macmillan, New York. lybo.
p. 464-4977
2. Yule, John A. C, "The Optimum Tone Rendering in Half tone Reproduction Processes,"
Halftone Printing, Vol. 3, Pergaman Press, New York, I9b4, p. 17-42.
3. Yule, John A. C, Plot Tone Reproduction Curves, Graphic Arts Research Center, Rochester Institute of Technology, Roch., N.Y., Report No. 127, 1968, p. 1-11.
4. Rhodes, Warren L., "Tone and Color Control in Reproduc tion Processes," TAGA Proceedings 1954, p. 52-58.
5. Archer, H. Brent, and Elyjiw, Zenon, "A Test-target for Establishing Screening Conditions,"
TAGA Proceedings
1971, p. 168-169.
"
6. Simonds, J.L. , "Factors Affecting the Quality of Black
and White Reflection Prints,"
Journal of Photographic Science, Vol. 11, 1963, p. ll-'W. !
7. Mees, C.E.K., andJames, T.H., (editors), The Theory
of the Photographic Process, New York, Macmillan, T9"66,
p. b36-b39.
8. Jorgensen, George W. , "Preferred Tone Reproduction for Black and White
Halftones,"
The 13th IARIGAI Conference
Proceedings, Wildhaus, Switzerland, 1975, p. 11-12.
9. Bollman, Terry, Private Communication, 1976.
10. Archer, H. Brent, A Preliminary Study of Photographic
Copy for Photomechanical Reproduction, Graphic Arts Research Center, Roch., N.Y. , Nov. 1953, p. 1-8.
11. Connolly, L. T. , "Inside Automated Lith Film
Processing,"
TAGA Proceedings 1970, p. 152-165.
12. Chung, Robert Y., "A Statistical Method for Image Classifi
cation and Tone Reproduction
Determination,"
Journal of
Applied Photographic Engineering, Vol. 3, No. 2, Spring
13. Ovchinnikov, Yu., and others, "A New Approach to Pro gramming in Photochemical Reproduction,"
The 12th IARIGAI Conference Proceedings, Versailles, France, 19;J, p. 160-163.
*-II. LITERATURE REVIEW
Lightness Values
In order to perform a systematic analysis of tone repro
duction, one must have some means of obtaining information
about the original and its reproduction. One such medium is that of density measurement. However, density measurement does not correspond with the manner in which the human visual
system perceives lightness. A gray scale with equally spaced
density increments tends to have less visual separation in
the dark areas than in the grays. Unlike the eye, density
operates on logarithmic intervals.
Both Rhodes1
and Yule2 have recommended the conversion
of density values into Munsell values because it more readily
approximates the responses of the human visual system. A
gray scale with equally spaced Munsell increments has a more
equal visual separation between steps than that of density
increments.
Bartleson and Brenneman^ have also developed a light
ness scale which corresponds more accurately to the human
visual system. It is based on a power function. It was
derived from the lightness-luminance relationship between
reflection prints or transparencies and the original scene
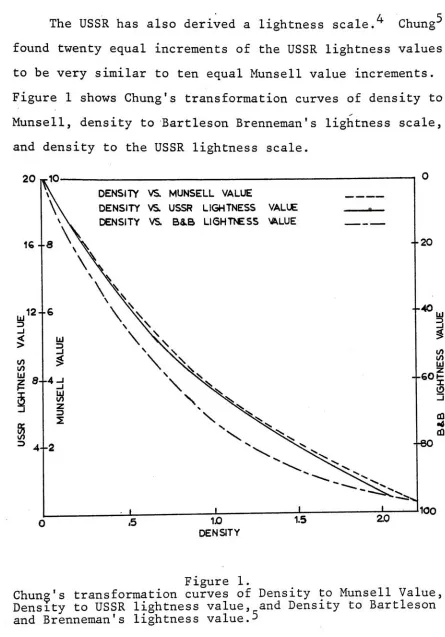
The USSR has also derived a lightness scale.
Chung-5
found twenty equal increments of the USSR lightness values
to be very similar to ten equal Munsell value increments.
Figure 1 shows Chung's transformation curves of density to
Munsell, density to Bartleson Brenneman's lightness scale,
and density to the USSR lightness scale.
0
DENSITY VS MUNSELL VALUE
DENSITY VS USSR LIGHTNESS VALUE
DENSITY VS B&B LI6HTTCSS -ALUE
20
-40
I/)
UJ
--60H I 0
_L_ .5
i
CO 6
CQ
60
UO
DENSITY
1.5 20 100
Figure 1.
Chung's transformation curves of Density to Munsell Value,
[image:27.547.47.492.38.675.2]graphy has been explored for many years. In spite of investi
gations by Bartleson and Brenneman, ^,6-7 clark, Jones and
911 121 -I
Nelson, L" Simonds, and others; the human visual
system is still not fully understood. Yule .
'
has applied various aspects from some of
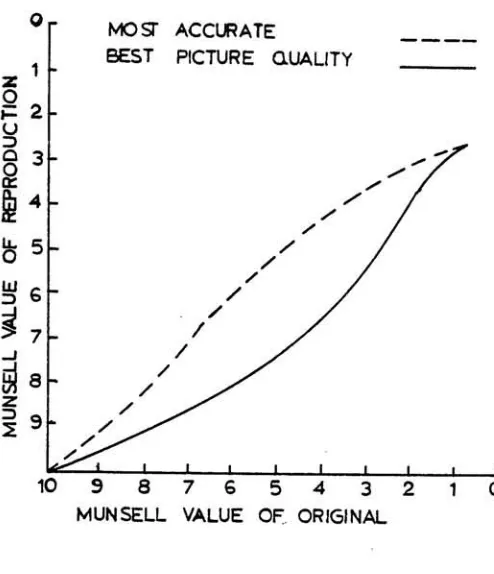
these previous studies to the problem of optimum tone repro duction in the halftone process. Again, the problem involves compressing the density range of the continuous tone original within the tone limitations of a particular printing process. One of his studies revealed that the print most often chosen
for the most accurate reproduction exhibited more highlight
contrast and appeared darker than the print most often chosen 2
for the best picture quality. The most accurate reproduction
was selected to match the original: by comparing it to the
original. Best picture quality was selected on the print's
own merits: without comparison to the original. As a result,
quality judgments are significantly affected by the presence or absence of the original during such evaluations. A gra
MOST ACCURATE
BEST PICTURE QUALITY
98765432
MUNSELL VALUE OF ORIGINAL
Figure 2.
The most accurate reproduction has a tone reproduction curve with a slope near 1 in the highlights. The tone reproduction curve for best picture quality has a slope near 1 in the
midtones.
Scene Classification
Although the literature of the past has compiled a
respectable number of studies relevant to tone reproduction
per se, ' very little has been said for tone repro-17-21 duction in specific regard to scene classification.
Archer was one of the first to recognize the impli
cations of including non representative tone reproduction
test objects during the reproduction of an original. The
tone reproduction curve derived from such test objects will
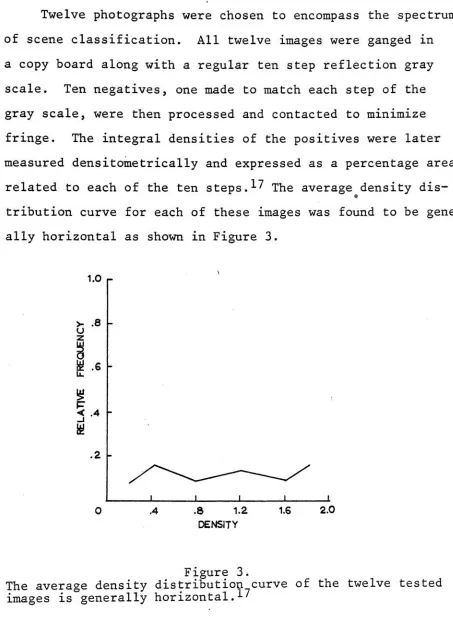
[image:29.547.146.393.53.340.2]a copy board along with a regular ten step reflection gray
scale. Ten negatives, one made to match each step of the
gray scale, were then processed and contacted to minimize
fringe. The integral densities of the positives were later
measured densitometrically and expressed as a percentage area
related to each of the ten steps. ^ The average density dis
tribution curve for each of these images was found to be gener
ally horizontal as shown in Figure 3.
1.0 r
>- .8 O z
!-< .4
_L X
.8 1.2
DENSITY
1.6 2.0
Figure 3.
The average density distribution curve of the twelve tested
images is generally horizontal.1'
A, later study by Archer and Elyjiw1-5 pointed out that
[image:30.547.61.514.51.672.2]rendition. They developed a technique for optimizing black
and white halftone reproduction that determines the effects
of various screening conditions on four different test prints.
It is based on the assumption that the majority of copy can be
combined into four classifications of quality which visually
appear to be contrasty, normal, flat, or very flat.
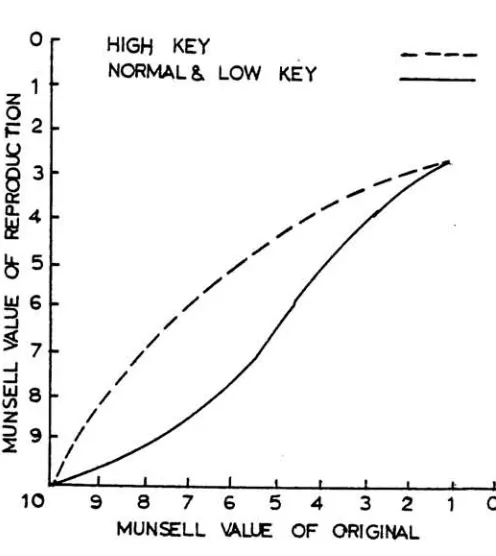
Jorgensen1"
also found preferred black and white half
tone reproduction to be influenced by the image
rendition. He substantiated Yule's findings2
by repeating,
with one exception, the same basic subjective ranking pro
cedures. But, due to the fact that a reproduction is ordinarily
viewed without comparison to its original, he chose picture
quality as the basis of his work. Although he did not actually
test a low key image, he speculated it to have the same basic
preferred tone reproduction curve as a normal key image. He
determined the preferred tone reproduction curve of a high
key image to be significantly different from that of a normal
and low key image. He proposed the use of more than one optimum
tone reproduction curve because he considered the main interest
area of an image to be dependent on its scene classification.
Therefore, the main interest area should have the least amount
of tone compression. Figure 4 summarizes the results of his
z1
I4
b5
$7
CA
z
2 *
10 987654 321
MUNSELL VALUE OF ORIGINAL
Figure 4.
The preferred tone reproduction curve of a high key image is shown to be quite different from that of a normal and low key image.1-'
Statistical Sampling Approach
20
Ovchinnikov "
and others of the USSR have developed a
new approach to the study of optimum tone reproduction.
Their technique allows one to program the preferred tone
reproduction curve of a wide variety of originals which have
different tone information. It uses objective data that is
obtained by optically scanning and statistically analyzing
the informational part of the image.
Their scanning device can measure the entire image or
[image:32.547.145.393.61.339.2]simultaneously measuring two image points and comparing their difference to a pre-determined lightness value. Only those
tones that exceed a threshold level are considered informa tional and are recorded and statistically sampled. The infor
mational part of a high key image is presumed to resemble that
of a low key image because their respective light and dark tones have no tone gradation. These non informational parts
are neither recorded nor sampled.20
Consequently, the infor mational part of an image is not contingent
upon* its scene
classification.
A very basic diagram of the scanning procedure is given in Figure 5. An original is placed on the rotating drum of
an optical scanner. The device takes the light signals from the scanned areas of the image and converts them into elec trical signals via the photoelectric detector. The electrical
signals are then changed into- signals that are proportional
to optical density. The optical density signals are subse
quently transformed into other proportional lightnesses.
These conversions are performed by two nonlinear amplifiers.
The scanner simultaneously measures an image point and deter
mines whether or not there is a difference to a predetermined
lightness value.
Elimination of the non informational part of an image is determined by a computer interface which monitors the
scanning procedure. The computer samples only those signals
that have tone variation; the informational part of the
image. The tone variations are compressed into twenty light
level occurs. This information is put on perforated tape and
fed into the computer. The computer translates the information
into a relative frequency histogram of lightness which repre
sents the tone gradation of a given image.20
> .
Photoetectric
Detector Non-Linear
Amplifier into Optical Density Image Scanning Device Non-Linear Amplifier into Lightness Functions Statistical JSampling "Block Firvt Derivative Block Pulse Amplitude Analyasr Register Counters Computer Interface Figure 5.
Basic diagram of USSR Scanning Analyzer.2^
The Russians determined that a statistical lightness dis
tribution curve of the informational part of an image will
resemble a Gaussian, bell-shaped curve. The tone reproduc
tion curve
is*
the transfer function necessary to transform the
frequency histogram of lightness of the original image to
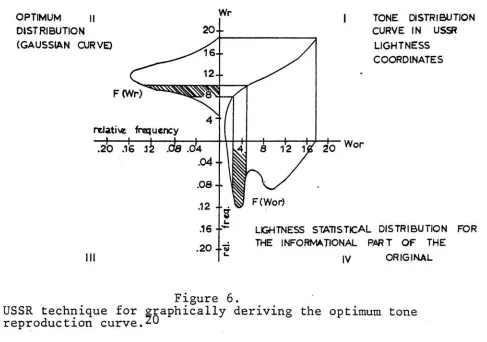
[image:34.547.30.533.214.683.2]curve is derived by the function necessary to change the
informational part of the image to the Gaussian function as
indicated in the graphical method shown in Figure 6.
OPTIMUM 11
DISTRIBUTION
(GAUSSIAN CURVE)
TONE DISTRIBUTION
CURVE IN USSR
LIGHTNESS
COORDINATES
Wor
LIGHTNESS STATISTICAL DISTRIBUTION FOR
THE INFORMATIONAL PART OF THE
IV ORIGINAL
Figure 6.
USSR technique for graphically deriving the optimum tone
reproduction curve.2^
Quadrant IV of Figure 6 illustrates the lightness statis
tical distribution for the informational part of the original
image F(Wor). It is obtained by plotting the frequency against
the USSR lightness values of the original as designated by
Wor in quadrant IV.
[image:35.547.56.543.174.516.2]in quadrant I.
Quadrant I contains the desired tone reproduction curve
in USSR lightness values. It is derived by plotting the
lightness of the reproduction (Wr) against the lightness of
the original (Wor) via the intermediary Gaussian distribution.
This method is said to yield a customized optimum tone
repro-duction curve for any type of original image.
TDC Technique
A similar approach to that of the USSR has been recently
21
explored by Chung. It is similar in that the lightness
information of the image itself was statistically analyzed.
But, due to the lack of a sophisticated scanner, his method
ology and objectives differed. His instrumentation consisted
of a reflection densitometer interfaced with a computer. As
a result, the total image areas, both uniform and non uniform
lightnesses, were included in the sampling.
Chung also viewed the tone information of the original
differently. He expressed the statistical sampling of the
21
tone information in terms of a tone distribution curve.
The TDC is the relative accumulative frequency of the light
nesses of the image. Such a curve is derived by initially
using an in-line densitometer to obtain a frequency histogram
occuring at various tone values in the original are accounted
for in the frequency histogram. The absolute frequency was
then transformed into its cumulative relative frequency by a
computer program. The computer also converted the density
values into Munsell values. One finally derives the tone
distribution curve (TDC) by plotting the relative cumulative
frequency against the Munsell values of the image.
The tone distribution curve is a statistical^ represen
tation of the image's tone information. The intended use of
the TDC approach is to objectively differentiate between
high, normal, and low key image types. It can be used to
classify, as well as determining their optimum tone repro
duction curves.
Literature Review Summarization
The pertinent literature of the past has accumulated
a vast amount of knowledge related to tone reproduction per
se. The investigations encompass all sorts of approaches to
the ensuing problems encountered in continuous tone photo
graphy and/or the halftone reproduction process. Albeit, very
little has been published concerning tone reproduction with
specific regard to scene classification.
As mentioned earlier, the intention of the TDC approach
is to objectively distinguish between high, normal, and low
key image types. The ability to classify images objectively
particular scene classification. Further exploration of this
objective technique may help solve the nebulous inconsistencies
FOOTNOTES FOR CHAPTER TWO
1. Rhodes, Warren L., "Tone and Color Control in Reproduc tion Processes," TAGA Proceedings 1954, p. 58.
2. Yule, John A.C., "The Optimum Tone Rendering in Half
tone Reproduction Processes," Halftone Printing, Vol.
3, Pergaman Press, New York, 1964, p. 17-42.
* 3. Bartleson, C.J., and Breneman, E.J., "Brightness
Reproduction in the Photographic Process,"
Photographic
Science and Engineering, Vol. 11, No. 4, July, 1967,
p. 254-262.
4. Ovchinnikov, Yu, and others, "A New Approach to Programming in Photomechanical Reproduction,"
The 12th
IARIGAI Conference Proceedings, Versailles, France,
1973, p. 160-163.
5. Chung, Robert Y., Quantification of Image Tonal Charac teristics and Its Application in Tone Reproduction Deter mination, published thesis, Rochester Institute of
Technology, Roch., N.Y., 1976, p. 18-19.
6. Bartleson, C.J., "Criterion for Tone Reproduction,"
Journal of the Optical Society of America, Vol. 58,
No. 7, July, 196, pT 992-993.
7. Bartleson, C.J., "Visual Comparison of Photographic Transparencies and Photomechanical Reflection
Prints,"
Photographic Science and Engineering, Vol. 12, No. 1,
Jan.-Feb., 1968, p. 36-40.
8. Clark, J.D., "Mathematical Prediction of Photographic
Picture Quality from Tone Reproduction Data," Photo
graphic Science and Engineering, Vol. 11, No. 5,
Sept.-Oct!., 1967, p. 306-31b?
9. Jones, L.A., "On the Theory of Tone Reproduction with
a Graphic Method for the Solution of
Problems,"
J. Soc.
Mot. Pict. Telev. Engrs., Vol. 16, 1931, p. 568-599.
12. Simonds, J.L. , "A Quantitative Study of the Influence
of Tone Reproduction Factors on Picture Quality," Photographic Science and Engineering. Vol. 5, No. 5, Sept.-Oct., 1961, P- 270-277.
*
13. Simonds, J.L., "Factors Affecting the
Quality of Black and White Reflection Prints,"
Journal of Photo
graphic Science, Vol. 11, No. 1, 1963, p. 27-30.
14. Mees, C.E.K., and James, T.H. (editors), The Theory
of the Photographic Process, Macmillan, New York,
1966, p. 464-497.
15. Yule, John A.C, Plot Tone Reproduction Curves, Graphic
Arts Research Center, Rochester Institute of Technology,
Roch., N.Y., Report No. 127, 1968, p. 1-11.
16. Yule, John A.C, Principles of Color Reproduction, John
Wiley and Sons, New York, 1967.
17. Archer, H. Brent, A Preliminary Study of Photographic
Copy for Photomechanical Reproduction, Graphic Arts
Research Center, Rochester Institute of Technology, Roch., N.Y., Nov. 1953, p. 1-8.
18. Archer, H. Brent, and Elyjiw, Zenon, "A Test-target
for Establishing Screening Conditions,"
TAGA Proceedings
1971, p. 158-171.
"
19. Jorgensen, George W. , "Preferred Tone Reproduction for
Black and White
Halftones,"
The 13th IARIGAI Conference
Proceedings, Wildhaus, Switzerland, 1975, p. 1-40.
20. Ovchinnikov, Yu. and others, "A New Approach to
Programming in Photomechanical Reproduction," The 12th IARIGAI Conference Proceedings, Versailles, France,
1973, p. 160-163.
21. Chung, Robert Y., "A Statistical Method for Image
Classification and Tone Reproduction
Determination,"
Journal of Applied Photographic Engineering, Vol. 3,
III. SUBJECTIVE METHODOLOGY
Selection of Images
Thirty-one black and white photographs were selected
from a series of prints. These images were selected to
represent a sampling of the entire gamut of high, normal, and low key images. They were also chosen to approximate the
range of quality that a printer might presumably encounter in a real world industrial situation. Some of the photographs
depicted obvious scene classifications of high, normal, and low key. Classification of the remaining images was not so
obvious. Dimensions of the images varied from 5 x 10 inches to 8 x 10 inches. They were printed on a variety of paper
grades and surface textures.
Selection of Observers
Twenty-two people were asked to rank the photographs on
a scale of one to nine according to low, normal, and high key. The population consisted of ten experienced and twelve
naive observers. The experienced participants encompassed
reproduction photography technicians from Graphic Arts Research
Center, reproduction photography instructors, and senior stu
dents from the Schools of Photography and Printing. The naive
Subjective Sealing System
The first experiment concerned the subjective scaling
of images. Before the psycho-physical test, each print was
identified by a number on the back. All thirty-one prints
were presented to the observers in one random order that was
shuffled just before each observer began. Each viewer se
quentially classified and ranked the prints according to an
arbitrary scale of nine values as given in Figure 7. Values
one through three represent images thought to be low key.
Images considered to be normal key were to be scored within
scale values four through six. Values seven through nine
represent high key images. The observers were shown an obvious
example of low, normal, and high key images as an attempt to
calibrate the scale and to minimize confusion. The obvious
examples (Appendix D) were provided to correspond closely
with the respective scale values of one, five, and nine.
LOW NORMAL HIGH
KEY KEY KEY
1 i i i I . . I
123456789
Figure 7.
Arbitrary nine value scaling system for the subjective scene
[image:42.547.82.475.561.624.2]Viewing Conditions
The viewing conditions were measured with a foot-candle
meter to assure a light intensity range of 30 to 100 foot candles
as recommended in similar studies.1
This phase of the psycho
physical testing was conducted in a modified Macbeth viewing
booth under an average light intensity of 60 foot-candles;
when measured on a 45 wooden viewing stand (Figure 8) . In
structions for the psycho-physical testing are provided in
Appendix C
trzz-z."z-r--z.z.~---zj ,
' LIGHTS !
Z~----~--_---_-rzr--z ::=> LOW KEY IMAGE SAMPLE NORMAL KEY IMAGE SAMPLE HIGH KEY IMAGE SAMPLE
/
/
/
v- -TW-^
1 lZ *
f 7/ \ A
INSTRUCTIONS 45
VIEWING STAND
Figure 8.
Diagram of Macbeth viewing booth used for the subjective ranking of images.
Averaging of Subjective Scores
The responses to the subjective evaluations were based
[image:43.547.46.434.304.529.2]listing of the subjective raw data and statistics can be found in Appendix E. Discussions concerning the results of the
subjective raw data appear in Chapter V
FOOTNOTES FOR CHAPTER THREE
IV. OBJECTIVE METHODOLOGY
Installation of Scanning Device
Electronics added to the optical scanning device were
to derive the objective data for the calculation of the images'
tone distribution curves. These electronics wei*e installed on
a HCM 286 Color Scanner for this purpose.
First testing of this electronic modification indicated
that it was responding in the reflection mode rather than
density as originally desired. In addition to this, the
response was limited to an input signal range of only zero to
1.0 in density. A range of zero to at least 2.0 would be
necessary to accommodate the density range of an average black and white photograph.
It was judged that the time factor necessary to correct
these objections would be too great to be compatible with
the time limits of this thesis. While these corrections are
being made, it was judged necessary to go ahead and obtain
the data by using much of the same methodology outlined by
Chung. However, because this was a manual and very
time-consuming process, the objective measurements had to be limited
Acquisition of Data via Densitometer
"Generating a TDC from an image can be quite laborious
in the absence of a specialized scanning and computing device
because a fairly large number of measurements and a large
amount of data manipulation are required."2
A Macbeth RD-514 densitometer was used to obtain the
data for calculation of the images' TDCs. The densitometer
was interfaced with a PDP-8 computer in the School of Printing.
The computer was programmed to arrange the input density
measurements into density cell intervals. The density cell
sizes were adjusted to equal Munsell increments.3 Munsell
increments were chosen because they more readily approximate
the perception of the human visual
system.^-The program for
this is given in Appendix F.
Construction of Film Overlay
The next step was to devise an overlay to conveniently
sample the images. It was constructed from an exposed sheet
of 11 x 14 inch pan masking film with an average overall
density of about 0.30. The film overlay had been punched with
a row and column array of holes equal to the diameter of the
hold-down aperture of the densitometer. These constituted a
sampling of 285 data points.
In testing the densitometer with the overlay, it measured
the same spot .01 to .02 higher through the overlay than with
Calibration and Sampling
The densitometer was calibrated with the manufacturer's
two-point calibration plaque through the same overlay used
to sample the images. Calibration of the densitometer preceeded
the sampling of each image. The film overlay was positioned
over the image and marked in such a way that it could be shifted
half the punch interval; horizontally and vertically.
This procedure permitted sampling of different size images
whereby all data points were independent (no overlap of measure
ments) . A total of 285 sampling areas were objectively measured
for each image.
Selection of Images to be Measured Objectively
Due to the lack of time and tediousness of this technique,
only eight images were measured objectively. They were
selected on the basis of their subjective scaling averages
and standard deviations. (Figure 9). The first three images
to be sampled were those with the lowest standard deviations
and averages approximately centered in each of the three
categories of low, normal, and high key classification. Stat
istically, all observers generally agreed these were the most
representative samples of low, normal, and high key images
by the fact that they had the highest standard deviations
for their respective scaling averages (Figure 9). These were
the samples that seemed to present the greatest amount of
variation among the observers (Figure 12). The last two
images were chosen because their subjective mean scores
were in between those of the most representative and the most
questionable samples of low key and high key (Figures 9
and 14).
Calculation of TDCs
The tone distribution curve is a statistical represen
tation of the images* tonal information. It results in a
curve expressing the relative accumulative frequency of the
lightnesses of the image. Eight such TDCs were derived
through the following procedure.
Sampled input density measurements were initially sorted
into equal Munsell value intervals by the PDP-8 computer in
the School of Printing. All of this data was subsequently
punched onto paper tapes . The tapes were then fed into a
teletype interfaced with the Xerox Sigma IX computer at
Rochester Institute of Technology. The Sigma IX was pro
grammed in APL language. APL is a high level programming
language especially well suited to the calculations on arrays
These same functions also computed the relative cumulative
frequency of tones occuring at each Munsell interval.
^=1
ref =
2- f,
n
f^
-absolute frequency; number of measurements for
each Munsell interval.
f =
cumulative frequency; number of measurements for
i=1
all Munsell intervals (20).
n =
sample size; total number of sampling measurements.
=
number of Munsell interval.
The absolute frequency was used to calculate the cumula
tive frequency. Dividing the cumulative frequency by the
sample size produced the relative cumulative frequency of
the sampled lightnesses. The relative cumulative frequency
was chosen as the response parameter because it yielded a
curve similar to a regular tone reproduction curve when it
was plotted against corresponding Munsell intervals. It
the percentage of tones for any value is automatically known
by its relative cumulative frequency. Appendix H contains
the APL computed data analysis used to plot the TDCs sampled
by the densitometer. The plotted TDCs can be found in Figures
FOOTNOTES FOR CHAPTER FOUR
1. Chung, Robert Y., "A Statistical Method for Image Classi fication and Tone Reproduction Determination,"
Journal of Applied Photographic Engineering, Vol. 3, No. 2, Spring
19//, p. 74-81.
2. Ibid., p. 75
#
3. Yule, John A.C, Principles of Color Reproduction, John
Wiley and Sons, New York, 1967, p. 334.
4. Yule, John A.C, Plot Tone Reproduction Curves, Graphic
Arts Research Center, Rochester Institute of Technology,
Rochester, New York, Report No. 127, 1968, p. 1-11.
5. Katzan, Harry Jr., APL Programming and Computer Techniques,
V. RESULTS
Subjective Scene Classification
The subjective classification and rank order of prints
are illustrated in Figure 9. The print numbers are arranged
according to their mean subjective scaling score (Appendix
E). The scores were plotted and the corresponding standard
deviation was indicated for each data point by the magnitude
of the vertical line passing through each data point. Sub
jective classification of the prints in their ranked order
did show a fairly smooth progression from low to high key.
Correlation Between Experienced and Naive Judges
In order to determine the relationship between exper
ienced and naive observers, a scatter diagram (Figure 10)
was plotted. It shows the degree of relationship between the
sample mean scores of the experienced judges plotted against
those of the naive. Since most of the data points nearly
form a 45 line; one can assume there is a good relationship
between naive and experienced observers. A linear regression
computed by Sigma IX (Appendix I) derived the correlation
coefficient r to be 0.98. The r value1 is
a measure of the
degree to which scores of the experienced observers are asso
j_ X
CM
-CD $
00 CD co CM ao CMtO "z CM= a: cmQ-PS 2 2* o <*\ CM aq o <n R F-i 'A N NZ aoQ fO|-in> " Ui tn a IT)CE si $-ao </) J2 ao CM CM N in Ti 8 CM 5 CM 8 CO c H a. o u CU l-l o c H c cd c o cd o H M-l H a\ co CO cu cd 3 a 60 h a) Uj > r-i 4-1 o 0) d CO <4-l o c o H 4-J cd u 4-1 CO 3 r-. 01 r-l
Q edo
in H o X! r* a r- cd u> 5-1 o
<n co co in <t n 3fllVA 31V0S X
2 3 4 5 6 7 S
X EXPERIENCED OBSERVERS
Figure 10.
Scatter diagram showing the degree of relationship between
experienced and naive observers.
Graphical Presentation of TDCs from Eight
Images Sampled by the Densitometer
The first three images to be examined were those with
the lowest standard deviation in each of the three categories
of low, normal, and high key. Their tone distribution curves,
Figure 11, conform very closely with Chung's2 suggested curve
[image:55.547.89.431.82.479.2]8 7 6 5 4
MUNSELL VALUE
3 2 1
Figure 11.
Tone Distribution Curves of prints with lowest standard devia
tions for high key (print 11) , normal key (print 26) , and low key (print 31) .
The tone distribution curves of the next three images
were plotted because they had the highest standard deviation
in each of the three categories. Figure 12 shows their TDC
shapes were quite different from those with the lowest stand
[image:56.547.117.426.79.428.2]e 5 4
MUNSELL VALUE
Figure 12.
Tone Distribution Curves of prints with highest standard
deviation for high key (print 12), normal key (print 14), and low key (print 30) .
The last two TDCs were plotted from prints ranked inter
mediately between high and normal and normal and low key.
From the illustration in Figure 13, one can see these tone
[image:57.547.97.446.77.459.2]UJ ZJ O UJ ac UL < -J z> U Ul ae. .9 .8 .7 .6 .5 .4 .3 .2 .1 //
//
i 27/ / / / / - / - / /21 / / / / _L /fa"^l J L
tO 9 8 7 6 5 4
MUNSELL VALUE
J L
Figure 13.
Tone Distribution Curves of prints ranked between high and normal key (print 27) and normal and low key (print 21) .
Correlation Between Subjective
Sealing and Objective Measurements
From the complexity of the eight curve shapes, it was
judged that not enough information was available to draw a
conclusion to the proposed hypothesis in Chapter I. It is
postulated that it would be necessary to calculate the tone
[image:58.547.102.483.76.458.2]correlation. The reason this was not done was: lack of time
due to the tediousness of manual measurement brought about by
the inavailability of the scanning instrument. On the basis
of the information gathered thus far, the null hypothesis can
not be accepted. Although the existence of a real relationship
between subjective and objective scene classification cannot
be inferred presently; it is believed that a real relationship
does exist and that this relationship can be found when a
FOOTNOTES FOR CHAPTER FIVE
1. Rickmers, Albert D., and Todd, Hollis N., Statistics, An
Introduction, McGraw-Hill Book Company, New York, iyo/,
p. 254.
2. Chung, Robert Yl, "A Statistical Method for Image Classi
fication and Tone Reproduction Determination," Journal of >lied Photographic Engineering, Vol. 3, No.. 2, Spring
p. 74-81.
Applii
VI. DISCUSSION
Observations During Subjective Testing
In regard to time involved in making subjective judge
ments, naive observers were generally able to complete their
evaluations earlier than experienced observers. It is assumed
the experienced people tend to criticize; an expected influence
from their professional or educational experience. It is also
assumed the naive observers look at an image for what it is;
not for technical expertise. Upon completion of their evalua
tions, each person was asked what it was they were looking at
when they determined their judgements for low, normal and high
key images. Many of them mentioned they viewed the images in
terms of a balance of tones and/or a predominance of tones
(white vs. gray vs. black)
Biased Distribution of Prints
During a surface investigation of the subjective ranking
results, a frequency polygon was plotted to show the number of
individual responses for each scale value. At first glance,
the top polygon in Figure 14 suggests a near normal distri
bution of scores. However, closer examination of the frequency
indicated the normal key responses outnumbered the low and high
ORIGINAL SAMFLE POPULATION
3 4 5
SCALE VALUE
Figure 14.
Frequency distributions of scores for original and biased
sample populations. Scale values one, five, and nine respec
tively represent low, normal, and high key scores.
this, exploratory ranking sessions were given to five people
with the same instructions and viewing conditions as the first
subjective test. This time, only three normal key prints were
[image:62.547.73.499.111.591.2]to three normal key images produced a smoother frequency
distribution as shown in the bottom polygon of Figure 14.
Simultaneous vs. Sequential Viewing
To see if there was any difference between sequential
ranking (one at a time) and simultaneous ranking (all at one
time) ; five more people were asked to rank the new biased
sample population. The prints were randomly displayed on a
table under a measured light intensity range of 70 to 85
foot-candles. The judges were asked to first view the images, and
then place each print in a numbered space representing their
subjective scale value. The broken-line in Figure 15 indi
cates a different distribution of scores than the distribution
plotted from the scores of the sequential tests. They are
UJ 24
22
20
18
16
14
12
10
8
6
4
-2
-4- .1. J_ _L
1 2 3 4 5 6
SCALE VALUE SEOUENCIAL VIEWING
SIMULTANEOUS VIEWING
3
Figure 15.
Frequency Distributions of Biased Sample Population Ranked
[image:64.547.78.418.101.548.2]Recommendations
Since the exploratory simultaneous
viewing sessions did
produce a different frequency distribution, further investi
gation between sequential and simultaneous ranking is suggested.
If all the images used in this study were simultaneously ranked
in another investigation of this type; their subjective mean
scores could be correlated with the sequential ranking mean
scores (derived in this study) to find their relationship.
Regarding objective measurements, it is only reasonable
to consider a larger sample size when a less tedious method
becomes available, such as the scanning device. With the aid
of the scanning instrument, and appropriate statistical analysis,
it is believed that a relationship between the subjective ranking
of images and an objective measure of the TDC can be found