A Dissertation on
STUDY OF QRS DURATION AND R/Q RATIO IN THE ASSESSMENT OF SEVERITY OF ACUTE MYOCARDIAL INFARCTION
submitted to
THE TAMILNADU DR. M.G.R. MEDICAL UNIVERSITY
CHENNAI
in fulfillment of the regulations
For the Award of the Degree of
M.D. (GENERAL MEDICINE)
BRANCH - I
KILPAUK MEDICAL COLLEGE
CHENNAI.
CERTIFICATE
This is to certify that “
STUDY OF QRS DURATION AND R/Q RATIO IN
THE ASSESSMENT OF SEVERITY OF ACUTE MYOCARDIAL
INFARCTION
” is bonafide work done by
Dr. SHYAM PADMANABHAN
,
postgraduate student, Department of
Internal Medicine
,
Kilpauk Medical
College
, Chennai-10 under my guidance and supervision in fulfillment of
regulations of The Tamilnadu
Dr. M.G.R. Medical University
for the award of
M.D. Degree Branch I, Part II (General Medicine)
during the academic period
from March 2005 to March 2008.
Dr. M. Dhanapal, M.D.,D. M.
The Dean
Kilpauk Medical College
Chennai 600 010
Prof. G. Rajendran, M.D.
Professor and Head
I thank
Dr. M. Dhanapal, M.D., D. M.,
Dean, Kilpauk Medical College for
permitting to use the resources and clinical material of this hospital.
I thank
Dr. G. Rajendran, M. D.,
Professor and Head of the Department of
Internal Medicine for granting me permission to conduct this study.
I thank
Dr. Narayanaswamy Senguttuvan, M. D., D. M.,
Professor and
Head of the Department of Cardiology for his valuable guidance and
encouragement.
I am grateful to
Dr. Surendran E
.
M.D
.,
Dr. Sundaramoothy. M.D.
,
Dr.
Jayaprakash. M.D.
,
Dr. Manickam. M.D.
, Assistant Professors in the ICCU for
providing immense help for the successful completion of this study.
I am grateful to
Dr. Mayilvahanan.S. M.D.,
Dr. Rohini I. M.D.,
Dr.
Vasanthi.P. M.D.
for their encouragement, guidance and support during the
course of the study.
I thank
Mr. Gopinathan.S.
for his valuable time spent in analyzing the data
and providing statistical support.
I also thank my fellow Post Graduate students and house surgeons for all the
CONTENTS
Chapter No.
Titles Page
No.
1 Introduction
2.
Aim and Objectives
3
Review of Literature
4
Materials and methods
5 Observations
6 Discussion
7 Conclusions
8
Appendix
Bibliography
Proforma
INTRODUCTION
Within a short span of time, Ischaemic Heart Disease (IHD) will be the number
one killer replacing infections, silently, slowly sometimes suddenly occluding the
coronaries of millions of Indians. WHO study group on IHD and atherosclerosis
described ischaemic heart disease as “cardiac disability, arising from reduction or arrest
of blood supply to the myocardium in association with disease process in coronary
arterial system.” During the past 30 years, a large decline in mortality due to coronary
artery disease has been experienced in the West and there is a substantial increase in the
developing countries. IHD accounted for 15.3 million deaths in 1996 which included
45.6% of all deaths in developed countries and 24.5% of all deaths in the developing
countries. Estimated and projected rates of death (per l,00,000) due to this dreaded
disease by World Bank Health Sectoral Priorities Review are 295 and 239 for males and
females respectively in the year 2015.
Coronary artery disease has a multifactorial etiology with many of the risk factors
being influenced by life style. Rapid change in dietary habits coupled with decreased
physical activity in India as a consequence of urbanisation may partly explain the
escalation of coronary artery disease. India is at going through a phase of rapid
urbanization which has led to economic improvement, the consequence of which has
resulted in fast food intake and tobacco consumption and decreased physical activity.
Atherosclerosis, which is the main cause of coronary artery disease is the
the precise cause of atherosclerosis is unclear an emerging paradigm suggests that
atherosclerosis involves multiple pathways in which lipoprotein entry and retention,
injury to vessel wall from diverse stimuli and an associated long term inflammatory and
immune response.
The standard 12 lead ECG has long been a reliable clinical tool for diagnosis of
myocardial infarction. Minutes may be crucial in making the decision for urgent
interventions in order to salvage the severely ischaemic myocardium. Besides history and
physical findings the ECG may be the only clinical tool available readily in deciding to
initiate life saving thrombolysis.
Identification of post infarction patients at risk for cardiac death and sudden
cardiac death may lead to optimization of medical therapy and implantation of
cardioverter-defibrillators. In the current era of technological development in cardiology
there are a number of methods that could be utilised for the risk stratification purposes.
Historically left ventricular ejection fraction was the first widely accepted risk stratifier in
post infarction patients. Subsequently interest in Holter recorded ventricular arrhythmias,
late potentials on signal averaged ECG, heart rate variability, substantiated prognostic
value of these parameters in patients with prior myocardial infarction. New approaches,
inc1uding heart rate turbulence, T wave alternans, QT variability and baroreflex
sensitivity are being successfully tried for risk stratification purposes. Simultaneous1y
invasive electrophysiology testing with induction of ventricular tachycardia or fibrillation
has been utilized for risk stratification purposes. The concrete evidence for dire
usefulness will known after extensive trials. All the above methods are worth exploring
general access to the technology and methodology needed to implement some of these
more sophisticated technique and also there are no standardizations of several of these
methods. A standard 12 lead ECG is widely, easily available and serves as a powerful
tool when considering risk stratification in post infarction patients. So a standard 12 lead
ECG is a cost effective excellent tool for estimating the severity of myocardial infarction
AIMS AND OBJECTIVES
1. To study the “QRS duration” on short term prognosis of acute myocardial
infarction.
2. To study the QRS duration in relation to 10-day hospital mortality.
3. To study R/Q ratio in lead II for the assessment of the severity of acute inferior
wall myocardial infarction.
4. To study the R/Q ratio in lead II in relation to thrombolytic therapy in acute
inferior wall myocardial infarction.
5. To study the comparison of R/Q ratio with QRS duration to assess the severity of
REVIEW OF LITERATURE
At the threshold of the new millennium coronary artery disease is looming large
as the new epidemic, afflicting Indians with severe and diffuse form of lesions. The
prevalence of coronary artery disease increased in India during the latter half of the last
century particularly among the urban population. (1)
The risk of coronary artery disease in Indians is 3 times higher than white
Americans, 6 times higher than Chinese and 20 times higher than Japanese. Indians are
prone as a community to coronary artery disease at a much younger age. (2)
In a metaanalysis Gupta and Gupta (1996) (3) estimated the prevalence of
coronary artery disease among Indians to be 9.6% in the urban and 3.7% in the rural
population. South Indians have a higher prevalence and 14 % in urban areas.
On screening persons over the age of 30 years by a 12 lead ECG in Chandigarh
the prevalence was found to be 65.4 and 47.8 per 1000 males and females respectively. In
a village of Haryana the prevalence was 22.8 and 17.3 per 1000 males and females
respectively .(4)
Although the death rate from acute myocardial infarction has declined by about
30% over the last decade, it is seen as a fatal event at the onset itself is seen in
approximately one third of patients. About 50% of the deaths associated with acute
myocardial infarction occur within 1 hour of the event and are attributed to serious
Almost all myocardial infarction results from coronary atherosclerosis, generally
with superimposed coronary thrombosis, slowly forming high grade stenosis in epicardial
coronaries may progress to complete occlusion, but yet does not usually precipitate acute
myocardial infarction, probably because of the development of a rich collateral network
over time. (6)
PATHOPHYSIOLOGY
On interruption of antegrade flow in an epicardial coronary artery, the zone of
myocardium supplied by that vessel immediately losses its ability to shorten and perform
contractile work (7), Four abnormal contraction patterns develop in sequences
a. Dyssynchrony - Dissociation in the time course of contraction of adjacent
segments.
b. Hypokinesis - Reduction in the extent of shortening.
c. Akinesis - Cessation of shortening.
d. Dyskinesis - Paradoxical expansion and systolic bulging.
Accompanying the dysfunction of the bulging segment, initially there is
hyperkinesis of the remaining normal myocardium. This increased motion subsides
within 2 weeks of infarction, during which time, some recovery can be seen in the infarct
region as well. Patients with acute myocardial infarction also show reduced myocardial
Clinical features: Chest pain and chest discomfort, are the predominant presenting
features of myocardial infarction. Nausea, vomiting and epigastric discomfort,
stimulating an abdominal pathology, occurs more commonly in patients with IWMI than
AWMI. The stimulation of vagus nerve or Bezold-Jarisch reflex is presumed to be the
mechanism involved. In elderly patients and diabetics, acute myocardial infarction can
manifest clinically without chest pain, but with symptoms of acute LVF and chest
tightness, or by marked weakness, or syncope. (9) Patients usually appear anxious and in
considerable distress. Sinus bradycardia is particularly frequent in, patients with inferior
and posterior wall infarction. (10) Hypotension, engorged neck veins, clear lung fields
and heart blocks are characteristic features of right ventricular myocardial infarction,
which occurs in about one-third cases of IWMI. (11)
On cardiac auscultation a fourth heart sound is almost always present in, patients
with acute myocardial infarction in sinus rhythm and this is usually best heard between
the left sternal border and the apex. In cases of RVMI associated with papillary muscle
dysfunction of the tricuspid valve, murmur of TR may be present. (7) In, patients with
IWMI, posterior involvement are associated with development of significant MR (12).
The incidence of cardiogenic shock and severe LVF occurs less frequently in
IWMI, unless otherwise, it is complicated by mechanical defects such as ventricular
Cardiac Enzymes
Estimation of the rise and fall in serum cardiac markers is one of the WHO
criteria for diagnosis of AMI, other being history of ischemia and electrocardiographic
changes. (13).
In myocardial infarction, as myocytes become necrotic, the integrity of the
sarcolemmal membrane is compromised and intracellular macromolecules (serum cardiac
markers) begin to diffuse into the cardiac interstitium and ultimately into the
microvasculature and lymphatics in the region of infarcts. (14) The rate of appearance of
these macromolecules depends on several factors including intracellular location,
molecular weight, local blood supply and lymphatic flow, and the rate of elimination
from the blood. (15).
Among the various serum cardiac markers; cardiac specific troponin (Tn-c, Tn-I),
Creatinine kinase (CPK-MB), Myoglobin and LDH are the commonly measured, with
troponin now considered as the preferred biomarker for diagnosis of acute myocardial
infarction (16). Serum level of cardiac enzymes appears to be the most practical means of
estimating infarct size (17). In addition, cardiac troponin measurements have been shown
to have prognostic value for identifying patients with an acute coronary syndrome at risk
for adverse clinical outcomes and who also exhibit enhanced responsiveness to new
therapies such as glycoprotein IIb/IIIa inhibitors and low molecular weight heparin (18).
Studies have shown that patients with IWMI who have anterior ST segment
depression and RVMI, have got higher cardiac enzyme values, indicating a larger mass of
ELECTROCARDIOGRAPHY
The value of ECG in diagnosing and localizing the size of infarction is
unequivocal. (20) The 12 lead ECG remains the centre of decision pathway for
management of patients with acute coronary syndrome and to distinguish between the
presentations of those with and without ST segment elevation (21). Katz et al (1946)(22)
set the criteria for electrocardiographic diagnosis of myocardial infarction. Myocardial
infarction was classified into transmural and non-transmural. Transmural were those
demonstrating significant Q wave plus typical ST-T wave alteration and T wave
inversion. In non-transmural infarcts, the established ST segment alteration and T wave
inversion persisted beyond 7 days, but with no significant Q waves.
The inferior wall of the left ventricle is directed to the standard leads II, III and
aVF (23). The hyperacute phase is manifested by increased ventricular activation time,
increased amplitude of R wave, straightening and subsequent slope elevation of the ST
segment, tall and widened T waves.
In the fully evolved phase, standard lead III commonly reflects a QS complex,
while standard lead II and aVF however usually reflect a QR complex. The disappearance
of the small normal initial Q in lateral leads is a corroborative sign of IWMI. Reciprocal
ST segment depression usually occurs in the right precordial leads. (24)
Q waves are frequently seen in lead III in normal patients, so to enhance the
specificity of Q wave in lead III, guidelines have been laid down. According to Harpaz D
et al (1999) (25), Q wave should he greater than 0.03 seconds. To increase the specificity
• Q in Lead II greater than 0.0 3second.
• Lead III Q greater than 0.03sec and Q greater than or equal to 1mm in
lead aVF.
• Lead aVF, Q greater than 0.03 see.
Along with IWMI, changes in the lateral leads (l, aVL, V5, V6) with an
isoelectric or elevated ST segment in lead I identifies obstruction of the circumflex
coronary arteries with a sensitivity specificity and predictive value of 83%, 96% and
93% respectively. Changes in lateral leads are rare in IWMI resulting from obstruction of
the RCA. (27)
ECHOCARDIOGRAPHY
Evaluation of LV Function:
The parameters of systolic and diastolic function can be obtained by M mode or
2D echocardiography, either by measuring left ventricular dimension in systole and
diastole or with LV volumes calculated by area length method in apical2D view.
Systolic Function: The three commonly used indices of systolic LV function are
LV Ejection Fraction = (EDV - E3V / EDV) X 100
Normal- in male 59±6 and in female 58±7
Fractional Shortening (FS) = (LVIDd - LVIDs / LVIDd) X 100
Normal - > 24 %
E-Point Septal Separation (EPSS)
Diastolic Function: The function is assessed by Doppler echocardiography by
calculating several indices but those in common use include peak ‘E’ velocity, peak ‘A’
velocity, E/A ratio and isovolumeic relaxation time. (28)
Segmental Wall Motion Analysis
The American Society of Echocardiography Committee (ASE) on Standards
recommended a semi-quantitative method that derives wall motion score based on a
visual impression of regional wall motion. The left ventricular mass can be divided into 3
equal levels from the apex to base length, resulting in its partition into basal, middle and
apical levels. They proposed a 16-segment model for visual semi-quantitative wall
motion analysis. (29)
The proposed segments are
Base Mid Apical
Basal Anterior Anterior Anterior
Basal Anteroseptal Anteroseptal Inferior
Basal lnferioseptal Inferioseptal Lateral
Basal Inferior Inferior Septal
Basal Posterior Posterior
The five basic wall region visualized are
Anterior Wall: Which was considered to extend over the anterior surface of
ventricles from the anterior interventricular sulcus, around the free ventricular wall to the
origin of the anterior papillary muscle.
Posterolateral wall: was considered to extend posteriorly between the papillary
muscles.
Inferior wall: Extended from the posterior papillary muscle to the junction with
the septum at the posterior interventricular sulcus.
Septal Region: Included the septum.
Apical Region: Included the very tip of ventricular cavity and apex.
One can relate the various segments to coronary artery distribution
Anterior and anteroseptal segments in both basal and middle third and the apical
segments - left anterior descending artery distribution.
Basal, lateral and middle lateral - left circumflex artery distribution.
Posterior and inferoseptal in both the basal and middle third - right coronary
artery distribution.
Scoring Scale: Henry et al (1979) (30) stated that at least 50% of the
endocardium must be visualized in anyone segment throughout the cardiac cycle for
reliable prediction of presence or absence of LV and RV asynergy. A significant concern
motion. For this, strict attention was paid not only to the endocardial inward motion but
also to the wall thickening. Liberman et al (1981) (31), showed that systolic thickening
provided better separation of normal from infarcted myocardium than endocardial motion
alone.
The ASE committee has also proposed the following scoring scale for
standardization of wall segment motion
Score Wall Motion Definition
1. Normal Normal endocardial inward motion and wall thickening in
systole
2. Hypokinesis Reduced endocardial motion and wall thickenil1g in systole
3. Akinesis Absence of endocardial inward motion or wall thickening in
systole
4. Dyskinesis Outward motion or bulging of the segment in systole, usually
associated with thin, scarred myocardium.
Wall Motion Score Index: It can be derived from the sum of all scores divided by
the number of segments visualized. (32).
Assessment of Overall Performance of the Ischemic Left Ventricle:
Left ventricular ejection fraction (LVEF) is one of the most commonly used
indices of systolic LV function. 2DE is a useful noninvasive method for estimation of LV
Following myocardial infarction, there is a decrease in LVEF and this is directly
related to the amount of damaged myocardium and the extent of potentially ischemic
muscle. Morbidity and mortality rates correlated well with initial ejection fraction.
Patients with ejection fraction <30-35% had greater risk of pump failure and death.
Patients with AWMI had a lesser LVEF (38±14) as compared to those with
inferoposterior wall myocardial infarction (55±10) because a greater region of
myocardium was involved in AWMI. (33).
In patients with IWMI, both LVEF and RVEF are depressed, whereas in patients
with AWMI, RVEF generally remains normal. But while RV performance rapidly
improves with prompt return to normal level, as early as 2 days after infarction, there is
less improvement in the LVEF. (34)
Carr et al (1979) (35) in their study found that cross-sectional echocardiography
and radionudeotide angiography were of equal value in the estimation of LVEF.
Although radionuc1eotide ventriculography generally provides a more exact
measurement of ejection fraction, echocardiography appears to be capable of directly or
subjectively evaluating ventricular function well enough to identify patients with risk of
COMPLICATIONS OF ACUTE MYOCARDIAL INFARCTION
Mechanical Complications:
1. Left Ventricular Failure: Even in thrombolytic era, left ventricular dysfunction
remains the single most important predictor of mortality after acute myocardial
infarction. In patients with acute myocardial infarction, heart failure is characterized
either by systolic dysfunction alone or by both systolic and diastolic dysfunction. Left
ventricular diastolic dysfunction leads to pulmonary venous hypertension and pulmonary
congestion whereas systolic dysfunction is principally responsible for a depression of
cardiac Output and of the ejection fraction. Clinical manifestations of left ventricular
failure become more common as the extent of the injury to the left ventricle increases;
mortality increases in association with the severity of the hemodynamic deficit.
Hemodynamic Classification of Patients with Acute Myocardial Infarction: (Killip
Classification)
Class Based on Clinical Examination Based on Invasive Monitoring
I No evidence of pulmonary congestion Normal
II Mild evidence of pulmonary congestion Pulmonary congestion PCWP > 18
CI<2.2
III Pulmonary oedema Peripheral Hypoperfusion
PCWP>18 CI>2.2
IV Cardiogenic Shock Pulmonary congestion and peripheral
2. Cardiogenic Shock: The severest clinical expression of left ventricular failure is
associated with extensive damage to the LV myocardium (about 40%) in more than 80%
of acute myocardial infarction patients in whom it occurs. The remainder have a
mechanical defects such as ventricular septal defect or papillary muscle rupture or
predominant right ventricular infarction. In the part cardiogenic shock has been reported
to occur in upto 20% of parents with acute myocardial infarction, but estimates from
recent large randomised trials of thrombolytic therapy and observational databases report
an incidence rate in the range 7% About 10% of patients with cardiogenic shock present
with this condition at the time of admission, whereas 90% develop it during
hospitalisation (36). Patients with cardiogenic shock due to acute myocardial infarction
are more likely to be older to have a history of a prior myocardial infarction or congestive
heart failure and to have sustained an anterior infarction at the time of development of
shock.
Arrhythmias:
Electrical instability: VPC’s, VT, VF, AIVR, NPAVJT
Pump failure/ excessive sympathetic stimulation: Sinus tachycardia AF / Afl, PSVT
Bradyarrhythmias and conduction disturbances
Progression of Acute Myocardial Infarction: Most of the thrombolytic trial shows that
mortality in IWMI is about half that of AWMI.
Name of Studies
AWMI IWMI
No. of Deaths
No. of
Patients %
No. of Deaths
No. of
Patients %
GISSI-I 403 2193 18.4 145 2004 7.2
ISIS 329 1827 18.0 185 2112 8.8
AIMS 51 292 17.5 26 225 7.8
ASSRT 134 796 16.8 77 773 10.0
LATE 58 410 14.2 30 351 8.6
Average - 16.98% Average – 8.48%
Certain high risk subgroups can be identified in IWMI by single ECG criteria.
These are right precordial ST segment elevation, left precordial ST segment depression
and high degree AV block. 2D echo can also diagnose high risk subgroups like those
having RV and posterior wall assynergy, patients having poor ejection fraction, high wall
motion index score, VSD, papillary muscle ruptures etc. These high risk subgroups have
similar mortality rates as of AWMI, while the low risk subgroups have got mortality rates
The results of thrombolytic trials in myocardial infarction show that thrombolysis
in IWMI is statistically not as significant as in anterior wall myocardial infarction and it
has got only a meager impact in the mortality reduction.
Studies Thrombolytic Deaths/ Patients
Control Deaths/ Patients
Streptokinase
GISSI-I (0-12 h) 137/2009 (6.8%) 145/2004 (7.2%)
ISIS-2 (0-24h) 150/2076 (7.2%) 185/2112 (8.8%)
SK/ASA ISIS-2 (0-24h) 69/1016 (6.8%) 107/1047 (10.2%)
Altepase
ASSET (0-5h) 46/734 (6.3%) 77/773 (10.0%)
LATE (6-12h) 34/381 (8.9%) 30/351 (8.6%)
Prognostic Significance of ECG in Acute Myocardial Infarction
Standard 12 lead ECG serves as an extremely useful tool in risk stratification after
myocardial infarction. Careful analysis of ECG provides comprehensive information
about pathology of the heart, which could lead to cardiac events including reinfarction,
progression of heart failure and death. Identification of post infarction patients at risk or
cardiac death and sudden cardiac death may lead to optimization of medical therapy and
implantation of cardioverter defibillators.
QRS Duration and Myocardial Infarction
In a study by Pudil et al (2001) (38), acute myocardial infarction with
intermediate QRS duration (0.09-0.11sec) on admission electrocardiogram was
More recently it was shown that QRS duration of the admission
electrocardiogram is independently associated with 30 days and 1 year mortality after
acute myocardial infarction in the GUSTO-1 trial. In this trial QRS prolongation had a
more significant outcome in patients with anterior myocardial infarction (39).
Prolonged QRS duration on surface electrocardiogram was associated with left
ventricular dysfunction in patients referred to radionucleotide exercise ventriculography.
It was also reported that QRS (duration > 0.1 seconds indicated decreased left ventricular
ejection fraction .(40).
A QRS of < 0.09 seconds on admission electrocardiogram is indicate of a relative
benign outcome compared with a QRS duration of >0.09 seconds.
The mechanism by which prolonged QRS duration on admission is associated
with increased risk of death is not clear. Multiple physiologic parameters associated with
poor outcome can lead to prolonged QRS duration in patients with acute myocardial
infarction including increased left ventricular muscle mass, myocardial fibrosis, increased
area of necrosis, involvement of conduction system in the ischaemic area, poor metabolic
state that slows conduction, and effects of various medications.
After adjusting for all significant variables associated with mortality, including
age, gender, diabetes mellitus, smoking, systemic hypertension, Killip class>2 on
admission and anterior location of myocardial infarction prolonged QRS duration both in
the those with QRS duration> 0.11 seconds was found to be independently associated
QRS prolongation was positively associated with older age, female gender,
anterior myocardial infarction and congestive heart failure on admission.
In 743 patients of the placebo arm of the cardiac arrhythmia suppression trial
1991 with stable coronary artery disease and QRS duration >100 ms, the risk ratio was
1.4 for new or worsening congestive heart failure, 1.5 for arrhythmic death or cardiac
arrest and 1.4 for all cause mortality (p<.05). In post acute myocardial infarction patients
QRS prolongation was significantly correlated with arrhythmic events (41).
In patients with normal coronary arteries, QRS duration decreases with exercise
probably because of an increase in the sympathetic tone. In contrast, in patients with
coronary artery disease, QRS duration increases during exercise testing. Michaelids et al,
1993(42) reported that exercise induced QRS prolongation was proportional to the
number of coronary arteries with >70% stenosis. Mean QRS prolongation was 4.8±7.5
ms in patients with I-vessel disease, 7.8±11.8 ms in patients with 2-vessel disease and
13.3±12.1 ms in patients with 3-vessel disease (p< 0.001).
Distortion of the terminal portion of the QRS complex in the admission ECG is an
independent predictor of increased hospital mortality in patients receiving thrombolytic
therapy >2 hour after the onset of symptoms. During regional myocardial ischemia the
conduction velocity of the activation wave in the Purkinje fibres is prolonged .(43)
QRS prolongation on surface electrocardiography has been identified as a marker
for increased cardiac mortality. A potential mechanism for increased mortality is
ventricular tachycardia. Patients with prolonged QRS duration were older had lower
was a significant predictor of sustained monomorphic VT inducibility (p< 0.0001). On
Multivariate analysis correcting for age, sex, LVEF, history of myocardial infarction,
medication and QRS conduction delay proved to be independently associated with
sustained monomorphic VT inducibility (relative risk 3.290, 95% confidence interval
2.185 to 4.953 for prolonged vs. normal QRS duration) (44).
At multivariate analysis, prolonged filtered QRS duration had an independent
relation to late arrhythmic events after acute myocardial infarction. (45)
QRS duration remains a very powerful predictor of future cardiac events in post
infarction patients (46). QRS duration reflects well the magnitude of left ventricular
dysfunction and therefore not surprisingly is a powerful predictor of mortality in post
infarction patients.(40). A study by Fadl et al (2003) (47) in a large population of post
infarction patients indicate that QRS duration 0.12 second is associated with hazard ratio
of 1.7; p = 0.001.
Significance of R/Q Ratio in Lead II in Inferior Wall Myocardial Infarction
Inferior wall of the heart is constituted by the inferior wall of left ventricle and is
oriented to the positive electrodes of lead II, III, avF.
Inferior wall myocardial infarction has 3 phases
1. Early hyper acute - characterized by elevation of ST segments.
2. Ful1y evolved phase - characterized by the presence of pathological Q or QS
complexes coved and elevated ST segments and inverted sharply pointed and
3. Chronic stabilized phase - Characterized by residual Q wave abnormalities in
leads II, III, avF, particularly in lead II, avF.
Pathological Q waves of inferior wall myocardial infarction are not usually deep
or as wide as the pathological Q waves which occur with anterior wall myocardial
infarction because inferior wall myocardial infarction is reflected by extremity leads (48).
In IWMI a QS complex is usually present in lead III and avF. Standard lead II
usually reflects Qr or QR complex. In inferior wall myocardial infarction, among the
inferior leads tallest terminal R wave is seen in lead II. (48)
We can explain this distribution of terminal R wave by considering the anatomy
of inferior wall. We can divide the inferior wall into right lateral and left lateral region.
Lead III is oriented to right lateral region and lead II to left lateral region.
The brunt of infarction affects the right lateral region of inferior wall with sparing
of left lateral region so lead III reflects the largest and widest QS complex, lead II
however is oriented to left lateral region of inferior wall reflects the potentials of healthy
overlying muscle as a terminal R wave; so loss of R wave in lead occurs mainly in
Two major determinants of clinical outcome in patients with acute myocardial
infarction are the extent of infarction and the residual left ventricular function (49).
In patients with inferior wall myocardial infarction terminal R wave and R/Q ratio
in lead II reflects the extent of infarction and residual function so by calculating R/Q ratio
Alexander Arditti et al (1985) (50) studied a simplified QRS scoring system for
the estimation of the severity of acute inferior myocardial infarction.
Electrocardiographic assessment of the R/Q ratio in lead II of patients with first acute
inferior wall myocardial infarction offers important indirect evidence of severity and
extent of myocardial infarction. An R/Q ratio of more than 2 predicts mild and localized
left ventricular involvement with good global left ventricular function and good clinical
course. An R/Q ratio between 1 and 2 predicts a greater degree of local asynergy with
some lateral extension with reduced global left ventricular function, but still a good
clinical outcome. R/Q ratio less than one predicts severe inferior wall asynergy with high
incidence of lateral wall involved, reduced global left ventricular function and
complicated clinical course during the acute phase.
Eliezer et al (1988) (51) conducted similar study in which acute inferior wall
myocardial infarction were divided into three groups according to the R/Q ratio in lead II.
This was done to correlate these groups with characteristic course to electrocardiographic
status. Patients with R/Q > 2 (group 1) had a more rapid progression through the
electrocardiographic stages along with better clinical course than patients with lower R/Q
ratio. Patients in group In with R/Q < 1 had a slower electrocardiographic stage
progression which correlates well with a more complicated clinical course. Group II was
an intermediate group in both the electrocardiographic and clinical course. It is suggested
that the R/Q ratio in lead II can be used as a marker of the severity of IWMI since it
correlates well with the course of electrocardiographic stages. This may be an additional,
simple and inexpensive electrocardiographic tool for following the natural course of
Lewin (1986) (52) conducted a study in which acute inferior wall myocardial
infarction were divided into three groups. Group I predominant right ventricular
infarction, group II combined right and left ventricular infarction and in group III
predominant left ventricular infarction. Patients with predominant RV infarction (Group
I) had smaller Q wave values and taller mean R wave in the inferior leads than patients in
the other groups. In predominant RV infarction R/Q ratio> 2.5 and is combined RV and
MATERIAL AND METHODS
The study was carried out on 75 patients admitted in ICCU of Department of
Medicine, Government Royapettah Hospital, Kilpauk Medical College, Chennai-10.
SELECTION CRITERIA:
In this study 75 cases of both sexes of more than 20 years of age with first episode
of myocardial infarction, typical chest pain of more than 30 minutes, onset of symptoms
within previous 6 hours, at least 0.2 mv ST segment elevation in two or more contiguous
precordial leads or at least 0.1mv ST segment elevation in two or more leads were
included.
The screening criteria for the identification of the presence of myocardial
infarction were:
• Inferior criterion: Q>30 msec in lead aVF
• Anterior criteria: A Q or R< 0.1 mv and < 10 m sec in V2.
EXCLUSION CRITERIA
Patients with ECGs showing evidence of LBBB, RBBB, LAHB, LVH, old
myocardial infarction, preexicitation syndrome were excluded from the present study.
All cases were subjected to following examination.
Case number, registration number, father/husband name, age, sex,
Presenting complaints with duration were noted in detail such as chest pain, its
site, duration and radiation, accompanying features like sweating, nausea, vomiting,
syncope, breathlessness, palpitation, oedema, abdominal distension, right hypochondrial
pain and other atypical symptoms.
Detailed symptomatology of clinical presentation was sought with special
reference to onset, duration, intensity, relationship to circadian and seasonal rhythm of
symptoms.
Past History
It was taken to exclude the presence of a previous myocardial infarction and to
find out the risk factors including hypertension, diabetes mellitus and other evidence of
atherosclerotic disease like CVA.
Family History
Family history of diabetes mellitus, coronary artery disease, hypertension,
dyslipidemia, age of death were enquired for.
Personal History
It was taken with special reference to addictions like tobacco chewing, smoking,
General Examination:
It was done meticulously in all cases, special care was taken to record pulse rate,
rhythm, volume, character and condition of arterial wall. Blood pressure was taken to
supine position. Presence of pallor, cyanosis, pedal oedema and raised JVP was noted.
Systemic Examination
• Detailed Cardiovascular system examination was done by observing,
palpating apex impulse, thrills, precordial pulsations were looked for, heart
sounds S1, S2, S3 and S4, murmurs were auscultated. (site, duration, timing,
character and radiation).
• Respiratory system was examined by auscultating for breath sounds and to
look for evidence of pulmonary oedema.
• Abdominal examination was done for the presence of any organomegaly and
ascites.
• Central nervous system was examined for presence of any neurological
deficit.
Investigations
The following investigations were done in all cases.
• Haemogram - Hb, TLC, DLC, ESR.
• Urine - Albumin, Sugar and Microscopy
Electrocardiogram:
12 lead ECG was taken in all cases taking special precautions while placing the
chest leads. Repeat ECGs were taken every day on first three consecutive days of
admission followed by every alternate day until 10th day.
Rigorous Definition of Wave Forms
When the initial aspect of the QRS complex is negative, a Q wave is present.
Prior to returning to the baseline, this negative deflection may be smooth or notched. A
smooth q wave is present when the initial negative deflection contains no reversal in the
direction of 0.05 mv or more.
The duration and amplitude of such Q wave are measured as the width and depth
respectively of the initial negative deflection.
A notched Q wave is present if there is a reversal in direction of 0.05 mv or more
within the initial negative deflection. In this instance, the duration of the Q wave should
be measured along the PR baseline only to the point directly above the peak of the notch
and remainder of the negative deflection should not be considered. The amplitude of the
Q should be measured to the nadir of the negative deflection preceding the notch.
An R wave is defined on the initial positive deflection. A notched R wave is
present if there is a reversal in direction of 0.05 mv or more within the initial 40 ms of the
Accurate Wave from Measurement:
Careful manual measurement of both amplitudes and duration should be made
with calipers using center of the trace of the inscribed waveform.
Rand Q wave amplitude and resultant R/Q ratio were calculated in lead-II using
and 7th day of hospitalisation. By using 3rd day R/Q ratio on lead-II short term prognosis
of inferior wall myocardial infarction was evaluated. By comparing R/Q ratio on 7th and
3rd day the relationship of thrombolysis and R/Q ratio was evaluated.
For the study, patients of inferior wall myocardial infarction were divided into
groups according to R/Q ratio in lead II on 3rd day.
Group I Includes patients of IWMI with R/Q ratio> 2
Group II Includes patients of IWMI with R/Q ratio 1- 2
Group III Includes patients of IWMI with R/Q ratio < 1
For the study of QRS duration, widest QRS duration in standard lead was
manually measured on 3rd day of hospitalisation.
Only leads without extreme ST segment deviation were considered. According to
the QRS duration, patients of myocardial infarction including both inferior and anterior
wall myocardial infarctions were divided into 3 groups.
Group A With QRS duration < 0.09 See.
Group B With QRS duration 0.09 - 0.11 sec (intermediate QRS
prolongation)
ECHOCARDIOGRAPHY
The 2 dimensional echocardiography study was performed on the 7th day post
myocardial infarction, with the patient in the left lateral decubitus position with Toshiba
Model SSH -140 echocardiography machine. A 3.75 MHz phased array sector transducer
was used. The left ventricle was studied as recommended by American Society of
Echocardiography in the long and short view.
The committee proposed the following scoring scale for standardization of wall
segment motion.
A normally contracting segment or a hypercontracting segment is assigned a score
of 1, Hypokinesia 2, Akinesia 3, Dyskinesia 4 and aneurysmal segment 5.
Dyssynergy of a LV segment was defined as Hypokinesis, Akinesis or Dyskinesis
involving> 50% of that segment.
The ejection fraction was calculated by the standard formula as recommended by
American Society of Echocardiography 1989(ASE).
Left Ventricular Ejection Fraction:
EDV -ESV
(LVEF) =--- X 100
EDV
EDV = End Diastolic volume
Normal> 60%
The QRS duration and R/Q ratio were evaluated with ejection fraction and
regional wall motion abnormalities.
Statistical Analysis
In present study comparison among the three groups using tables and graphic
presentations were performed. The analysis between groups was performed using student
‘t’ test or the Chi Square test when indicated. All data were expressed as mean standard
OBSERVATION
The present series “Study of QRS Duration and R/Q ratio in the assessment of
Severity of Acute Myocardial Infarction” was carried out on 75 patients admitted in
ICCU of Department of Medicine, Government Royapettah Hospital, Kilpauk Medical
[image:38.612.92.519.367.523.2]College, Chennai-10.
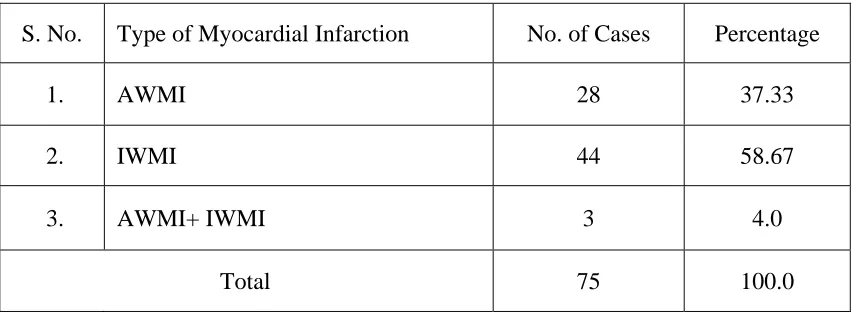
Table No.1
Distribution of Type of Myocardial Infarction
S. No. Type of Myocardial Infarction No. of Cases Percentage
1. AWMI 28 37.33
2. IWMI 44 58.67
3. AWMI+ IWMI 3 4.0
Total 75 100.0
58.67% of the patients were having inferior wall myocardial infarction, 37.33% were
having anterior wall myocardial infarction while 4.0% patients had both anterior and
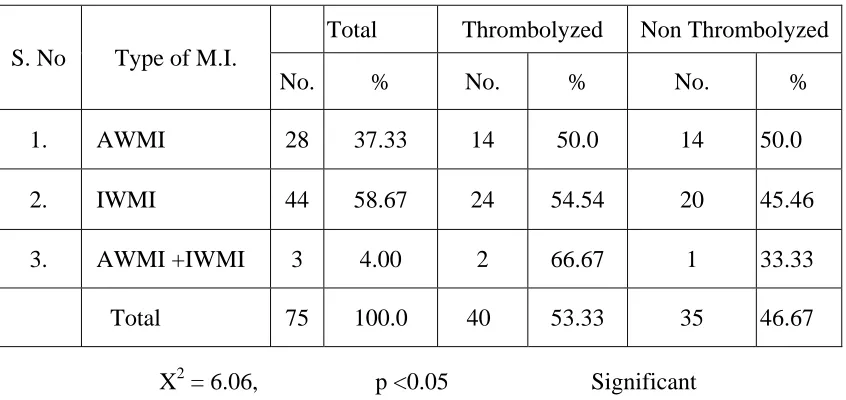
Table No. 2
Thrombolytic Therapy in Acute Myocardial Infarction
S. No Type of M.I.
Total Thrombolyzed Non Thrombolyzed
No. % No. % No. %
1. AWMI 28 37.33 14 50.0 14 50.0
2. IWMI 44 58.67 24 54.54 20 45.46
3. AWMI +IWMI 3 4.00 2 66.67 1 33.33
Total 75 100.0 40 53.33 35 46.67
X2 = 6.06, p <0.05 Significant
[image:39.612.92.515.131.331.2]Out of total cases 53.3% patients were thrombolyzed.
Table No. 3
Distribution of Ejection Fraction
Type of Myocardial Infarction
< 40% 41-50 % > 50%
No. % No. % No. %
AWMI (n-26) 9 34.61 13 50.0 4 15.38
IWMI (n-41) 7 '17.07 21 51.21 13 31.70
AWMI +IWMI (n-3) 1 33.33 2 66.67 - -
Total (n-70) 17 24.28 36 51.42 17 24.28
X2 = 41.86, p <0.001 Highly Significant
Most of the patients with of anterior wall myocardial infarction had left
ventricular ejection fraction in the range of 41-50%. Nine patients (34.61%) with anterior
wall myocardial infarction had left ventricular ejection fraction < 40%, against 17.07%
[image:40.612.91.521.260.449.2]patients of inferior wall myocardial infarction.
Table No. 4
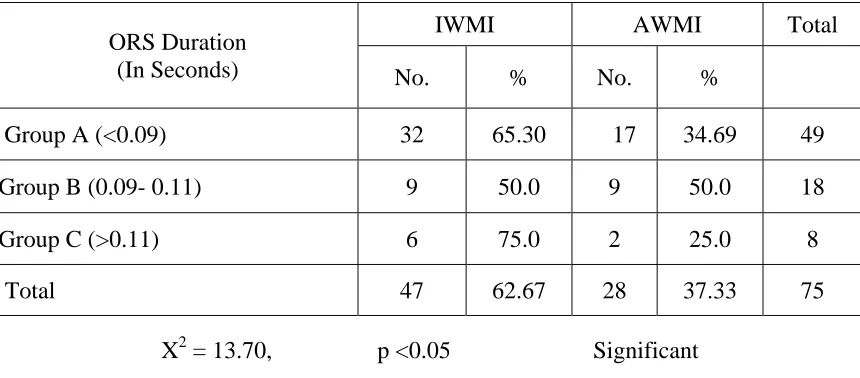
Distribution of Myocardial Infarction in Relation to QRS Duration
ORS Duration (In Seconds)
IWMI AWMI Total
No. % No. %
Group A (<0.09) 32 65.30 17 34.69 49
Group B (0.09- 0.11) 9 50.0 9 50.0 18
Group C (>0.11) 6 75.0 2 25.0 8
Total 47 62.67 28 37.33 75
X2 = 13.70, p <0.05 Significant
65% of the patients with combined inferior wall myocardial infarction and
anterior wall myocardial infarction were distributed in group A (<0.09) 40% patients with
anterior wall myocardial infarction alone had QRS duration >0.09 seconds as compared
Table No. 5
QRS Duration and Cardiac Arrhythmias in Myocardial Infarction
Arrhythmia
Group A (< 0.09) (n-49)
Group B (0.09 – 0.11 ) (n-18)
Group C
(> 0.11) (n-8) Total
No. % No. % No. % No. %
S.V.E. 3 50.0 1 16.67 2 33.3 6 16.21
V.E. 12 66.67 4 22.22 2 11.11 1R 48.04
S.V.T. - - 2 10O.n - - 2 5.4
V.T. 3 33.33 4 44.44 2 22.22 9 25.0
C.H.B. - - 2 100.0 - - 2 5.4
Ventricular ectopics were the most common arrhythmia observed. Maximum
incidence of ventricular tachycardia was in group B (44.44%).
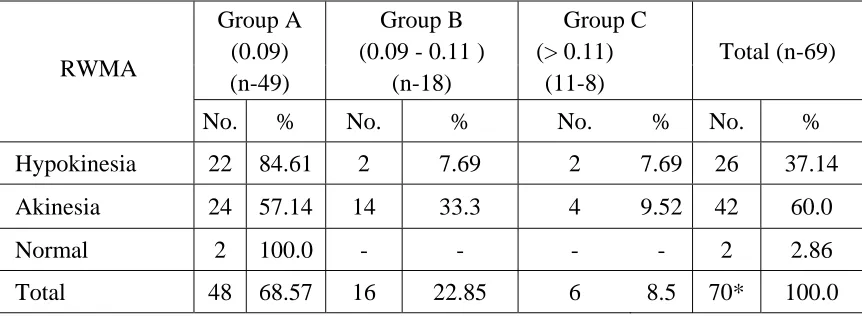
Table No. 6
QRS Duration and Regional Wall Motion Abnormality
Group A Group B Group C
RWMA (0.09) (0.09 - 0.11 ) (> 0.11) Total (n-69) (n-49) (n-18) (11-8)
No. % No. % No. % No. %
Hypokinesia 22 84.61 2 7.69 2 7.69 26 37.14
Akinesia 24 57.14 14 33.3 4 9.52 42 60.0
Normal 2 100.0 - - - - 2 2.86
Total 48 68.57 16 22.85 6 8.5 70* 100.0
[image:41.612.91.522.484.642.2]84.61 57.14 7.69 33.3 7.699.52 0 10 20 30 40 50 60 70 80 90 Percentage
1 2 3
QRD Duration
QRS DURATION AND REGIONAL WALL M OTION ABNORM ALITY
Hypokinesia Akinesia
QRS DURATION AND EJECTION FRACTION
0 10 20 30 40 50 60 70 80 90 100
1 2 3
QRS Duration Pe rc e n ta g e
Akinesia was reported from 24 patients (50%) of group A, 14 patients
(87.5%) of group B and 4 patients (66.67%) of group C. Hypokinesia was reported
from 22 patients (46%) of group A, 2 patients (12.5%) of group B and 2 patients
(33.33%) of group C. Two patients in Group A were having normal regional wall
[image:43.612.92.520.287.513.2]motion.
Table No. 7
QRS Duration and Ejection Fraction
Ejection Group A Group B Group C Total
« 0.09) (0.09 - 0.11) (> 0.11)
(n-70) Fraction (n-49) (n-18) (n-8)
(%)
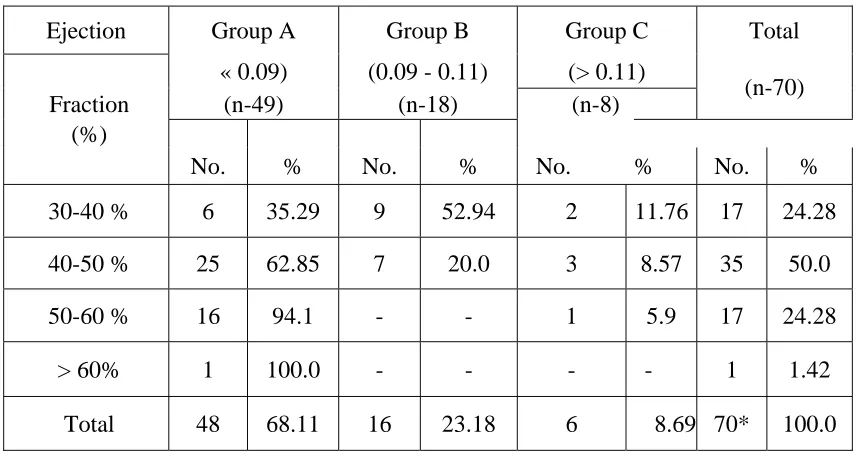
No. % No. % No. % No. %
30-40 % 6 35.29 9 52.94 2 11.76 17 24.28
40-50 % 25 62.85 7 20.0 3 8.57 35 50.0
50-60 % 16 94.1 - - 1 5.9 17 24.28
> 60% 1 100.0 - - - - 1 1.42
Total 48 68.11 16 23.18 6 8.69 70* 100.0
*5 Patients expired before Echocardiography.
In Group A, patients with ejection fraction >50 was 35.45%. In Group C
patients with ejection fraction >50 was 16.7% and in Group B patients had ejection
Table No. 8
Killip Class and Distribution of Cases in Myocardial Infarction in Relation to QRS Duration
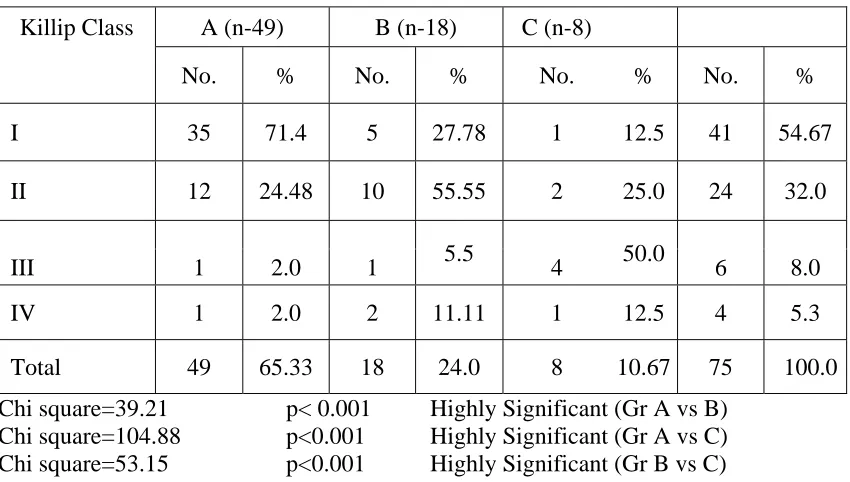
Killip Class A (n-49) B (n-18) C (n-8)
No. % No. % No. % No. %
I 35 71.4 5 27.78 1 12.5 41 54.67
II 12 24.48 10 55.55 2 25.0 24 32.0
5.5 50.0
III 1 2.0 1 4 6 8.0
IV 1 2.0 2 11.11 1 12.5 4 5.3
Total 49 65.33 18 24.0 8 10.67 75 100.0
Chi square=39.21 p< 0.001 Highly Significant (Gr A vs B) Chi square=104.88 p<0.001 Highly Significant (Gr A vs C) Chi square=53.15 p<0.001 Highly Significant (Gr B vs C)
In group A 71.4 % of patients belonged to Killip class I as compared to 12.5% in
group C. Patients with Killip class > II were62.5% in group C, 16.6% in group B and 4%
in group A.
Table No. 9
Killip Class with Mean QRS Duration and Ejection Fraction in AWMI
Killip Class Mean QRS Duration Mean Ejection Fraction
I 0.08±0.01 47.60±9.82
II 0.09±0.01 42.20±4.78
III 0.09 43
N 0.10 Expired before Echo
[image:44.612.90.518.520.671.2]K IL L IP C L AS S AND DIS T R IB UTION OF C AS E S IN MYOC AR DIAL
INF AR C T ION IN R E L ATION T O QR S DUR ATION
0 10 20 30 40 50 60 70 80
G roup A (< 0.09) G roup B (0.09‐0.11) G roup C (>0.11)
QR S Duration
Pe rc e n ta g e
S eries 1 S eries 2 S eries 3 S eries 4
10 DAY MORTALITY IN DIFFERENT GROUPS IN
RELATION TO QRS DURATION
98 83.35 75 2 16.67 25 0 20 40 60 80 100 120
1 2 3
Mean QRS duration of class I patient was 0.08±0.01 as compared to 0.10 in
[image:46.612.92.513.201.403.2]Killip class IV patients. As QRS duration increases Killips Class also increases.
Table No. 10
10 Day Mortality in Different Groups in Relation to QRS Duration
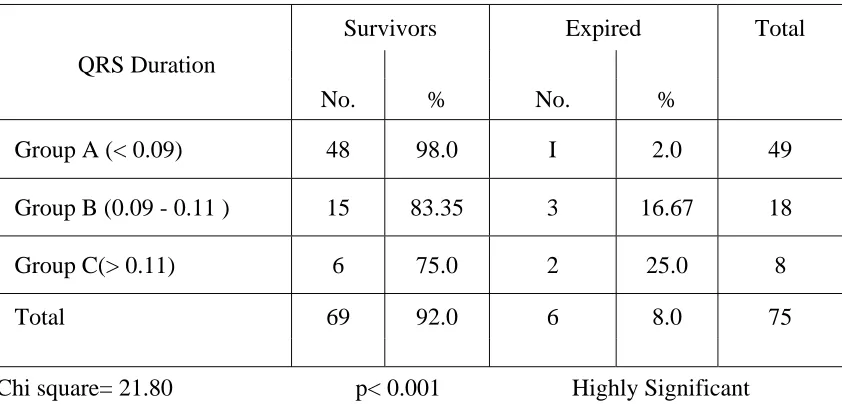
Survivors Expired Total
QRS Duration
No. % No. %
Group A (< 0.09) 48 98.0 I 2.0 49
Group B (0.09 - 0.11 ) 15 83.35 3 16.67 18
Group C(> 0.11) 6 75.0 2 25.0 8
Total 69 92.0 6 8.0 75
Chi square= 21.80 p< 0.001 Highly Significant
In the present study out of the 75 patients 6 (8.0%) expired; one from Group
A (2.0%)/ 3 from group B (16.67%) and 2 (25.0%) from group C. In the mortality
group, except one patient of AWMI, five of them expired before Echocardiography
Table No. 11
Distribution of IWMI According to R/Q Ratio in Lead II
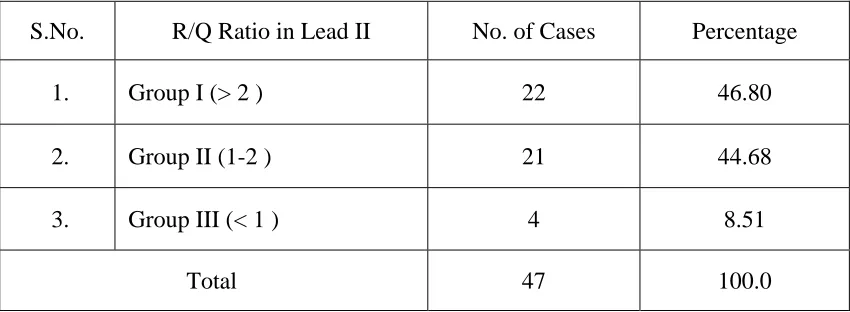
S.No. R/Q Ratio in Lead II No. of Cases Percentage
1. Group I (> 2 ) 22 46.80
2. Group II (1-2 ) 21 44.68
3. Group III (< 1 ) 4 8.51
Total 47 100.0
Maximum number of patients were in group I (46.80%) followed by group II
(44.68%).
Table No. 12
R/Q Ratio and Complications at the Time of Admission
S. N. Complications R/Q Ratio
Group I (> 2) Group II (1-2) Group III (<1)
(n-22) (n-21) (n-4)
1. Hypotension - 1 (4.76%) 1 (25.0%)
2. Raised JVP 3 (13.63%) 4 (19.0%) 2 (50.0%)
3. Arrhythmia 7 (31.81 %) 9 (42.8%) 2 (50.0%)
Chi square= 22.91 p<0.001 Highly Significant.
All patients of group III had different types of complications of myocardial
infarction, 50% of them developed arrhythmia, 50% had raised JVP and 25% had
[image:47.612.89.518.440.603.2]raised JVP and none of them had hypotension
Table No. 13 R/Q Ratio and Arrhythmia
Group I Group II Group III Total (n-17)
Arrhythmia (R/Q > 2) (R/Q 1-2) (R/Q < 1)
No. % No. % No. % No. %
S.V.E. 1 20.0 3 60.0 1 20.0 5 29.41
V.E. 4 57.14 3 42.85 - - 7 41.17
S.V.T. - - 1 100.0 - - I 5.88
V.T. 1 33.3 1 33.3 1 33.3 3 17.64
C.H.B. - - 1 100.0 - - 1 5.88
Most common arrhythmia reported was ventricular ectopics (41.1%) followed by
supraventricular ectopics (29.4%). Out of 47 patients with inferior wall myocardial
infarction only 3 patients (17.64%) had ventricular tachycardia, with 33.3% of patients in
each group.
Table No. 14
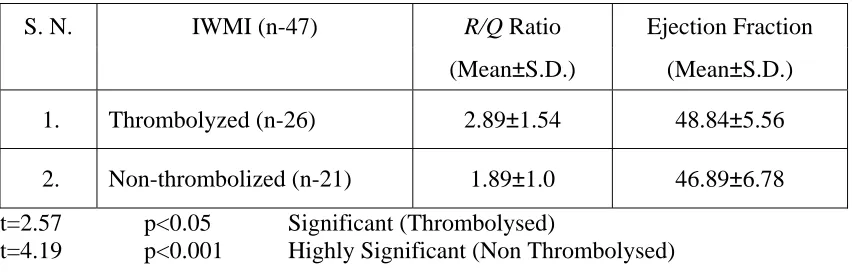
R/Q Ratio and Ejection Fraction in Thrombolyzed and Non Thrombolyzed in Inferior Wal1 Myocardial Infarction
S. N. IWMI (n-47) R/Q Ratio Ejection Fraction
(Mean±S.D.) (Mean±S.D.)
1. Thrombolyzed (n-26) 2.89±1.54 48.84±5.56
2. Non-thrombolized (n-21) 1.89±1.0 46.89±6.78
[image:48.612.90.519.559.698.2]There is statistically significant difference in mean R/Q ratio and EF in
[image:49.612.89.511.188.384.2]thrombolysed and non thrombolysed patients of inferior wall myocardial infarction.
Table No. 15
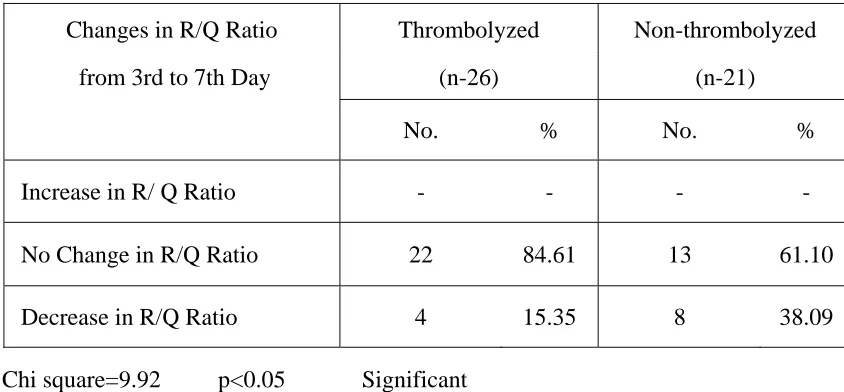
Relationship of Change in R/Q Ratio with Thrombolysis
Changes in R/Q Ratio Thrombolyzed Non-thrombolyzed
from 3rd to 7th Day (n-26) (n-21)
No. % No. %
Increase in R/ Q Ratio - - - -
No Change in R/Q Ratio 22 84.61 13 61.10
Decrease in R/Q Ratio 4 15.35 8 38.09
Chi square=9.92 p<0.05 Significant
Out of 26 patients of inferior wall myocardial infarction thrombolyzed 22
patients (84.61 %) had no change in R/Q ratio from 3rd day to 7th day. But 4 patients
(15.35%) showed a decrease in R/Q ratio on 7th day as compared to R/Q ratio on 3rd
day. In non-thrombolyzed patients of IWMI 8 patients (38.09%) showed a decrease in
R/Q ratio on 7th day as compared to R/Q ratio on 3rd day. So significantly less
number of patients showed decrease in R/Q ratio in thrombolyzed as compared to
RELATIONSHIP OF CHANGE IN R/Q RATIO WITH THROM BOLYSIS 84.61 61.1 15.35 38.09 0 10 20 30 40 50 60 70 80 90 1 2 P er cen ta g e
No Change in R/Q Ratio Decrease in R/Q Ratio
R/Q RATIO AND REGIONAL WALL M OTION ABNORM ALITIES (RWM A)
0 10 20 30 40 50 60 70 80
1 2 3
R/Q Ratio Pe rc e n ta g e
Table No. 16
R/Q Ratio and Regional Wall Motion Abnormalities (RWMA)
RWMA Group I Group II Group III
(>2) (1-2) «1)
No. % No. % No. %
Hypokinesia (n-22) 14 63.64 6 31.57 2 66.67
Akinesia (n-21) 7 31.8 13 68.43 1 33.3
Normal (n-1) 1 4.54 - - - -
Total (n-44) 22 100.0 19 100.0 3 100.0
*3 patients of IWMI expired befor Echocardiography.
Chi square=10.23 p<0.05 Significant (I vs III) Chi square=12.99 p<0.05 Significant (II vs III) Chi square=25.69 p<0.001 Highly Significant (I vs II)
Out of 22 patients in group I, 14patients (63.64%) had hypokinesia and 7 patients
(31.8%) had akinesia of inferior segment of left ventricle. Out of 44 patients of IWMI; 22
patients had hypokinesia in which 14 patients (63.64 %) belonging to group I; only 2
patients (9.0%) belonged to group III.
Table No. 17
R/Q Ratio in Lead II and Ejection Fraction in IWMI
S. No. RlQ Ration in Lead II No. of Cases Mean Ejection Fraction
1. Group I (> 2) 22 49.91±5.99
2. Group II (1-2) 21 46.10±5.84
3. Group III (< 1) 4 42±6.32
[image:51.612.90.519.548.710.2]R/Q RATIO IN LEAD II AND EJECTION FRACTION IN IWMI (N-47) 38 40 42 44 46 48 50 52
1 2 3
R/Q Ratio in Lead II
Me a n E je c ti o n Fr a c ti on
KILLIP CLASS AND DISTRIBUTION OF CASES IN INFERIOR WALL M YOCARDIAL INFARCTION
17 4 1 0 12 6 3 0 3
0 0 1
0 2 4 6 8 10 12 14 16 18
1 2 3 4
Killip Class No . o f Ca s e s
Among the various groups, maximum mean ejection fraction was reported in
group I i.e. R/Q > 2. Lowest mean ejection fraction was in patients with R/Q ration < 1
[image:53.612.90.512.268.515.2](group III).
Table No. 18
Killip Class and Distribution of Cases in IWMI
Killip Group I Group II Group III
(R/Q> 2) (R/Q 1-2) (R/Q < 1) Class
No. % No. % No. %
I ( n=32) 17 77.2 12 57.0 3 75.0
II (n=10) 4 18.18 6 28.5 - -
III (n=4) 1 4.54 3 14.28 - -
IV (n=1) - - - - 1 25.0
Total 22 100.0 21 100.0 4 100.0
(n=47)
Chi square=70.23 p<0.001 Highly Significant (Gr I vs Gr III) Chi square=10.36 p<0.05 Significant(Gr I vs Gr II)
Out of 32 cases of Killip class 117 (53.12%) patients from Group I and 3 (9.37%)
patients are from group III. Only one case of Killip class IV was reported from the
present study, which was from group III. Majority of group II patients were in Killip
Table No. 19
Killip Class with Mean R/Q Ratio and Ejection Fraction in IWMI
Killip Class Mean R/Q Ratio Mean Ejection Fraction
I 2.66 ±1.49 49.55 ±5.22
II 2.19 ±1.02 46.64 ±6.61
III 2.0 ±1.73 40.0 ±5.29
IV 0 38
r =-1.0, insignificant r = -1.0, insignificant
Mean R/Q ratio of Killip class I was 2.66 ±1.49 against 2.0 ±l.73 in Killip class
III. Mean ejection fraction of Killip class I was 49.55 ±5.22 and 40.0 ±5.29 in Killip class
III. There was a weak correlation between mean R/Q ratio and mean ejection fraction
with Killip class.
Table No. 20
Comparison of R/Q Ratio and QRS Duration in Relationship to Ejection Fraction
S.No. R/Q Ratio Mean Ejection QRS Duration Mean Ejection
Fraction Fraction
1. Group I (> 2) 49.91 ±5.99 Group A (< 0.09) 48.96 ±6.53
2. Group II (1-2) 46.10 ±5.84 Group B (0.09 - 0.11 ) 40.94 ±3.90
3. Group III (<1) 42 ±6.32 Group C (> 0.11) 43.17 ±4.83
Mean ejection fraction of group I was 49.91 ±5.99 and group A
was 48.86 ±6.53. Mean ejection fraction of group III was 42 ±6.32 and in group C it
was 43.17 ±4.83, as R/Q decreases the reduction in mean ejection fraction was also
significant. Similar to this prolongation of QRS duration also correlates with
[image:54.612.92.515.461.591.2](0.09-0.11) in Group B had lowest mean ejection fraction.
Table No. 21
Correlation of R/Q Ratio Groups with QRS Duration Groups in IWMI
R/Q Ratio No .of QRS Duration No. of %
Patients Patients
Group A «0.09) 20 90.90
Group I
22 Group B (0.09-0.11) 2 9.10 (R/Q> 2)
Group C (>0.11) 0 0
Group A (>0.09) 11 52.4
Group II
21 Group B (0.09-0.11) 5 23.80 (R/Q 1- 2)
Group C (>0.11) 5 23.80
Group A (<0.09) 1 25.0
Group III
4 Group B (0.09-0.11) 2 50.0 (R/Q < 1)
Group C (>0.11) 1 25.0
Percentage of patients with QRS duration < 0.09 sec was 90.90% in group I,
52.40% in group II and 25% in group III.
In group III (R/Q<l) 25% patients belong to group A and 25% belong to group
QRS DURATION AND MEAN EJECTION FRACTION 48.96 40.94 43.17 36 38 40 42 44 46 48 50
1 2 3
QRS Dur ation
M e a n E je c ti on Fr a c ti on
CORRELATION OF R/Q RATIO GROUPS AND QRS DURATION GROUPS 0 10 20 30 40 50 60 70 80 90 100
1 2 3
R/A Ratio Pe rc e n ta g e
DISCUSSION
The present series “Study of QRS Duration and R/Q Ratio in the Assessment of
Severity of Acute Myocardial Infarction” was carried out on 75 patients admitted in
ICCU of Department of Medicine, Government Royapettah Hospital, Kilpauk Medical
College, Chennai-10.
For the study of “QRS Duration” in the severity of myocardial infarction (both
AWMI and IWMI) patients were divided into 3 groups.
Group A With QRS duration < 0.09 Sec.
Group B With QRS duration 0.09 - 0.11 see (intermediate QRS prolongation)
Group C With QRS duration > 0.11 see (Significant QRS prolongation)
For the study; patients of inferior wan myocardial infarction were divided into 3
groups according to “R/Q ratio” in lead II on 3rd day.
Group I Includes patients of IWMI with R/Q ratio> 2
Group II Includes patients of IWMI with R/Q ratio 1- 2
TYPE OF MYOCARDIAL INFARCTION
In the present study 44 patients (58.67%) were having inferior wall myocardial
infarction 28 patients (37.33%) were having anterior wall myocardial infarction and 3
(4.0%) were having both anterior and inferior wall myocardial infarction.
DISTRIBUTION OF EJECTION FRACTION
In the present study 34.61% of anterior wall myocardial infarction patients were
having LVEF of < 40% as compared to 17.07% of patients of inferior wall myocardial
infarction. The percentage of patients of anterior wall myocardial infarction with ejection
fraction of > 50% was only 15.38% as compared to 31.07% in inferior wall myocardial
infarction. So statistically significant lower ejection fraction in anterior wall myocardial
infarction as compared to IWMI (p< 0.001) was seen.
The observation was similar to that of Mark et al (1987) (53) who observed that
there is greater left ventricular involvement and dysfunction in patients with anterior
myocardial infarction of equivalent enzymatic size.
Eaton et al (1979) (54) in a limited series of 28 patients showed that anterior
infarcts are more at risk of expanding with thinning of the infarct zone combined with
acute regional dilatation than inferior infarcts. It is anticipated that this process would
lead to greater left ventricular regional wall motion abnormality both at rest and during
Strass et al (1980) (55) observed that there was greater involvement and reduced
function of the left ventricle in patients with anterior infarction compared to those with
inferior infarction of equivalent enzymatic size.
QRS DURATION AND DISTRIBUTION OF MYOCARDIAL INFARCTION:
In the present study most of the patients of inferior as well as anterior wall
myocardial infarction were distributed in group A (QRS < 0.09 sec.) 40% of AWMI
patients were having QRS duration > 0.09 seconds as compared to 30% of patients in
IWMI (p<0.05).
QRS DURATION AND ARRHYTHMIA IN MYOCARDIAL INFARCTION:
Ventricular ectopics were the most common arrhythmia observed in relationship
to QRS duration groups. Maximum incidence of ventricular tachycardia (44.44%) was in
group B (QRS 0.09-0.11 sec.). Out of the 8 patients in group C (QRS > 0.11 sec) 2
patients were (25.0%) having ventricular tachycardia as com pared to 3 patients (6.38%)
in group A (< 0.09 sec.) so statistically significant high incidence of malignant
arrhythmias was noted in patients of intermediate QRS prolongation (0.09 - 0.11 sec) and
significant QRS prolongation (> 0.11 see) in the present study.
Previous study by Pudil et al (2001) (38) showed that in hospital complication
including asystole, ventricular tachycardia, ventricular fibrillation, congestive heart
Prolonged QRS duration was a significant predictor of sustained monomorphic
VT inducibility (p<0.00l) (Relative risk 3.290, 95% confidence interval 2.185 to 4.953
for prolonged vs normal QRS duration) (44).
At multivariate analysis, only low left ventricular ejection fraction, prolonged
QRS duration, reduced heart rate variability index, and detection of approximately 2 runs
of unsustained VT per monitoring had an independent relation to late arrhythmic events
(45).
REGIONAL WALL MOTION ABNORMALITY AND EJECTION FRACTION IN
RELATION TO QRS DURATION:
In the present study akinesia was reported from 14 patients (87.5%) of group B
(0.09 - 0.11 sec.), 4 patients (66.67%) of group C (> 0.11 see) and 24 patients (50%) of
group A « 0.09 see); hypokinesia was reported from 2 patients (12.5%) of group B, 2
patients of group C (33.33%) and 22 patients (46.0%) of group A. Hence, regional wall
motion abnormality was having a significant relationship with QRS duration. Increased
QRS duration had an increased incidence of akinesia in the present study (p< 0.001).
In the present study patients with ejection fraction of >50% in group A was
35.42% in group C 16.67%. None of the patients in Group B was having ejection fraction
of> 50%.
In a previous study by Brilakis et al (46) QRS duration> 100 msec on standard 12
In 27 out of 28 postmyocardial patients in whom left ventricular systolic
dysfunction (defined as ejection fraction of < 40%) developed; QRS duration increased
from 107±12 milliseconds to128±18 milliseconds.
Pudil et al (2001) (38) showed that a QRS of <0.09 sec on admission
electrocardiogram is indicative of a relatively benign outcome compared with a QRS of
>0.09 sec. Patients with intermediate QRS prolongation (0.09 - 0.11 sec.) also associated
with decreased ejection fraction and increased incidence of akinesia. Hence intermediate
QRS duration prolongation had also statistically significant relationship with ejection
fraction and RWMA in a similar way to significant QRS prolongation (> 0.11 sec.).
QRS DURATION AND KILLIP CLASS:
In the present study in group A (< 0.09 sec.) 71.4% (n=35) of patients were
belonging to Killip class I as compared to 12.5% in group C. Patients with Killip class>
II were 4% in group A, 62.5% in group C and 16.6% in group B. These results are
statistically significant (p< 0.05).
In the present study mean QRS duration of class I patient was 0.08±0.01 as
compared to 0.10 in Killip class IV. As Killip class of patient increases mean QRS
duration also increases.
Above observations go in agreement with previous study by Brilakis et at (2002)
(46) in which patients with QRS duration < 100 milliseconds to be in Killip class II, III or
IV at presentation. Patients with QRS duration < 100 milliseconds, percentage of patients
with Killip class> II was 16.7% against 32% in patients with QRS duration > 100
Michaelides et al (1993) (42) reported that exercise induced QRS prolongation
was proportional to the number of coronary arteries with > 70% stenosis. Mean QRS
prolongation was 4.8±7.5 milliseconds in patients with I-vessel disease, 7.8±11.8
milliseconds in patients with 2-vessel disease and 13.3±12.1 milliseconds in patients with
3-vessel disease. Study by Brilakis. et al (2002) (46) showed increased QRS duration was
strongly associated with heart failure as evidenced by worse Killip class.
MORTALITY IN RELATION TO QRS DURATION:
In the present study, out of the 75 patients 6 (8.0%) expired. One from group A
(2.0%), 3 from group B (16.67%), and 2 (25.0%) from group C. In the mortality group,
except one patient of AWMI rest of them expired before echocardiography could be
done. So correlation with ejection fraction and R/Q ratio was not possible; hence
mortality was analysed on the basis of QR5 duration. Analysis of present study data
shows that increased QRS duration had a significant statistical relationship with mortality
(p< 0.05).
QRS duration measured on a standard ECG remains a powerful predictor of
mortality after adjustment for ejection fraction and other clinical covariates. Data in a
large population of post infarction patients indicates that QRS of 0.12 seconds is
associated with hazard ratio of 1.7; p = 0.001. Above observations in the present study
i.e; highest mortality 25% in group C patients (QRS > 0.11 sec.) is in agreement with the
observations of Fadl et al (2003). (47)
QRS duration remains a very powerful predictor of future cardiac events in post