INTRODUCTION
A recent rise in Australia’s birth rate has generated speculation that the nation’s pop-ulation ageing ‘problem’ may have been resolved. To understand why this is not so it is necessary to understand the four tech-nical dimensions of the phenomenon. They are: numerical ageing (the absolute increase in the numbers of elderly), structural age-ing (the increasage-ing proportion of the population that is ‘old’), natural decline (which occurs if/when deaths exceed births) and absolute decline (which occurs if/when migration is insufficient to replace the ‘lost’ births and increased deaths). These remark-able trends, which are unfolding more or less inexorably, are outlined in more detail below—albeit succinctly, in order to pro-vide a potted overview of the situation.
We begin by locating the trends in the historical ‘moment’ in which they occur. Once this broader context is understood it is relatively easy to understand today’s demography, and approximately how it will unfold in the future. Demographers refer to this context as ‘The Demographic Transition’.
THE DEMOGRAPHIC TRANSITION: ALSO IN A NUTSHELL
The Demographic Transition refers to the global shift from high to low birth and death rates, and the one-off spurt in population
growth that accompanies the trends. Prior to the transition, which began in the devel-oped world in the mid-1700s, birth and death rates were high; they essentially can-celled each other out, resulting in zero or very low levels of population growth (ZPG). At the end of the transition, which is presently occurring in the developed world, birth and death rates are converg-ing at low levels, and ZPG is again on the horizon; many European countries are al-ready experiencing ZPG.
But, during the transition, population growth is explosive. This is because birth and death rates do not commence decline concurrently, nor at the same speed. If death rates—particularly infant and child death rates—decline first, which is precisely what happened in most developed countries (and also in most developing countries, where the transition began only in the mid to late 1900s), more babies live, and the population begins to grow. It also becomes ‘younger’, because a greater proportion of the population is young. When these additional babies and children become parents themselves, a few decades later, death rates have typically fallen further, and even more of their own children survive. The result is a compounding of population growth, driven not by rising birth rates, but by declining infant and child death rates.
It is this phenomenon, called transitional POPULATION AGEING IN A NUTSHELL: A PHENOMENON IN
FOUR DIMENSIONS
Natalie Jackson
growth, which caused the doubling of the world’s population in thirty years during the second half of the 20th Century, and created the subject matter for Paul Ehrlich’s famous book, The Population Bomb.1 By contrast, it is the subsequent shift to low birth rates that is causing the world’s population to become structurally ‘older’, because it is causing the proportion of the population at the younger ages to decrease—and concomitantly, the proportion at the older ages to increase.
Once a population contains more elderly than children, it is a short step to it experiencing more deaths than births, despite the fact that life expectancy continues to increase. An excess of deaths over births results in natural decline, the opposite of what has occurred for most of modern history. This structural cross over— the shift from natural increase to natural decline—is already the experience of many developed countries, and is expected to begin in most developing countries between the middle and end of the present century. Such a situation is confidently projected to cause the world’s population to stop growing and in all likelihood begin to decline in size, around the end of this century.2
Natural decline is expected to begin in Australia in the 2040s, even if net international migration can be sustained at around 110,000 per year.3 Seemingly paradoxically, the driver of this shift is not a decline in birth numbers,4 but rather, an increase in the number of deaths that will accompany the first dimension of the phenomenon of population ageing: numerical ageing.
NUMERICAL AGEING
Numerical ageing refers to the absolute increase in the numbers of elderly. The in-crease is primarily due to improvements in life expectancy. During the early stages of the demographic transition, the changes
drive a massive reduction in infant and child mortality and dramatically increase the probability of people surviving to old age. Since the 1980s, particularly in the devel-oped countries, equally significant gains have been seen at the upper middle and older ages.
The improvements of the past 80-odd years are now beginning to show in a sizeable increase in the numbers reaching old age. In the year 2000 a little over 2,000 Australians were aged 100 years and over; today (in 2007) there are over 6,000.
Numerical ageing is also 100 per cent guaranteed: those who will be 65+ in ten years time are already 55+; we know how many there are and the rate at which they die (and migrate). Current birth rates will have no effect on numerical ageing for 60– 70 years.
Reflecting this high degree of certainty there is minimal difference in the projected numbers of elderly between the Australian Bureau of Statistics (ABS) high, medium and low projection series. As Figure 1 shows, numerical ageing is also now beginning to escalate. Currently there are around 2.8 million Australians aged 65+ years. The annual increment is currently 73,000, but this will increase to 80,000 by 2009 and almost 140,000 by 2012—as the Baby Boomers (in Australia, born 1946– 65) enter this age group, following which it will remain above 130,000 for the following two decades. The trend is remarkably similar across Australia’s states, territories and local government areas; all that differs is its magnitude.
Surprising to many is that Australia was one of only four countries to experience a ‘true’ baby boom, the three others being New Zealand, Canada and the United States.5 Most other developed countries also experienced post war ‘spikes’, but all were relatively brief—no more than five or six years in length, and most involved somewhat lower peak birth rates than occurred in Australia and its three counterpart countries. The correlate is a more pronounced numerical ageing for these countries.
The existence of rising numbers of elderly is broadly recognised in the media and, for example, throughout the Intergenerational Report.6 However, because no formal distinction is made between the numerical and structural dimensions, no distinction is made between what is inevitable (numerical ageing) and now occurring very rapidly, and what is unfolding more slowly (structural ageing) and is at least potentially amenable to policy intervention.
STRUCTURAL AGEING
Structural ageing refers to the increase in the proportion of the population that is eld-erly. It is primarily caused by declining birth rates which decrease the proportion of the population that is young and there-by increase the proportion that is old.
Structural ageing began occurring across the developed world in the late 1800s, when birth rates first began to decline, but it was interrupted for the period of the baby boom. The additional babies born during the boom caused the population to grow younger during those years; the declining fertility rates since have caused it to grow older.
It is the fact that Australia’s fertility rates were higher than those of its European counterparts during the boom, remained high for longer, and have not fallen as low in the post-boom era, which primarily explains why Australia’s population today is somewhat ‘younger’ than its European counterparts, not migration. Over the longer term, migrants also grow old, adding
Source: ABS catalogue nos. 3101.0 and 3222.0
Figure 1: Numerical ageing Australia 1972–2021 (annual increment in numbers aged 65+ years
Series B Series A Observed
2020 2016 2012 2008 2004 2000 1996 1992 1988 1984 1980 1976 1972 0 20,000 40,000 60,000 80,000 100,000 120,000 140,000 160,000
to numerical ageing, and today tend to have low fertility, thereby adding to structural ageing at both ends of the equation.7
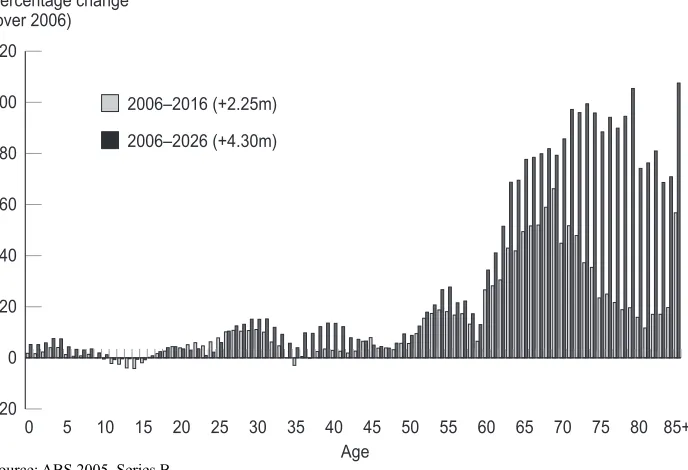
The extent to which structural ageing will continue and deepen is thus primarily dependent on what happens with the birth rate. Demographers around the world agree that it is unlikely that fertility will ever return to its baby boom levels (in Australia peaking at 3.6 births per woman in 1961). The conditions that facilitated that boom have changed fundamentally; it would take profound social change to see today’s women deliver an average of three births. The result, as indicated in Figure 2, is that while Australia’s population will grow by some 2.25 million by 2016 and 4.3 million by 2026, almost all of the growth will occur at the older ages. Between now and 2026, for example, numbers aged 65+ will increase by 87 per cent while all other age groups combined will increase by only 11
per cent. Suffice to say, the working age population will experience similar trends.8
BRINGING THE TWO DIMENSIONS TOGETHER
[image:4.468.62.406.367.602.2]Numerical and structural ageing thus have quite different causes—at least from a tech-nical perspective. A population will not age numerically if it has high death rates, nor structurally if it has high birth rates.9 How-ever, the two dimensions are, in reality, experienced together. In 2007 Australia’s baby boomers are aged 42–61 years. As they move through the age structure they will add to both the proportions and the numbers of elderly (see Figure 3). The high birth rates when they were born set in mo-tion a particularly large populamo-tion wave (and initially caused the population to be-come a little ‘younger’); improvements in life expectancy since have greatly added to the numbers that will reach old age. As
Figure 2: Projected per cent change in the Australian Population 2006–2016 and 2006–2026
Source: ABS 2005, Series B
-20 0 20 40 60 80 100 120
85+ 80 75 70 65 60 55 50 45 40 35 30 25 20 15 10 5 0
Percentage change (over 2006)
Age 2006–2016 (+2.25m)
elsewhere, the Boomers are followed by smaller cohorts (with the exception of the large baby boom ‘echo cohort’ born around 1970), meaning that Australia’s profound numerical ageing will be simultaneously experienced as structural ageing.
NATURAL DECLINE
Together, numerical and structural ageing usher in the third dimension of population ageing. Once a population contains more elderly than children it is a short step— approximately a decade—to it having more deaths than births, and to a situation of nat-ural decline, the reverse of what we have known for most of modern history.
A point of clarification is often needed when this dimension is outlined: if life expectancy is increasing, why is it that deaths will increase? The answer is simply a numbers game. Life expectancy has indeed increased, and is still doing so, but people cannot live forever—more elderly eventually means more deaths.
As Figure 4 indicates, natural decline is expected to occur in Australia before mid
century, but the shift will be driven by these increased numbers of deaths (from numerical ageing) rather than declining numbers of births. Notably this crossover occurs even with annual net migration gains of 110,000, which many people erroneously believe still add a disproportionate number of births to the population (as they did during the post-war era). As noted above, today’s migrants— especially skilled/long-term migrants, who now comprise two-thirds of Australia’s permanent and long-term migrants—tend to scarcely replace themselves.
Relatedly, but somewhat perversely, natural decline will occur much earlier in the nation’s older states, South Australia and Tasmania, which tend to lose their reproductive age populations via migration, and thus also the babies and children those people would have had, or have had but taken with them. Notably, natural decline is already extant in 7 per cent of Australia’s local government areas10, much of it similarly migration-driven.11
Figure 3: Age–sex structure of the Australian population 1976, 1996 and 2016>
Source: 1976, 1996: ABS Census of Population and Dwellings; 2016: ABS (2005) Catalogue 3222.0, medium variant, Series B
Notes: Shaded area = baby boomers, born 1946–65
0 5 10 15 20 25 30 35 40 45 50 55 60 65 70 75 80 85+
0.0 0.2 0.4 0.6 0.8 1.0 1.0 0.8 0.6 0.4 0.2
Age
Males Females
Percentage at each age
0 5 10 15 20 25 30 35 40 45 50 55 60 65 70 75 80 85+
1.0 0.8 0.6 0.4 0.2 0.0 0.2 0.4 0.6 0.8 1.0 Age
Males Females
Percentage at each age
0 5 10 15 20 25 30 35 40 45 50 55 60 65 70 75 80 85+
-1.0 -0.8 -0.6 -0.4 -0.2 0.0 0.2 0.4 0.6 0.8 1.0 Percentage at each age
Age
By contrast, conventional natural decline—that driven by low fertility per se—is already extant across the European continent, as well as in Japan, primarily as the result of those countries’ excessively low birth rates. Astoundingly the shift is anticipated to occur in populous China before Australia—the result of China’s One Child Policy.
ABSOLUTE DECLINE
Where there is insufficient migration to re-place the ‘lost’ births and increased deaths, as is expected in structurally old South Australia and Tasmania within a few dec-ades, we can expect those populations to enter absolute decline. At a national level this profound shift is not projected to be-gin before the end of present century, although this depends on annual net inter-national migration remaining around 110,000, and the birth rate remaining around 1.7. While the latter may be achiev-able (and indeed Australia’s birth rate has recently seen a small increase),
internation-al competition for migrants—particularly skilled migrants—is increasing, with those countries which previously sent migrants to Australia (that is, much of Europe) them-selves now seeking migrants and competing with Australia for them. Cur-rently, the potential supply of prospective migrants seems bottomless, with countries such as India expected to grow to some 1.5 billion by mid-century. However it is worth noting that a net gain of 110,000 is typical-ly achieved in Australia via an intake of 410,000 offsetting an outflow of 300,000. The extent to which Australia’s emigrants and immigrants are exact replacements for each other is questionable, and will almost certainly become a political issue as struc-tural ageing unfolds. From the point at which natural decline is encountered, growth can only come from migration, and those migrants will necessarily come from different cultural and ideological origins than previously.
[image:6.468.60.410.374.596.2]We can again look to our counterpart countries for evidence that absolute decline
Figure 4: Births and deaths Australia 1901–2051
Source: ABS catalogue nos. 3101.0 and 3222.0 (2005), Series B
0 50,000 100,000 150,000 200,000 250,000 300,000 350,000 400,000
2091
2001
1941 201 2021 2031 2041 2051 2071 2101
1
1991
1981
1971
1961
1951
1931
1921
191
1
1901
Number of births
Births
Deaths
Observed Projected
is something we will almost certainly have to contend with. The phenomenon has already begun in Eastern Europe, Germany and Japan, and is at Italy’s door. As indicated earlier, absolute population decline is also expected to begin at a global level during the 22nd Century. The fact that this coincides with its relatively late onset in Australia is a reflection of the latter’s expectation of a continuing high per capita ratio of migrants to its ‘stock’ population, and a relatively high (historically speaking) birth rate. Currently the two dynamics12 see Australia’s population growing at a rate a little above the global average (1.3 per cent per year compared with 1.2 per cent), and well above that for other developed countries (0.2 per cent per year). But the extent to which Australia’s disproportionate share of the migrant pool is likely to continue uncontested is debatable.
PREMATURE AGEING
[image:7.468.57.409.347.594.2]Further clarification of one issue referred to above—migration-driven population ageing—is important. A population can age for any or all of four reasons: low fertility, increased life expectancy, migration-driv-en gains at the older ages, and migration-driven losses at the younger ages. Because the latter tends to pertain to the reproductive age population, there is a dou-ble impact because of the loss of the children those people have taken with them and/or would have had. The trend has been termed ‘premature ageing’.13 If compound-ed by migration gains at older ages, structural ageing is even more accelerated. It is this form of ageing that is the primary reason for Tasmania’s status as Australia’s oldest region (as indicated by the median age).14 During the 1990s the state experienced a profound loss of people in the 18–38 year age group, and smaller
Figure 5: Age–Sex Structure Tasmania 1991 and 2006
Source: ABS Estimated Resident Population 1991 and 2006 1.0 0.8 0.6 0.4 0.2 0.0 0.2 0.4 0.6 0.8 1.0
Percentage at each age 0
5 10 15 20 25 30 35 40 45 50 55 60 65 70 75 80 85 90 95 100+ Age
Males Females
0 5 10 15 20 25 30 35 40 45 50 55 60 65 70 75 80 85 90 95 100+
1.0 0.8 0.6 0.4 0.2 0.0 0.2 0.4 0.6 0.8 1.0 Percentage at each age
Males Females
but equally significant gains at older ages. Although Tasmania’s net migration has been positive since 2002, the ‘bite’ in the age structure as a result of the age-specificity of its migrants remains profound (see Figure 5)—and will continue to have an impact on the state’s demography for decades to come. In fact Tasmania’s birth rate has recently risen and is presently close to replacement level (2.1); it is also the second highest in the country, falling just below that of the Northern Territory. Thus Tasmania’s birth rate is relatively high, but its migration-depleted numbers at the peak childbearing ages have their sequel in relatively low birth numbers. Notably almost half of Australia’s local government areas have similarly prematurely ageing age structures.15
By contrast, Australia’s other ‘elder’ state, South Australia, is ‘old’ primarily because of its historically lower birth rate
(currently 1.8). That state has also experienced significant net migration losses at the younger ages, but not to the same extent as has Tasmania (see Figure 6). As a result of these different drivers, South Australia has greater proportion aged 65+ years than does Tasmania (in 2006, 15.1 compared with 14.6 per cent) even though the two states now have virtually identical median ages (38.7 and 38.8 years respectively).16
IN SUM
[image:8.468.56.407.351.594.2]Understanding both the four dimensions of population ageing, and its local ‘driv-ers’, is critical for planning: a population that is ageing structurally because of the out-migration of its young will have sig-nificantly different labour market implications, resource needs and demo-graphic consequences (such as a potentially more rapid shift to natural and absolute
Figure 6: Age–Sex Structure South Australia 1991 and 2006
Source: ABS Estimated Resident Population 1991 and 2006 0
5 10 15 20 25 30 35 40 45 50 55 60 65 70 75 80 85 90 95 100+
1.0 0.8 0.6 0.4 0.2 0.0 0.2 0.4 0.6 0.8 1.0 Percentage at each age
Males Females
Age
1.0 0.8 0.6 0.4 0.2 0
5 10 15 20 25 30 35 40 45 50 55 60 65 70 75 80 85 90 95 100+
0.0 0.2 0.4 0.6 0.8 1.0 Percentage at each age
Males Females
References
1 P. Ehrlich, The Population Bomb, Ballantyne, New York, 1968
2 W. Lutz, W. Sanderson and S. Sherbov (eds), The End of World Population Growth in the 21st Century: New
Challenges for Human Capital Formation and Sustainable Development, The International Institute for Applied Systems, Analysis/Earthscan, London and Sterling, VA, 2004. Note that one factor not discussed in the present paper is the ‘momentum effect’. The momentum effect refers to the growth potential that remains in an age structure for 3–4 decades after the birth rate has fallen below the level required to replace the population (2.1 births per woman). It is this factor that will generate most of the remaining growth in the world’s population, taking it to a peak of around 9 billion around the end of the present century
3 Australian Bureau of Statistics, Population Projections, Australia, 2004–2100, Catalogue no. 3222.0, 2005.
This outcome also assumes the total fertility rate (TFR) falling from its present 1.8 to 1.7 by 2018 and remaining constant thereafter.
4 A decline in Australia’s TFR to 1.7 would actually see birth numbers increase. Birth numbers are the combined
effect of the birth rate per woman and the number of women at reproductive age, and the above projections assume that the latter will increase slightly.
5 M.S. Teitelbaum and J.M. Winter, The Fear of Population Decline, Orlando, Academic Press, Inc., 1985. In
fact Australia’s peak fertility was the lowest of these four countries (New Zealand had the highest peak, with a TFR of 4.2), but the group is clearly distinguishable from other countries in terms of the length of their booms (pp. 68).
6 Australian Government, Intergenerational Report 2002–03, Budget Paper No. 5. Department of the Treasury,
Canberra, 2002, <http://www.dfat.gov.au/budget/2002-03/bp5/html/01_BP5Prelim.html>
7 R. Kippen and P. McDonald ‘Can increased immigration be a substitute for low fertility?’, People and Place,
vol. 12, no. 3, 2004, pp. 18–27
decline) to one which is ageing structural-ly because of low fertility and/or numerically because of the in-migration of elderly.
So too it is important to understand that while Australia’s structural ageing is occurring later and is currently somewhat less pronounced than in many of its counterpart countries—primarily because of the length of its baby boom and the fact that its post-boom fertility rates have not fallen as low as elsewhere—its numerical ageing will be exceptional among all but New Zealand, Canada and the United States.
Relatedly it must be understood that a rise in the birth rate will have no effect on numerical ageing for the next 60–70 years. Pronouncements which argue that the impact of ‘population ageing’ is still a decade or so away, and may be slowed by increased fertility or migration, are referring to structural ageing only, and deflect attention away from its quietly escalating numerical analogue.
KEY POINTS FOR PRACTITIONERS
• The primary cause of the current increase in the numbers of elderly (numerical ageing) is increasing life expectancy.
• At the same time, low/declining birth rates since the end of the baby boom (1965) are driving an increase in the proportion of the population to be found at older ages (structural ageing). • Numerical and structural ageing thus occur independently of each other; have different causes and different implications. However they will come together as the baby boomers age. • Once a population contains more
elderly than children it is a short step to it having more deaths than births, and shifting from a long term situation of natural increase to one of natural decline.
8 As a proportion, those aged 65+ will similarly increase by 56 per cent (from 13 to 21 per cent), while those
aged 0–64 years will decline by 9 per cent (from 87 to 79 per cent)
9 During the baby boom, for example, the numbers of elderly grew, but as a proportion of the population they
declined. Theoretically at least, an increase in the elderly death rate could see the numbers of elderly decline, but as a proportion they could grow if fertility also declined.
10 Australian Bureau of Statistics (ABS), Deaths 2005, Australia, Catalogue no. 3302.0, 2006
11 N.O. Jackson, ‘Regional population ageing and local government funding: A tentative consideration of the
issues’, Australasian Journal of Regional Studies, vol. 10, no. 1, 2004, pp. 77–103
12 with high life expectancy of course.
13 N.O Jackson and R. Kippen, ‘Whither Tasmania? A note on Tasmania’s population ‘problem’’, People and
Place, vol. 9, no. 1, 2001, pp. 27–37
14 Australian Bureau of Statistics, Australian Demographic Statistics 2006 Census Edition: Preliminary,
catalogue no. 3101.0, 2007, p. 8
15 Jackson, 2004, op cit.