Chun Meng Tang and Adrian Bradshaw
James Cook University Singapore, Singapore
[email protected]
[email protected]
Abstract: Teamwork is essential to the successful completion of group tasks, and is therefore usually highlighted by universities as a desirable graduate attribute. To encourage the development of good teamwork skills among students, many university courses incorporate team assignments. In a conventional learning environment, students meet face-to-face in the classroom or somewhere on campus to complete their team assignments. However, it is interesting to note that today’s students prefer instead to have discussions or to collaborate using digital media. Today’s students use such digital communication media as email, text messaging, video chat, etc. to collaborate with team members in the process of completing their team assignments. As the students are familiar with and use some of these digital communication media in their everyday activities, it is quite possible that they also find them convenient and easy to use for academic work purposes. According to Nowak, Watt, and Walther’s (2005, 2009) efficiency framework, people tend to select communication media that they consider more effective in achieving certain objectives and those that require less cognitive and behavioural effort, and less time. However, is it true that digital communication media indeed help users to achieve greater team effectiveness, or is it just a perception myth? This study attempted to examine, when university students used text messaging for team collaboration purposes, if text messaging affected their copresence (modelled as a second-order formative construct which consists of two subconstructs: self copresence and partner copresence), media satisfaction, and perceived team effectiveness. This study conducted a questionnaire survey to collect responses from students who had been involved in team projects, and performed a partial least squares analysis of the responses. The findings show that copresence had a significant relationship with media satisfaction; media satisfaction had a significant relationship with perceived team effectiveness; and media satisfaction had a partial mediating effect between copresence and team effectiveness. This study could help explain why students may choose text messaging to facilitate team collaborative learning.
Keywords: collaborative learning, copresence, digital communication media, efficiency framework, media satisfaction, team effectiveness
1. Introduction
Technology, especially mobile devices such as smart phones and tablets, have impacted many aspects of our lives, particularly in the areas of communication and collaboration. Modern digital communication media allow us to be connected anywhere and anytime. According to Statistica.com (2016), in the month of April 2016, there were 1,000 million active users of WhatsApp, 900 million active users of Facebook Messenger, and 853 million active users of QQ Mobile.
Given the popularity of digital communication media (e.g. WhatsApp, Facebook Messenger and QQ Mobile), it is possible that students may find them convenient, and thus use them in teamwork and collaboration for completing assignments. In light of this, this study investigates why students may choose text messaging to facilitate team collaborative learning.
2. Research background
2.1 Communication media
Communication is vital to team collaboration; in order for teams to work effectively, there must be clear communication among team members. The study of communication has long championed the idea that the best communication occurs over channels that are rich, like face-to-face communication (Behring and Xu, 2014; Okdie et al., 2011). However, with the prevalence of digital communication media, there are now more ways to communicate and facilitate team collaboration. Apart from direct face-to-face communication, video chat and text messaging also provide alternative ways to collaborate.
media not only require more communicative effort from the users to process information, users also need to learn to adapt their communication behaviours to these media accordingly. On the one hand, the extra effort may result in less satisfaction with low-cue communication media. On the other hand, the extra effort may help enhance the levels of copresence (i.e. the users perceive that they and their partners have all contributed meaningfully to the group) and group effectiveness; and if the users work together toward some common interaction goals, they can achieve successful interaction outcomes. It is interesting to note that despite the users being satisfied with their preference for a particular communication medium, it does not necessarily result in a successful interaction outcome (Walther, 2011).
2.2 Nowak, Watt, and Walther’s efficiency framework
Nowak, Watt, and Walther (2009) proposed the efficiency framework to depict the relationships among the constructs copresence (consisting of self copresence and partner copresence), perceived group effectiveness, media satisfaction, and outcome success. To test their hypotheses, they conducted a study in which university students used face-to-face communication or one of the four computer-mediated communication media (i.e. synchronous high-cue, synchronous low-cue, asynchronous low-cue, and asynchronous high-cue) when working in groups. Their findings showed that communication media that were synchronous or had fewer cues contributed to higher levels of copresence (but they did not find the same support for greater group effectiveness). Face-to-face communication as well as communication media that were synchronous or had more cues resulted in higher levels of media satisfaction.
2.3 Research model
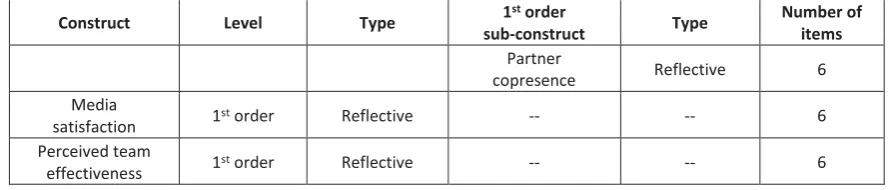
With reference to Nowak, Watt, and Walther’s (2009) efficiency framework, this study proposed a research model (Figure 1) to examine the effect of copresence on media satisfaction and perceived team effectiveness in a situation where university students used text messaging as their primary medium of communication for team collaboration purposes. In this study, copresence was conceptualised as a second-order formative construct (consisting of two first-order reflective constructs: self copresence and partner copresence) (MacKenzie, Podsakoff and Jarvis, 2005). Supposing that students who were satisfied with their use of text messaging would perceive team effectiveness to be better, it was hypothesised that a higher level of copresence would contribute to a higher level of media satisfaction (H1), which would eventually result in a higher perceived level of team effectiveness (H2).
Figure 1: Research model
3. Research method
3.1 Construct operationalisation
To operationalise the constructs, some scale items were adapted from Nowak, Watt, and Walther (2009) and some new ones were developed. Table 1 presents a summary of the operationalisation of the constructs. Table 1: Operationalisation of the constructs
Construct Level Type 1
st order
sub-construct Type
Number of items
Copresence 2nd order Formative Self
Construct Level Type 1 st order
sub-construct Type
Number of items Partner
copresence Reflective 6
Media
satisfaction 1
st order Reflective -- -- 6
Perceived team effectiveness 1
st order Reflective -- -- 6
3.2 Data collection
An online questionnaire was used to collect responses from the students who had been involved in team projects at a local university. Section A asked three questions about their digital media usage. Section B asked four questions in relation to the constructs. All items were measured using a 5-point Likert-type scale, 5 being “strongly agree” and 1 being “strongly disagree.” Section C asked one demographic question. As the focus of this study was on the use of text messaging for team collaboration purposes, only the students who used text messaging (e.g. WhatsApp, LINE, WeChat, etc.) as their primary medium of communication when working in teams on a class project were included in the data analysis. A total of 51 respondents provided the responses. One response was removed as an outlier for not meeting the Mahalanobis distance criterion (Tabachnick and Fidell, 2007). As a result, only 50 responses were included for subsequent analyses.
4. Data analysis and results
[image:3.595.74.519.73.168.2]4.1 Text messaging usage
[image:3.595.86.504.426.511.2]Table 2 presents the frequency of the teams using text messaging as a primary medium of communication for team collaboration purposes. 11 respondents reported a frequency of 1 to 2 times in a week (22%); 16 respondents 3 to 4 times (32%); ten respondents 5 to 6 times (20%); one respondent 7 to 8 times (2%); one respondent 9 to 10 times (2%); and 11 respondents more than 10 times (22%).
Table 2: Usage of text messaging for team collaboration purposes
N %
Frequency of the teams using text messaging for team collaboration
purposes in a week
1 to 2 times 11 22.0
3 to 4 times 16 32.0
5 to 6 times 10 20.0
7 to 8 times 1 2.0
9 to10 times 1 2.0
More than 10 times 11 22.0
Table 3 presents a summary of the reasons the teams chose to use text messaging for team collaboration purposes. In terms of percentage, the top three reasons were: “it made communication easy” (64%); “it made communication convenient” (60%); and “it made communication quick” (56%).
Table 3: Reasons to use text messaging for team collaboration purposes
N %
Reasons to use text messaging for team collaboration purposes
It made communication easy. 32 64.0 It made communication convenient. 30 60.0 It made communication quick 28 56.0 It allowed talking to many people at
the same time. 26 52.0
It allowed communication at any
location. 25 50.0
It made communication effective. 16 32.0 It made communication real time. 10 20.0 It costed minimal to communicate. 9 18.0
Table 4: Challenges in using text messaging for team collaboration purposes
N %
Challenges in using text messaging for team collaboration purposes
Responses were not immediate. 26 52.0 There was less face-to-face
interaction. 25 50.0
There was a lack of non-verbal
communication. 10 20.0
There was too little communication. 9 18.0 There were miscommunications. 8 16.0 It was difficult to understand what
was communicated. 7 14.0
There were psychical meeting
constraints. 6 12.0
There was too much communication. 4 8.0
4.2 Confirmatory factor analysis
This study used the SmartPLS software to perform a confirmatory factor analysis (CFA). Following the two-step approach as recommended by Gerbing and Anderson (1988), the measurement model was first assessed, followed by the structural model. The measurement model was assessed for internal consistency reliability, convergent validity, and discriminant validity. The structural model was assessed for significance of path coefficients and R2 (Hair et al., 2014).
To assess the higher-order reflective-formative model (i.e. the two first-order reflective constructs form the second-order formative construct), this study followed the suggestion by Hair et al. (2014). First, latent variable scores of the two first-order reflective constructs were obtained using the repeated indicator approach. Then, the latent variable scores were used as the indicators of the second-order formative construct.
4.2.1 Measurement model
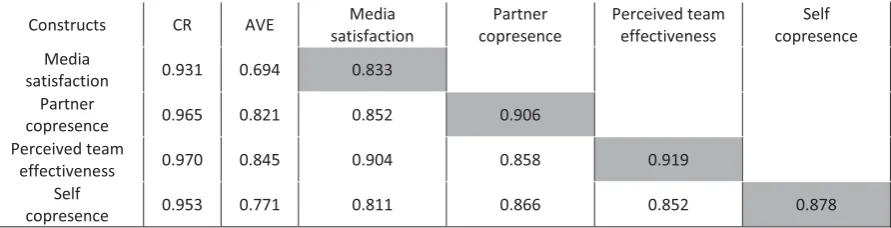
[image:4.595.77.523.491.605.2]Internal consistency reliability - For satisfactory internal consistency reliability, composite reliability of individual reflective constructs should be above 0.7 (Fornell and Larcker, 1981; Gefen and Straub, 2005). Table 5 presents a summary of CRs, AVEs, and correlations of the first-order reflective constructs. It was evident that these constructs showed good internal consistency reliability (CR>0.7).
Table 5: CRs, AVEs, and correlations of first-order reflective constructs
Constructs CR AVE Media satisfaction
Partner copresence
Perceived team effectiveness
Self copresence Media
satisfaction 0.931 0.694 0.833
Partner
copresence 0.965 0.821 0.852 0.906
Perceived team
effectiveness 0.970 0.845 0.904 0.858 0.919
Self
copresence 0.953 0.771 0.811 0.866 0.852 0.878
Note: CR: composite reliability; AVE: average variance extracted; square roots of average variances extracted (AVE) are shown on diagonal; correlations between constructs are shown on off-diagonal.
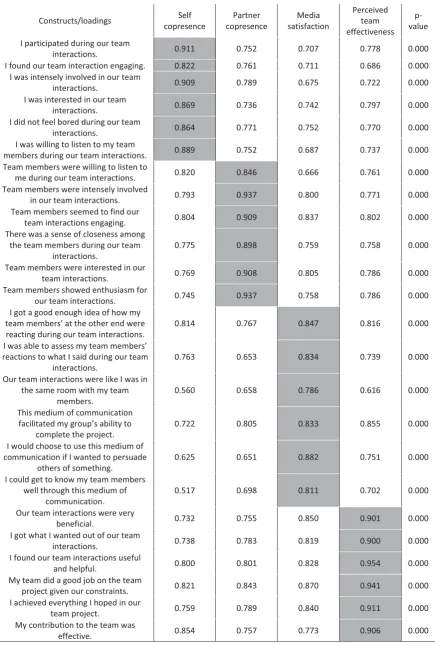
Convergent validity - For satisfactory convergent validity, loading of individual indicators should be above 0.7 to be statistically significant and the average variance extracted (AVE) of individual constructs should be above 0.5 (Fornell and Larcker, 1981; Gefen and Straub, 2005). Table 5 shows that the AVEs of the constructs were above 0.5. Table 6 provides evidence of high indicator reliability, as the loadings of individual constructs were above 0.7 (and were statistically significant at 0.000).
0.7 on their intended constructs. Table 5 shows that all the constructs except media satisfaction met the Fornell-Larcker criterion.
Table 6: Factor loadings and cross loadings of first-order reflective constructs
Constructs/loadings Self copresence Partner copresence Media satisfaction Perceived team effectiveness p-value
I participated during our team
interactions. 0.911 0.752 0.707 0.778 0.000
I found our team interaction engaging. 0.822 0.761 0.711 0.686 0.000 I was intensely involved in our team
interactions. 0.909 0.789 0.675 0.722 0.000
I was interested in our team
interactions. 0.869 0.736 0.742 0.797 0.000
I did not feel bored during our team
interactions. 0.864 0.771 0.752 0.770 0.000
I was willing to listen to my team
members during our team interactions. 0.889 0.752 0.687 0.737 0.000 Team members were willing to listen to
me during our team interactions. 0.820 0.846 0.666 0.761 0.000 Team members were intensely involved
in our team interactions. 0.793 0.937 0.800 0.771 0.000 Team members seemed to find our
team interactions engaging. 0.804 0.909 0.837 0.802 0.000 There was a sense of closeness among
the team members during our team interactions.
0.775 0.898 0.759 0.758 0.000
Team members were interested in our
team interactions. 0.769 0.908 0.805 0.786 0.000
Team members showed enthusiasm for
our team interactions. 0.745 0.937 0.758 0.786 0.000 I got a good enough idea of how my
team members’ at the other end were reacting during our team interactions.
0.814 0.767 0.847 0.816 0.000
I was able to assess my team members’ reactions to what I said during our team
interactions.
0.763 0.653 0.834 0.739 0.000
Our team interactions were like I was in the same room with my team
members.
0.560 0.658 0.786 0.616 0.000
This medium of communication facilitated my group’s ability to
complete the project.
0.722 0.805 0.833 0.855 0.000
I would choose to use this medium of communication if I wanted to persuade
others of something.
0.625 0.651 0.882 0.751 0.000
I could get to know my team members well through this medium of
communication.
0.517 0.698 0.811 0.702 0.000
Our team interactions were very
beneficial. 0.732 0.755 0.850 0.901 0.000
I got what I wanted out of our team
interactions. 0.738 0.783 0.819 0.900 0.000
I found our team interactions useful
and helpful. 0.800 0.801 0.828 0.954 0.000
My team did a good job on the team
project given our constraints. 0.821 0.843 0.870 0.941 0.000 I achieved everything I hoped in our
team project. 0.759 0.789 0.840 0.911 0.000
My contribution to the team was
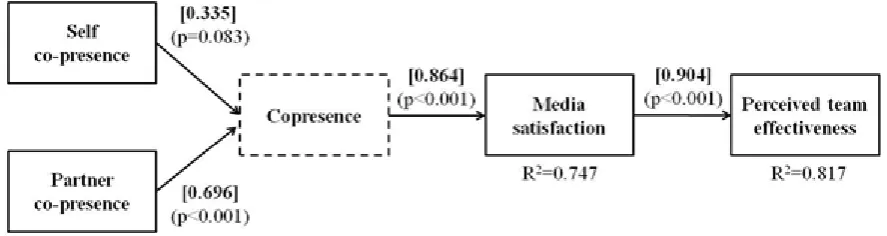
Second-order Formative Construct - Using the latent variable scores of the two first-order reflective constructs (self copresence and partner copresence) as the indicators of the second-order formative construct (copresence), the outer weights of the indicators were assessed. The weight of the indicators indicated their relative contribution to the formative construct. The weight of partner copresence was 0.696 (p=0.001) and that of self copresence was 0.335 (p=0.083). Although the weight of self copresence was not statistically significant at 0.05 level (it was at 0.1 level though), its loading was above 0.5 (p=0.000). As suggested by Hair et al. (2014), if the outer weight of an indicator is not significant, its outer loading should then be assessed. If the outer loading is above 0.5 and statistically significant, the indicator can be retained for its absolute importance. To assess if there were collinearity issues, the variance inflation factor (VIF) and tolerance level of each indicator were calculated. The VIF of both indicators were below 5.0 (3.996 for both) and the tolerance level was above 0.2 (0.25 for both). Thus, collinearity problems did not exist.
4.2.2 Structural model
The structural model was examined next. A bootstrapping procedure of 1,000 sub-samples was used to calculate t-statistics of the path coefficients between the constructs (Gefen, Straub and Boudreau, 2000). Figure 2 shows that the copresence construct had a significant relationship with the media satisfaction construct and explained about 74.7% of its variance (R2=0.747). Media satisfaction had a significant relationship with perceived team
effectiveness and explained about 81.7% of its variance (R2=0.817).
[image:6.595.78.522.391.509.2]To assess if media satisfaction had a mediating effect between copresence and team effectiveness, the direct effect and indirect effect (both were statistically significant) were first calculated. The variance accounted for (VAF) was then calculated to determine the size of the indirect effect in relation to the total effect. If VAF is below 0.2, there is no mediation; between 0.2 and 0.8, partial mediation; and above 0.8, full mediation (Hair et al., 2014). Results showed that media satisfaction had a partial mediating effect (VAF=0.469), i.e. about 46.9% of copresence’s effect on team satisfaction was explained by media satisfaction.
Figure 2: Structural model
5. Discussion and conclusions
The findings of this study show that copresence had a positive significant relationship with media satisfaction. This supports the hypothesis (H1) that copresence would contribute positively to media satisfaction. In real terms this relationship indicates that when team members have high copresence, they tend to be satisfied with their choice of digital communication medium. Given that the choice of digital communication medium in this study was text messaging, the findings show that the students may believe that text messaging allows them to contribute meaningfully to the team and therefore they perceive the team to be effective.
The findings of the study also show that media satisfaction had a positive significant relationship with perceived team effectiveness. This supports the hypothesis (H2) that media satisfaction would result in a perception of team effectiveness. The relationship between media satisfaction and the perception of team effectiveness indicates that once the team is satisfied with the choice of digital communication medium, they will believe that the team operated effectively.
effort, they will perceive that the team as a whole was effective. However, what is worth noting is that media satisfaction had a partial mediating effect between copresence and team effectiveness. This implies that satisfaction with the communication medium helps explain the perception that the team is effective.
Overall, the result of this study highlights that the choice of digital communication medium is an important consideration for students working in teams. High copresence of team members can contribute to students’ satisfaction with the digital communication medium. However, it is worth pointing out, as Nowak, Watt, and Walther (2009) noted, that despite the students being satisfied with their preference for a particular communication medium, it does not necessarily result in a successful outcome.
Whilst the outcome of the team assignment was not captured in this study, it is reasonable to assume that text messaging could have severe limitations as a communication medium for team assignments. One obvious limitation is the restricted amount of information that can be communicated at a time as well as the propensity for miscommunication. Thus, when working in teams on projects, teams should note such limitation when relying primarily on the use of text messaging for team collaboration purposes. Despite these obvious limitations, the teams in the study were quite satisfied with the use of text messaging and perceived that the teams were effective
5.1 Research limitations
Three research limitations should be highlighted. First, this study did not assess the relationship between perceived team effectiveness and project outcome, e.g. grades. Second, this study only focused on text messaging and did not include other digital communication media for comparison. Third, this study could not isolate the effect of text messaging when other digital communication media were also used by the same team to supplement team collaboration.
5.2 Future research directions
To further our understanding in the use of digital communication media for team collaboration purposes, four future research directions can be considered: (1) To examine and compare groups of synchronous, asynchronous, low-cue, and high cue digital communication media, e.g. Facebook, video chat, voice call, etc.; (2) To examine the use of digital communication media in business for team collaboration purposes, e.g. project management; (3) To expand the research model to include a construct to measure project outcome, e.g. grade obtained for a team project, team performance on meeting different project criteria, etc.; and (4) To examine and compare the use of face-to-face communication and other digital communication media in different countries or cultural settings.
References
Behring, D.M. and Xu, Q. (2014). “The Richer the Better? Effects of Modality on Intercultural Communication”,
International Journal of Communication, Vol. 8, pp. 2733-2754.
Fornell, C. and Larcker, D.F. (1981) “Structural Equation Models with Unobservable Variables and Measurement Error: Algebra and Statistics”, Journal of Marketing Research, Vol. 18, No. 3, pp. 382-388.
Gefen, D. and Straub, D. (2005) “A Practical Guide to Factorial Validity Using PLS-Graph: Tutorial and Annotated Example”,
Communications of the Association for Information Systems, Vol. 16, No. 5, pp. 91-109.
Gefen, D., Straub, D.W. and Boudreau, M. (2000) “Structural Equation Modeling and Regression: Guidelines for Research Practice”, Communications of the Association for Information Systems, Vol. 4, No. 7, pp. 1-77.
Gerbing, D.W. and Anderson, J.C.B. (1988) “An Updated Paradigm for Scale Development Incorporating Unidimensionality and Its Assessment”, Journal of Marketing Research, Vol. 25, No. 2, pp. 186-192.
Gilster, P. (1997) Digital literacy, Wiley, New York.
Hair, J.F., Hult, G.T.M., Ringle, C.M. and Sarstedt, M. (2014). A Primer on Partial Least Squares Structural Equation Modeling, Sage, Thousand Oaks.
MacKenzie, S.B., Podsakoff, P.M. and Jarvis, C.B. (2005) “The Problem of Measurement Model Misspecification in Behavioral and Organisational Research and Some Recommended Solutions”, Journal of Applied Psychology, Vol. 90, No. 4, pp. 710-730.
Nowak, K., Watt, J.H. and Walther, J.B. (2009). “Computer Mediated Teamwork and the Efficiency Framework: Exploring the Influence of Synchrony and Cues on Media Satisfaction and Outcome Success”, Computers in Human Behavior, Vol. 25, pp. 1108-1119.
Statista.com (2016) Most Popular Global Mobile Messenger Apps as of April 2016, based on Number of Monthly Active Users (in Millions). [online] Available at: http://www.statista.com/statistics/258749/most-popular-global-mobile-messenger-apps/ [Accessed 8 July 2016].
Tabachnick, B.G. and Fidell, L.S. (2006) Using Multivariate Statistics (5th ed.), Pearson, Boston.