Prevalence of foot disease and risk
factors in general inpatient populations:
a systematic review and meta-analysis
Peter A Lazzarini,1,2,3,4Sheree E Hurn,1,2Malindu E Fernando,5,6Scott D Jen,7 Suzanne S Kuys,3,8Maarten C Kamp,1Lloyd F Reed1,2
To cite:Lazzarini PA, Hurn SE, Fernando ME,et al. Prevalence of foot disease and risk factors in general inpatient populations: a systematic review and meta-analysis.BMJ Open2015;5: e008544. doi:10.1136/ bmjopen-2015-008544
▸ Prepublication history and additional material is available. To view please visit the journal (http://dx.doi.org/ 10.1136/bmjopen-2015-008544).
Received 21 April 2015 Revised 7 September 2015 Accepted 21 October 2015
For numbered affiliations see end of article.
Correspondence to Peter A Lazzarini; [email protected]. gov.au
ABSTRACT
Objective:To systematically review studies reporting the prevalence in general adult inpatient populations of foot disease disorders (foot wounds, foot infections, collective‘foot disease’) and risk factors ( peripheral arterial disease (PAD), peripheral neuropathy (PN), foot deformity).
Methods:A systematic review of studies published between 1980 and 2013 was undertaken using electronic databases (MEDLINE, EMBASE and CINAHL). Keywords and synonyms relating to prevalence, inpatients, foot disease disorders and risk factors were used. Studies reporting foot disease or risk factor prevalence data in general inpatient populations were included. Included study’s reference lists and citations were searched and experts consulted to identify additional relevant studies. 2 authors, blinded to each other, assessed the methodological quality of included studies. Applicable data were extracted by 1 author and checked by a second author. Prevalence proportions and SEs were calculated for all included studies. Pooled prevalence estimates were calculated using random-effects models where 3 eligible studies were available.
Results:Of the 4972 studies initially identified, 78 studies reporting 84 different cohorts (total
60 231 517 participants) were included. Foot disease prevalence included: foot wounds 0.01–13.5% (70 cohorts), foot infections 0.05–6.4% (7 cohorts), collective foot disease 0.2–11.9% (12 cohorts). Risk factor prevalence included: PAD 0.01–36.0% (10 cohorts), PN 0.003–2.8% (6 cohorts), foot deformity was not reported. Pooled prevalence estimates were only able to be calculated for pressure ulcer-related foot wounds 4.6% (95% CI 3.7% to 5.4%)), diabetes-related foot wounds 2.4% (1.5% to 3.4%),
diabetes-related foot infections 3.4% (0.2% to 6.5%), diabetes-related foot disease 4.7% (0.3% to 9.2%). Heterogeneity was high in all pooled estimates (I2=94.2
–97.8%, p<0.001).
Conclusions:This review found high heterogeneity, yet suggests foot disease was present in 1 in every 20 inpatients and a major risk factor in 1 in 3 inpatients. These findings are likely an underestimate and more robust studies are required to provide more precise estimates.
INTRODUCTION
Foot disease is a common result of the
patho-physiology of chronic conditions.1–6 Foot
disease disorders have been reported to be
present in significant numbers of people
hos-pitalised throughout the world.1–6 The
pres-ence of foot disease disorders in those hospitalised has also been associated with extended hospital stays,1–5amputations,1–3 6–9
institutionalisation,10 11 high mortality
rates1 2 7 12 and significant ongoing
health-care needs.1 2 6 13 14
Foot disease is a term typically used to denote severe foot-related disorders that are likely to result in hospitalisation and amputa-tion and most commonly refers to foot
wounds and foot infections.1 2 12–14However,
‘foot disease’ is also commonly used as a
catchall term that collectively includes foot
wounds, foot infection and other less
common severe foot-related disorders, such as critical ischaemia, and Charcot neuroar-thropathy.1 2 12–14 The major risk factors for
foot disease include peripheral arterial
disease (PAD), peripheral neuropathy (PN) and foot deformity.1 2 5 6 12–16However, these risk factors can also become foot disease
Strengths and limitations of this study
▪ This is the first systematic review and meta-analysis to investigate the prevalence of foot disease in general inpatient populations.
▪ A broad search strategy was used to minimise the risk of missing relevant studies.
▪ One author extracted data; however, this was checked by a second author.
▪ Studies reporting foot disease and risk factor prevalence in inpatient populations had high het-erogeneity and thus pooled estimates should be interpreted with caution.
▪ Very few studies reported foot disease or risk factor data as the primary study outcome and most are likely to have under-reported.
Lazzarini PA,et al.BMJ Open2015;5:e008544. doi:10.1136/bmjopen-2015-008544 1
Open Access Research
group.bmj.com on June 8, 2016 - Published by
disorders if severe and result in hospitalisation or ampu-tation.1 2 5 6 12–16 Foot disease disorders and risk factors typically result from chronic conditions,3 5–9such as dia-betes,1 2 7–9 11–14 cardiovascular disease,10 17–19 chronic kidney disease6 15 20and cancer.7 8 21
Studies investigating the presence of foot disease in hospital inpatients have predominantly focused within discrete inpatient populations, such as only geriatric or
patients with diabetes.1 2 5 11 14 20 22 23 Fewer studies
have reported the prevalence of foot disease across more representative general inpatient populations that include the diverse range of people typically hospitalised
at any one time.4 24Thus, precise estimates of the
preva-lence of foot disease in general inpatient populations
are unknown.4 24 Furthermore, there have been no
known systematic reviews investigating the prevalence of foot disease in inpatient populations. In order for clini-cians, researchers and policymakers to begin to quantify, understand and address the burden that foot disease imposes on inpatient care, it seems necessary to deter-mine the foot disease prevalence in general inpatient populations rather than discrete segments of the inpatient population.
The primary aim of this study was to systematically review all studies reporting the prevalence in general adult inpatient populations of foot disease disorders
(foot wounds, foot infections and collective ‘foot
disease’) and risk factors (PAD, PN and foot deformity).
Secondary aims were to determine the pooled preva-lence estimates for each foot disease disorder and risk factor, and investigate the prevalence of amputations from included studies.
METHODS
The authors have adhered to the PRISMA guideline reporting checklist (see online supplementary table S1)
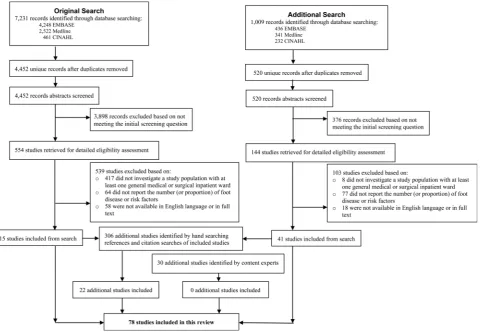
and PRISMAflow diagram (seefigure 1).25
Search strategy
Electronic databases (MEDLINE, EMBASE and
CINAHL) were systematically searched by the first
author (PAL) for all studies published between 1980 and 2013 reporting the prevalence of foot disease disor-ders or risk factors in an inpatient population. The year 1980 was chosen due to the advent of validated outcome measures to investigate foot disease disorders at this
time.26 27 The search strategy included broad keywords
[image:2.595.62.546.394.726.2]and synonyms combining the anatomical area (eg, foot); disease (eg, wounds, infection) or risk factors (eg, PAD, PN); populations (eg, inpatients); and epidemiological terms (eg, prevalence) of interest. See online supple-mentary table S2 for the full search syntax with trunca-tion used for the electronic database search.
Figure 1 Search strategy and study selection results.
2 Lazzarini PA,et al.BMJ Open2015;5:e008544. doi:10.1136/bmjopen-2015-008544
Open Access
group.bmj.com on June 8, 2016 - Published by
Study selection
All unique study abstracts identified were screened by
thefirst author (PAL) using an overarching initial
screen-ing question:Does the article appear to discuss original fi nd-ings on the prevalence of foot disease or risk factors within adult populations staying overnight in a hospital?The full text was sought if it appeared to address the screening question.
A detailed eligibility assessment was then undertaken
by the first author (PAL) for final inclusion. Studies
were eligible for inclusion if they met all of the below inclusion criteria and did not meet any exclusion cri-teria. Inclusion criteria were studies:
▸ Indexed in the aforementioned electronic databases;
▸ Published in peer-reviewed academic journals;
▸ Available in full text;
▸ Written in the English language;
▸ Reporting a study population representative of a
general adult inpatient population. General adult
inpatient populations were defined as reporting all
eligible participants from at least one general medical or surgical hospital inpatient ward; and
▸ Reporting the number, or proportion, of a foot
disease disorder or risk factor. Foot disease disorders
(foot wound, foot infection or collective ‘foot
disease’) and risk factors (PAD, PN or foot deformity)
were defined as listing of the foot disease disorder or
risk factor concerned (or a synonym) in the study.
Thus, no specific diagnostic criteria were used and
reporting could have been elicited from a range of self-report, medical record audit or clinical
examin-ation methods.‘Foot disease’ was defined as the
col-lective reporting of foot wounds, foot infections and other severe foot-related disorders together.
However, studies were excluded if they met any of the following exclusion criteria:
▸ Studies reporting designs that were primarily case
studies, literature reviews, case–control, validity or
reliability studies; and
▸ Studies reporting a study population that was not
defined as representative of a general adult hospital
inpatient population; including studies investigating primarily children (<18 years), outpatients, geriatric inpatients (>65 years), long-term care inpatients or discrete condition-related inpatients (such as only patients with diabetes).
At completion of the search strategy and study
selec-tion, thefirst author (PAL) hand searched the reference
lists of all included studies and citation searched
(Scopus) all studies citing the included studies.
Following this process it became apparent that all
rele-vant studies had been identified, with the notable
excep-tion of pressure ulcers on very specific anatomical
locations of the foot, such as the heel or ankle. Thus, an additional search was conducted for all studies reporting only the prevalence of pressure ulcers in inpatient popu-lations using a similar search strategy (see online supple-mentary table S2). The hand searching of references lists and citation search process was repeated for any
additional identified included studies from this
add-itional search. Lastly, the authors consulted six external content experts (eg, physicians, surgeons, nurses,
podia-trists) in thefield. The authors forwarded the systematic
review abstract, search terms and a list of all identified
included studies to the content experts, and content experts provided any additional study titles they consid-ered may have also met the inclusion criteria.
Quality assessment
A study quality assessment tool was used to perform the
study quality assessments of all included studies.28 This
tool was originally designed to assess the methodological quality of pressure ulcer prevalence in inpatient
popula-tions.28 The authors made minor modifications to this
tool to reflect the focus of foot disease rather than
pres-sure ulcers. See online supplementary table S3 for the
modified 10-item questions used to evaluate the
meth-odological quality of studies included in this review. Each
item was scored either as a ‘yes’ (score=1) or ‘no/not
reported’(score=0) with a total possible score of 10.28
Two authors (PAL and MEF), blinded to each other’s
assessments, assessed the methodological quality of all
included studies using the aforementioned tool.
A research assistant independent of the authors
redacted all identifying features (title, authors and journal details) of all included studies prior to forward-ing studies in a random order to the authors individually for assessment. At the conclusion of this process, the
overall agreement between the two blinded author’s
scores was calculated and reported for all items. Any dif-ferences in the original blinded assessments between the two authors (PAL and MEF) were then resolved by con-sensus agreement between the two authors. A third
author (SEH) was used to make a final adjudication if
agreement could not be reached. Studies were given a
total study quality score which was classified as either
‘poor’(total score=0–3),‘moderate’(total score=4–6) or ‘good’(total score=7–10) study quality.
Data extraction
Data extraction was completed for each included study
by the first author (PAL) using a custom-designed data
extraction spreadsheet. Data were extracted for total sample size, average age (mean or median), age range, proportion of males, and any numbers or prevalence data for the foot disease or risk factor variables. Sample
size data were also extracted on condition-specific
sub-groups (diabetes or pressure ulcers) and amputations if reported. All extracted data were then checked for accuracy and omissions by a non-blinded second author (SDJ). At the conclusion of this data extracting checking process, the overall agreement between the second
checking author’s findings (SDJ) and the original
author’s findings (PAL) was calculated and reported.
Any differences in the data extraction finding between
the two authors (PAL and SDJ) were then resolved by consensus agreement between the two authors (PAL
Lazzarini PA,et al.BMJ Open2015;5:e008544. doi:10.1136/bmjopen-2015-008544 3
Open Access
group.bmj.com on June 8, 2016 - Published by
and SDJ). A third author (SEH) was used to make a
final adjudication if agreement could not be reached.
Statistical analysis
Data were analysed using Stata V.13 (StataCorp LP, College Station, Texas, USA) and Microsoft Excel V.2010 (Microsoft Corporation, Redmond, Washington, USA). Descriptive statistics were reported on all included studies. Medians (IQRs) were calculated for the study quality scores of groups of studies using similar study design and reporting the same foot disease disorder or risk factor. Kruskal-Wallis and Mann-Whitney U tests were used to test study quality score differences between these groups. For the purposes of measures of
agree-ment between authors, a percentage agreeagree-ment and κ
statistic were used.29 The κ value (SEs) strengths of
agreement were categorised as: no agreement<0;
slight agreement=0–0.20; fair agreement=0.21–0.40;
moderate agreement=0.41–0.6; substantial agreement=
0.61–0.8; and near-perfect agreement=0.81–1.0.29
The summary statistic used for each study’s foot disease
disorder or risk factor variable was a prevalence propor-tion. The SE for each prevalence estimate was then calcu-lated. If a study only reported numbers, these numbers were converted to a prevalence proportion using the ratio of the number of individuals with the foot disease disorder or risk factor variable reported (numerator) and the number of the total sample size of the study (denominator). Studies reporting only numbers of a foot disease disorder or risk factor per total disorder (eg, foot wounds per total wounds) were converted to numbers of patients with the foot disease disorder or risk factor for the purpose of this review. This was performed using the ratio of the number of the foot disease disorder or risk factor and the number of total disorder, multiplied by the total sample size population. These studies were excluded from any meta-analyses performed.
Meta-analyses were calculated where three or more
studies of at least‘moderate’methodological quality had
reported the same foot disease disorder or risk factor
using a similar study design.29 Meta-analyses were used
to calculate pooled prevalence estimates for the foot disease disorder or risk factor using a random-effects
model.29 Random effects were used to give an average
estimate across heterogeneous studies weighted on total
sample size.29 The I2test was used to test for
heterogen-eity across studies included in individual meta-analysis; I2
values of <25%, 25–75% and >75% were rated as low,
moderate and high heterogeneity, respectively.29
Scatterplots were used to investigate if individual
meta-analysis prevalence estimates were influenced by
factors, such as sample size or study quality.29
RESULTS Search results
Figure 1 displays the search strategy and study selection results. The search strategy yielded a total of 4972
unique records of which 698 studies were retrieved for detailed eligibility assessment. Of those, 56 studies met the eligibility criteria and were included. An additional
306 potentially eligible articles were identified from
hand searching references and citation searching pro-cesses from the 56 included studies and 22 of those met eligibility criteria and were included. Lastly, 30 further
additional studies were identified by the external
content experts and none of those met the eligibility cri-teria. Overall, 78 studies, reporting 84 individual hospital cohorts, were included in this systematic review.
Study characteristics
Table 1 displays the summary characteristics of the 84 individual study cohorts from the 78 included studies.
Online supplementary tables S4–6 display the specific
individual characteristics and citations for each of the 84 individual study cohorts. Rather than presenting tables in alphabetical order, the authors chose to group similar studies together for ease of comparison. Study cohorts were grouped according to the foot disease disorder or risk factor reported and study design ( prospective or retrospective) used due to the reported prevalence dif-ferences ascertained from different foot disease disor-ders, risk factors and study designs.30 31
The 84 included study cohorts included a total of 60 231 517 participants; 66 (79%) prospective cohorts reported on a total of 643 141 participants and 18 (21%) retrospective cohorts reported on a total of
59 588 376 participants (table 1). Sample sizes ranged
from 59 to 57 639 000, 59 to 158 236 in prospective studies and 167 to 57 539 000 in retrospective studies. Only 15 (18%) included study cohorts were investigated for foot disease disorders or risk factors as the primary aim of the study; 8 in prospective cohorts and 7 in retro-spective cohorts. Study cohorts reporting foot disease disorders included: 70 (83%) foot wounds, 7 (8%) foot infection and 12 (14%) reported foot disease collect-ively. Study cohorts reporting risk factors included: 10 (12%) PAD, 6 (7%) PN and no studies reported foot deformity. Study cohorts could be grouped into three distinct subgroups of condition-related studies, includ-ing: 8 (10%) reporting all-cause foot disease disorders or risk factors (see online supplementary table S4), 24 (29%) reporting diabetes-related foot disease disorders or risk factors (see online supplementary table S5), and 52 (62%) reporting pressure ulcer-related foot disease disorders or risk factors (see online supplementary table S6) in their general inpatient population sample. Three studies reported both all-cause and diabetes-related foot disease disorders or risk factor prevalence in their general inpatient population sample.
Quality assessment
Online supplementary table S7 displays the original
methodological quality assessments from the two
blinded authors for the 78 included studies. Theκ(SE)
values calculated between the two blinded author’s
4 Lazzarini PA,et al.BMJ Open2015;5:e008544. doi:10.1136/bmjopen-2015-008544
Open Access
group.bmj.com on June 8, 2016 - Published by
assessments ranged from 0.69 (0.10) to 0.96 (0.04)
which corresponded to ‘substantial’ or ‘near-perfect’
strengths of agreement for each item analysed. The
per-centage agreements between the two blinded author’s
assessments ranged between 86% and 99% with an overall agreement of 92% (720 of the 780 total items).
Table 2displays the final agreed methodological quality assessment results for all included studies. Overall, 25
(32%) studies had ‘good’ methodological study quality
scores, 40 (51%) had ‘moderate’ study quality scores
and 13 (17%) had‘poor’study quality scores.
Table 1 displays differences in median study quality scores between studies reporting different study designs and different condition-related foot disease disorders or risk factors. Prospective studies reported statistically
significant higher study quality scores (median (IQR)
6(5–7)) than retrospective studies (3(3–5); p<0.05).
Studies reporting pressure ulcer-related foot disease or
risk factors also reported statistically significant higher
study quality scores (7(5–8)) than those reporting
all-cause foot disease or risk factors (5(4.5–6)) or diabetes
foot-related foot disease or risk factors (4(3–5);
( p<0.05). Table 2 displays the findings from the
assess-ment of all 10 individual methodological quality items
used. Thesefindings revealed: 83% of studies reported a
prospective design, 83% reported an appropriately sampled population, 88% recruited an adequate sample size (>300 participants), 68% used a physical examin-ation to determine the foot disease disorder or risk factor, 67% used a validated outcome measure and 60% had an adequate response rate of eligible participants. It also revealed: only 22% reported measuring the foot disease disorder or risk factor in an unbiased manner and 0% reported foot disease or risk factor prevalence estimates with CIs.
Data extraction
Overall percentage agreement between the findings of
the two authors performing data extraction was 97% (720 of the 740 total items). The 20 differences between the second author (SDJ) checking the data extraction
findings of thefirst author (PAL) included: eight
round-ing, eight data entry and four case definition errors. All
20 differences were errors originally made in the data
extraction process by thefirst author (PAL).Table 1and
online supplementary tables S4–6 display the final
agreed consensus findings from the data extraction
process for all included studies.
Prevalence of foot disease disorders and risk factors
Table 1 reports the total and subgroups of condition-related foot disease disorders and risk factor prevalence ranges in general inpatient populations. Total foot
disease disorder prevalence ranges included: 0.01–
13.5% for foot wounds, 0.05–6.4% for foot infections
and 0.2–11.9% for collective foot disease. Total risk
factor prevalence ranges included: 0.01–36.0% for PAD,
0.003–2.8% for PN and foot deformity was not reported. T
able 1 Sum mary cha ra cter is tics of inclu ded s tudies Gr oup Stud y cohor ts (k (%) ) T otal samp le (n) S amp le (m ) Samp le range Stud y aim k (%) Stud y qua lity (M (IQR)) k F oot wo und (%) k F oot infect ion (%) k F oot dise ase (%) k P AD (%) k PN (%) k Am p (%) T ota l 84 (100 %) 60 231 517 717 042 59 – 57 639 000 15 (18% ) 5 (4 – 7) 70 0.0 1 – 13. 5 7 0.0 5 – 6.4 12 0.2 – 11. 9 10 0. 01 – 36.0 6 0.0 03 – 2.8 10 0. 03 – 1.5 P rospe ctiv e 66 (79% ) 643 141 9745 59 – 158 236 8 (12% ) 6 (5 – 7) 63 0.3 – 13. 5 4 0.0 9 – 6.4 3 1.1 – 8.3 3 0. 2 – 36. 0 1 2.8 0 3 0. 2 – 1. 5 R etr ospe ctiv e 18 (21% ) 59 588 376 3 310 465 167 – 57 639 000 7 (39% ) 3 (3 – 5) 7 0.0 1 – 2. 3 3 0.0 5 – 0.5 9 0.2 – 11. 9 7 0. 01 – 0.5 5 0.0 03 – 2.8 7 0. 03 – 0.4 All-cau se 8 (10% ) 58 122 891 7 265 361 291 – 57 639 000 4 (50% ) 5 (4.5 – 6) 3 0.7 – 4.2 2 0.0 9 – 0.5 2 0.2 – 1.2 4 0. 3 – 36. 0 1 0.2 3 0. 03 – 0.2 P rospe ctiv e 4 (50% ) 2471 618 291 – 990 2 (50% ) 6 (4.5 – 7) 2 1.6 – 4.2 –– – – 2 29. 6 – 36. 0 –– –– R etr ospe ctiv e 4 (50% ) 58 120 420 14 530 105 46 126 – 57 639 000 2 (50% ) 5 (4.5 – 5) 1 0.7 2 0.0 9 – 0.5 2 0.2 – 1.2 2 0. 3 – 0. 5 1 0.2 3 0. 03 – 0.2 Dia betes-rela ted 24 (29% ) 1 965 035 81 876 167 – 596 591 8 (33% ) 4 (3 – 5) 15 0.0 1 – 7. 0 5 0.0 5 – 6.4 10 0.2 – 11. 9 6 0. 01 – 0.4 5 0.0 03 – 2.8 7 0. 04 – 1.5 P rospe ctiv e 10 (42% ) 15 659 1566 372 – 5188 3 (33% ) 4 (4 – 5) 9 0.3 – 7.0 4 0.0 9 – 6.4 3 1.1 – 8.3 1 0. 2 1 2.8 3 0. 2 – 1. 5 R etr ospe ctiv e 14 (58% ) 1 949 376 139 241 167 – 596 591 5 (36% ) 3 (3 – 4) 6 0.0 1 – 2. 3 1 0.0 5 7 0.2 – 11. 9 5 0. 01 – 0.4 4 0.0 03 – 2.8 4 0. 04 – 0.4 Pr essur e ulce r-r ela ted 52 (62% ) 625 011 12 019 59 – 158 236 3 (6%) 7 (5 – 8) 52 0.3 – 13. 5 – – –– – – –– –– P er person 15 (29% ) 81 094 5406 60 – 37 307 1 (7%) 7 (6 – 8) 15 3.0 – 8.5 – – –– – – –– –– P er ulce r 37 (71% ) 543 917 14 700 59 – 158 236 2 (5%) 6 (5 – 7) 37 0.3 – 13. 5 – – –– – – –– –– -, not repor ted; %, pr evale nce; A mp, amput a tion; IQR, interqu artile range ; K , Stu dy coh ort numbe rs; m, m ean; M , Me dian; n, pa tient numb ers; P AD, peri ph er al arter ial dise ase; PN, per ipher al neur opa thy . Stud y Aim : 1 = Inv es tiga ting a foo t dise ase disorde r or risk fa ctor is a prima ry aim of s tudy , 0 = Inv es tiga ti ng a foot dise ase disorder or risk fa ctor is not a prim ary aim of s tudy; Stu dy Q uality: T ota l agr eed s tudy quality sc or e fr om th e metho dologi cal ass ess ment per formed in tab le 2 (total possib le sco re is 10).
Lazzarini PA,et al.BMJ Open2015;5:e008544. doi:10.1136/bmjopen-2015-008544 5
Open Access
group.bmj.com on June 8, 2016 - Published by
Table 2 Final agreed methodological quality assessment results for all included studies*
Author Year
Question 1
Question 2
Question 3
Question 4
Question 5
Question 6
Question 7
Question 8
Question 9
Question 10
Total score†
Quality category‡
All-cause
Antonopoulos32 2005 0 1 1 1 1 0 0 0 1 1 6 Moderate
Currie24 1998 1 0 0 1 0 0 1 0 1 1 5 Moderate
Donnan33 2000 1 0 0 1 0 0 1 0 1 1 5 Moderate
Gottrup34 2013 1 1 0 1 0 0 0 0 0 0 3 Poor
Gruen35 1997 1 1 1 1 0 0 1 0 0 1 6 Moderate
Henke36 2005 1 0 0 1 0 0 1 0 1 0 4 Moderate
Lacroix37 2008 1 1 1 0 1 1 1 0 1 1 8 Good
Morgan38 2010 1 0 0 1 0 0 1 0 1 1 5 Moderate
Diabetes-related
Ajayi39 2009 0 0 0 1 0 0 1 0 0 1 3 Poor
Asumanu40 2010 0 1 1 1 1 0 0 0 1 0 5 Moderate
Chijioke41 2010 0 0 0 1 0 0 1 0 1 0 3 Poor
Daultry42 2011 1 1 1 1 0 0 0 0 0 0 4 Moderate
Hurd43 2009 1 1 1 1 1 0 1 0 0 0 6 Moderate
Leichter44 1982 0 0 0 1 0 0 1 0 0 0 2 Poor
Mahe45 2006 1 1 1 1 0 0 1 0 0 1 6 Moderate
Masson46 1992 1 1 0 1 0 0 1 0 0 0 4 Moderate
Mohammad Akther47
2011 0 1 1 1 1 0 0 0 1 0 5 Moderate
Mottini48 2003 0 0 0 1 0 0 1 0 0 0 2 Poor
Nason49 2013 1 0 0 1 0 0 1 0 0 0 3 Poor
Ogbera50 2006 1 0 0 1 0 0 1 0 0 0 3 Poor
Ogbera51 2007 0 1 0 1 0 0 1 0 0 1 4 Moderate
Otu52 2013 0 0 0 1 1 0 1 0 1 0 4 Moderate
Sjoberg53 2007 0 0 0 1 0 0 1 0 0 1 3 Poor
Tait54 2007 1 1 0 1 0 0 0 0 0 0 3 Poor
Unachukwu55 2007 0 1 1 1 1 0 0 0 0 0 4 Moderate
Wallymahmed56 2005 1 1 0 1 0 0 1 0 0 0 4 Moderate
Williams57 1985 1 0 0 1 0 0 1 0 0 0 3 Poor
Pressure ulcer-related
Alja’afreh58 2013 0 1 1 0 0 0 0 0 0 0 2 Poor
Allcock59 1994 1 1 1 1 0 0 1 0 0 0 5 Moderate
Amlung60 2001 1 1 1 1 1 0 0 0 0 0 5 Moderate
Barczak61 1997 1 1 1 1 1 0 0 0 0 1 6 Moderate
Barrois62 1995 1 1 0 1 1 0 0 0 0 1 5 Moderate
Barrois63 2008 1 1 0 1 1 0 1 0 1 1 7 Good
Bours64 1999 1 1 1 1 1 1 0 0 0 1 7 Good
Bours65 2002 1 1 1 1 1 1 0 0 0 1 7 Good
Brito66 2013 1 1 1 1 1 0 0 0 0 1 6 Moderate
Charlier67 2001 1 1 1 0 0 0 1 0 0 1 5 Moderate
Clark68 1992 1 1 0 1 1 0 1 0 0 0 5 Moderate
Cole69 2004 1 1 1 0 1 0 1 0 0 0 5 Moderate
da Silva Cardoso70
2010 1 1 1 1 1 0 0 0 0 0 5 Moderate
Continued
6
Lazzarini
P
A,
et
al
.
BMJ
Open
2015;
5
:e008544.
doi:10.1136/
bmjopen-20
15-008544
Ope
n
Ac
cess
group.bmj.com
on June 8, 2016 - Published by
http://bmjopen.bmj.com/
Table 2 Continued
Author Year
Question 1
Question 2
Question 3
Question 4
Question 5
Question 6
Question 7
Question 8
Question 9
Question 10
Total score†
Quality category‡
Dealey71 1991 1 1 0 1 0 0 0 0 0 0 3 Poor
Dealey72 1994 1 1 1 1 1 0 1 0 0 0 6 Moderate
Ek73 1982 1 1 0 1 0 0 0 0 0 0 3 Poor
Gallagher74 2008 1 1 1 1 1 1 1 0 0 1 8 Good
Galvan-Martinez75
2012 1 1 1 0 1 1 1 0 0 1 7 Good
Gawron76 1994 1 1 1 1 1 1 1 0 0 1 8 Good
Gethin77 2005 1 1 1 1 1 0 1 0 0 1 7 Good
Gosnell78 1992 1 1 1 1 1 1 1 0 1 0 8 Good
Groeneveld79 2004 1 1 1 1 1 1 1 0 0 1 8 Good
Gunningberg80 2005 1 1 1 1 1 1 1 0 0 1 8 Good
Gunningberg81 2006 1 1 1 1 1 1 1 0 0 1 8 Good
Gunningberg82 2008 1 1 1 1 1 1 1 0 0 1 8 Good
Gunningberg83 2013 1 1 1 1 1 0 0 0 0 1 6 Moderate
Hopkins84 2000 1 1 1 1 1 0 0 0 0 0 5 Moderate
House85 2011 1 1 1 0 1 0 0 0 0 0 4 Moderate
Inan86 2012 1 1 1 1 1 0 1 0 1 1 8 Good
Jenkins87 2010 1 1 1 1 1 0 0 0 0 0 5 Moderate
Lahmann88 2006 1 1 1 1 1 0 1 0 0 1 7 Good
Langemo89 1990 1 1 1 0 1 0 0 0 0 0 4 Moderate
Lepisto90 2001 1 1 1 0 1 0 0 0 0 0 4 Moderate
Meehan91 1990 1 1 1 1 1 0 0 0 1 0 6 Moderate
Meehan92 1994 1 1 1 1 1 0 0 0 1 0 6 Moderate
Nyquist93 1987 1 1 1 1 1 0 0 0 0 0 5 Moderate
O’Brien94 1998 1 1 1 1 1 0 0 0 0 0 5 Moderate
Pearson95 2000 1 1 1 1 1 0 1 0 0 0 6 Moderate
Soldevilla96 2006 1 1 0 1 1 0 1 0 0 0 5 Moderate
Thoroddsen97 1999 0 1 0 1 1 1 1 0 0 1 6 Moderate
Tubaishat98 2011 1 1 1 1 1 1 1 0 0 1 8 Good
Tubaishat99 2013 1 1 1 0 1 1 1 0 0 1 7 Good
Uzun100 2007 1 1 1 1 1 0 1 0 1 1 8 Good
Vanderwee101 2007 1 1 1 1 1 1 0 0 0 1 7 Good
Vanderwee102 2011 1 1 1 1 1 1 0 0 1 1 8 Good
Vangilder4 2008 1 1 1 1 1 0 0 0 1 1 7 Good
Vangilder103 2010 1 1 1 1 1 0 0 0 1 1 7 Good
Wann-Hansson104
2008 1 1 1 1 1 0 1 0 1 1 8 Good
Whittington105 2004 1 1 1 1 0 0 0 0 0 0 4 Moderate
Young106 2002 1 1 1 1 1 1 1 0 0 1 8 Good
Zhao107 2010 1 1 1 1 1 0 1 0 0 1 7 Good
Total (n) 65 65 53 69 52 17 46 0 20 39 426
Total (%) 83.3 83.3 67.9 88.5 66.7 21.8 60.0 0 25.6 50.0 54.6
*Please see online supplementary table S3 for descriptions of each question; score: 1,‘yes’; 0,‘no’or‘not reported’. †Total score, total agreed study quality score from the methodological assessment performed (total possible score is 10).
‡Quality category, total study quality score was classified as either‘poor’(total score=0–3),‘moderate’(total score=4–6) or‘good’(total score=7–10) study quality score. Author, primary author of included study; Year, year included study was published.
Lazzarini
P
A,
et
al
.
BMJ
Open
2015;
5
:e008544.
doi:10.1136/
bmjopen-20
15-008544
7
Open
Acces
s
group.bmj.com
on June 8, 2016 - Published by
http://bmjopen.bmj.com/
Amputation prevalence ranges were 0.03–1.5%. The prevalence ranges were different for subgroups of condition-related foot disease disorders and risk factors reported. Prevalence ranges for foot wounds included:
0.7–4.2% for all-cause foot wounds; 0.01–7.0% for
diabetes-related foot wounds and 0.3–13.5% for pressure
ulcer-related foot wounds. Prevalence ranges for foot
infections included: 0.09–0.5% for all-cause foot
infec-tion, 0.05–6.4% for diabetes-related foot infections and
pressure ulcer-related foot infections was not reported. Prevalence ranges for collective foot disease included:
0.2–1.2% for all-cause foot disease, 0.2–11.9% for
diabetes-related foot disease and pressure ulcer-related foot infections was not reported. Prevalence ranges for
PAD included: 0.3–36.0% for all-cause PAD and 0.01–
0.4% for diabetes-related PAD. Prevalence ranges for PN
included: 0.2% for all-cause PN and 0.003–2.8% for
diabetes-related PN. Again prevalence was greater in pro-spectively designed studies for all condition-related foot disease or risk factors investigated in general inpatient populations, with the exception of collective foot disease and PN.
Meta-analyses
Four foot disease disorders met the prespecified
minimum for meta-analysis calculation of three eligible
studies with similar study designs.Tables 3–6report the
pooled prevalence estimates from the meta-analyses
cal-culations for pressure ulcer-related foot wounds,
diabetes-related foot wounds, diabetes-related foot
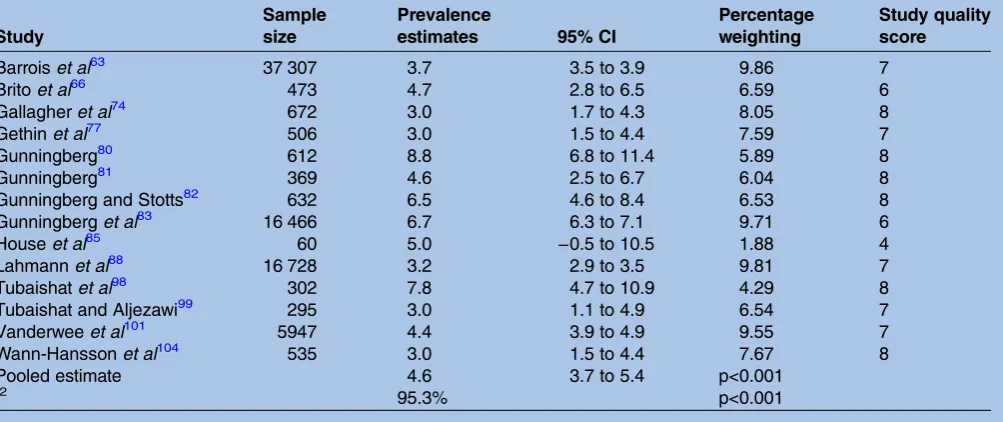
infec-tions and diabetes-related foot disease.Table 3reports a
pooled prevalence estimate for pressure ulcer-related foot wounds based on 14 included studies reporting sample sizes ranging from 60 to 37 307 and study quality scores from 4 to 8. The pooled prevalence estimate was
4.6% (95% CI 3.7% to 5.4%, p<0.001; I2=95.3%,
p<0.001). Examination of scatterplots revealed a bias between higher reported pressure ulcer-related foot wound prevalence and those studies using an unbiased,
reliable outcome measure (figure S1).
Table 4 reports a pooled prevalence estimate for diabetes-related foot wounds based on six included studies reporting sample sizes ranging from 624 to 5188 and study quality scores from 4 to 6. The pooled preva-lence estimate was 2.4% (95% CI 1.5% to 3.4%, p<0.001; I2=94.2%, p<0.001). Examination of scatterplots revealed sources of bias between higher reported diabetes-related foot wound prevalence and those studies either report-ing smaller sample sizes, havreport-ing lower study quality or
studies conducted in developing countries (figure S2).
Table 5 reports a pooled prevalence estimate for diabetes-related foot infections based on three included studies reporting sample sizes ranging from 827 to 5188 and study quality scores from 4 to 5. The pooled preva-lence estimate was 3.4% (95% CI 0.2% to 6.5%, p<0.05;
I2=97.0%, p<0.001). Scatterplots were not evaluated due
to the limited number of included studies.
Table 6 reports a pooled prevalence estimate for diabetes-related foot disease based on three included studies reporting sample sizes ranging from 810 to 5188 and study quality scores from 4 to 5. The pooled preva-lence estimate was 4.7% (95% CI 0.3% to 9.2%, p<0.05;
I2=97.8%, p<0.001). Scatterplots were not evaluated due
to the limited number of included studies.
DISCUSSION Principal findings
This study is the first systematic review to investigate the
[image:8.595.51.553.519.730.2]prevalence of foot disease in representative general inpatient populations. The prevalence of foot disease disorders in general inpatient populations ranged from
Table 3 Pooled random-effects estimates forpressure ulcer-related foot woundprevalence expressed as % (95% CI)
Study
Sample size
Prevalence
estimates 95% CI
Percentage weighting
Study quality score
Barroiset al63 37 307 3.7 3.5 to 3.9 9.86 7
Britoet al66 473 4.7 2.8 to 6.5 6.59 6
Gallagheret al74 672 3.0 1.7 to 4.3 8.05 8
Gethinet al77 506 3.0 1.5 to 4.4 7.59 7
Gunningberg80 612 8.8 6.8 to 11.4 5.89 8
Gunningberg81 369 4.6 2.5 to 6.7 6.04 8
Gunningberg and Stotts82 632 6.5 4.6 to 8.4 6.53 8
Gunningberget al83 16 466 6.7 6.3 to 7.1 9.71 6
Houseet al85 60 5.0 −0.5 to 10.5 1.88 4
Lahmannet al88 16 728 3.2 2.9 to 3.5 9.81 7
Tubaishatet al98 302 7.8 4.7 to 10.9 4.29 8
Tubaishat and Aljezawi99 295 3.0 1.1 to 4.9 6.54 7
Vanderweeet al101 5947 4.4 3.9 to 4.9 9.55 7
Wann-Hanssonet al104 535 3.0 1.5 to 4.4 7.67 8
Pooled estimate 4.6 3.7 to 5.4 p<0.001
I2 95.3% p<0.001
8 Lazzarini PA,et al.BMJ Open2015;5:e008544. doi:10.1136/bmjopen-2015-008544
Open Access
group.bmj.com on June 8, 2016 - Published by
0% to 13%, while the prevalence of a major risk factor for foot disease ranged from 0% to 36%. Meta-analyses could only be calculated for four condition-related foot disease disorders. These pooled prevalence estimates indicated that 4.6% (95% CI 3.7% to 5.4%) of all inpati-ents had a pressure ulcer present on their foot, 4.7% (0.3% to 9.2%) had collective diabetes-related foot disease, 2.4% (1.5% to 3.4%) had diabetes-related foot wounds and 3.4% (0.2% to 6.5%) had diabetes-related
foot infections. Additionalfindings from this review
sug-gested up to 1.2% of all inpatients had been hospitalised for the primary reason of foot disease. However, this sys-tematic review also revealed large variations in reported prevalence and study quality within each foot disease dis-order or risk factor of interest. These variations appear to have been the major contributors to the high statis-tical heterogeneity reported in the pooled prevalence estimates from this review.
Strengths and weaknesses
The findings of this systematic review should be viewed
in the context of several consistent limitations observed in the included studies of this review. First, most included studies reported foot disease disorders or risk factor as an additional outcome and no included studies reported CIs or sample size calculations for foot disease
findings. Second, most included studies reported a
condition-related (such as diabetes-related), rather than an all-cause, foot disease disorder or risk factors in a general inpatient population. Third, study quality scores varied considerably depending on the study design and foot disease disorder or risk factor investigated. Fourth, all-cause and diabetes-related foot disease disorder or
risk factor findings were predominately reported from
retrospective studies. Lastly, while studies reporting pres-sure ulcer-related foot disease were all prospective and mostly of high quality, a large proportion reported only pressure ulcers on the heel. Overall, these limitations impact on the capture, precision and heterogeneity of
findings and indicate included studies are likely to have
under-reported foot disease disorder and risk factor prevalence.
The authors are also cognisant of limitations in the methodology used to perform this systematic review. First, this review used broad inclusion criteria for foot disease disorders, risk factors and general inpatient
population definitions, and this may have contributed
to the heterogeneity of findings. Second, the original
search strategy was performed by only one author and did not initially identify studies reporting pressure
ulcer-related foot wounds on specific anatomical locations of
the foot. However, the authors believe this was
addressed by conducting a broad initial search strategy, an extensive additional pressure ulcer-related search strategy, hand searching references of all included studies, citation searching all included studies and con-tacting external content experts to identify any remain-ing relevant studies. Third, only one author extracted data. However, a second author checked all data
extrac-tion finding and reported very high percentage
agree-ment with the original data extraction findings. Fourth,
[image:9.595.43.553.67.186.2]the tool used to assess the methodological quality of included studies had not been tested for reliability and validity. However, the tool reported substantial inter-rater reliability agreement between blinded authors in this study, had high face validity and aligned with items Table 4 Pooled random-effects estimates fordiabetes-related foot woundprevalence expressed as % (95% CI)
Study
Sample size
Prevalence
estimates 95% CI
Percentage weighting
Study quality score
Asumanuet al40 966 4.3 3.1 to 5.6 14.60 5
Hurd and Posnett43 3099 1.1 0.7 to 1.5 18.99 6
Mahéet al45 624 0.5 −0.1 to 1.0 18.40 6
Mohammad Aktheret al47 5188 1.1 0.8 to 1.3 19.22 5
Ogberaet al51 1327 2.7 1.8 to 3.6 16.84 4
Unachukwuet al55 827 7.0 5.3 to 8.8 11.95 4
Pooled estimate 2.4 1.5 to 3.4 p<0.001
I2 94.2% p<0.001
Table 5 Pooled random-effects estimates fordiabetes-related foot infectionprevalence expressed as % (95% CI)
Study
Sample size
Prevalence
estimates 95% CI
Percentage weighting
Study quality score
Asumanuet al40 966 3.3 2.2 to 4.4 33.42 5
Mohammad Aktheret al47 5188 0.6 0.4 to 0.8 34.82 5
Unachukwuet al55 827 6.4 4.7 to 8.1 31.76 4
Pooled estimate 3.4 0.2 to 6.5 p=0.037
I2 97.0% p<0.001
Lazzarini PA,et al.BMJ Open2015;5:e008544. doi:10.1136/bmjopen-2015-008544 9
Open Access
group.bmj.com on June 8, 2016 - Published by
[image:9.595.46.551.649.736.2]reported to provide best practice methodological quality
assessments for observational studies.108 Lastly, the
pooled prevalence estimates calculated in this review reported very high statistical heterogeneity, and some may argue the value of reporting such heterogeneous
findings.29 However, the authors used conservative
random-effects meta-analyses models weighted on total sample size in an attempt to account for
heterogen-eity.29 Furthermore, the authors consider the reporting
of heterogeneous pooled prevalence estimates, with the clear cautionary notes provided by the authors on inter-pretation, provide considerable additional value and transparency to the existing literature available in this field.29
Interpretations of findings
The most consistent deficiency in study quality identified
in this review was that no studies reported CIs for foot
disease or risk factor prevalencefindings. This was most
probably related to very few studies investigating a foot disease disorder or risk factor as their primary outcome of interest.24 32 36 37 41 42 47 49 50 52 83 106 107Most studies reported foot disease or risk factors as an additional aim to the primary study aim of investigating the prevalence of a larger condition, such as the total pressure ulcer or diabetes prevalence. This lack of focus on foot disease
may have led to an under-reporting of prevalence fi
nd-ings as suggested in other similar studies.5 30 31
Furthermore, 7 of the 15 study cohorts that were investi-gated primarily for a foot disease disorder or risk factor
were retrospective studies.24 36 49 50 52 Retrospective
studies have been found to also considerably under-report prevalence compared with prospectively designed
studies utilising validated outcome measures,5 30 31 and
this also seemed to be the case in this review. Only eight study cohorts were prospectively investigated for the primary reason of identifying a foot disease disorder or risk factor;32 37 40 42 47 83 106 107 however, only one used
an unbiased method of measurement.37 This particular
study investigated PAD using a reliable and validated
non-invasive ankle brachial index method.37 With nearly
all studies either retrospective in design or investigating a foot disease disorder or risk factor as an additional outcome, it could be hypothesised that the pooled prevalence estimates reported in this review are likely to underestimate the actual burden of foot disease in inpatient populations.
Foot wounds were by far the most identified and
reported foot disease disorder arising from this system-atic review. Yet, only three studies reported on all-cause
foot wound prevalence.24 34 35 A large retrospective
study by Currieet al24investigating foot disease disorders and risk factors when they were the primary reason for admission was the only study with the primary aim of investigating all-cause foot wounds and reported a foot wound prevalence of 0.7%. The other two studies were prospective studies and reported all-cause foot wound
prevalence of 1.6%34 and 4.2%,35 respectively. However,
the primary aims of these prospective studies were to investigate wound prevalence, and thus, identifying foot wounds was one of several additional aims investigating
different wound locations.34 35 Limitations in study
numbers and quality calls into question the precision of all-cause foot wound prevalence estimates and meant pooled estimates could not be calculated.
In contrast, the study numbers and quality were suffi
-cient to perform meta-analyses on diabetes-related foot wound and pressure ulcer-related foot wound preva-lence. The increased numbers of studies reporting these two condition-related areas is perhaps not unexpected considering aspects of diabetes and pressure ulcer man-agement are commonly utilised internationally as key
performance indicators of hospital care quality.4 109–112
Foot wounds are major contributors to poor outcomes in
both these conditions.4 38 63 101 110 The pooled
preva-lence estimates for diabetes-related foot wounds (2.4%) and pressure ulcer-related foot wounds (4.6%) from this review indicate these foot wounds do contribute consid-erable burdens on the hospital inpatient system. While
there were more studies investigating these two
condition-related foot wounds in general inpatient popu-lations again both pooled prevalence estimates had very
high heterogeneity. This may be attributed to only‘
mod-erate’ study quality scores being eligible for inclusion in
the calculation of the diabetes-related foot wound pooled prevalence estimate. However, this was not the case for the pressure ulcer-related foot wound pooled prevalence estimate where overall included study quality scores were ‘good’. Interestingly, the only factor
identi-fied in the scatterplots to bias pressure ulcer-related foot
wound prevalence findings was the bias of the
[image:10.595.45.553.66.153.2]tors themselves. This suggests in studies where investiga-tors or data collecinvestiga-tors investigated participants from their own hospitals pressure ulcer prevalence were Table 6 Pooled random-effects estimates fordiabetes-related foot diseaseprevalence expressed as % (95% CI)
Study
Sample size
Prevalence
estimates 95% CI
Percentage weighting
Study quality score
Asumanuet al40 966 8.3 6.6 to 10.0 32.66 5
Daultreyet al42 810 4.9 3.4 to 6.4 33.05 4
Mohammad Aktheret al47 5188 1.1 0.8 to 1.3 34.28 5
Pooled estimate 4.7 0.3 to 9.2 p=0.038
I2 97.8% p<0.001
10 Lazzarini PA,et al.BMJ Open2015;5:e008544. doi:10.1136/bmjopen-2015-008544
Open Access
group.bmj.com on June 8, 2016 - Published by
under-reported. As this was the only factor identified to bias pressure ulcer-related foot wound prevalence from this review, it is therefore plausible, that the variation in pressure ulcer-related foot wound prevalence is largely affected by the quality of care provided by the individual hospital. Thus, this would support the ongoing use of unbiased pressure ulcer prevalence as a key performance indicator of hospital care quality.4 82 101
It was apparent that most studies reporting pressure ulcer-related foot wounds did not exclude wounds of diabetes origin, and conversely, most studies reporting diabetes-related foot wounds did not exclude wounds of pressure ulcer-related origin. This potential cross-contamination suggests studies reporting pressure ulcer-related foot wounds may inadvertently be a combination of the prevalence of pressure ulcer-related and diabetes-related foot wounds. Furthermore, literature reports stage 1 pressure ulcers make up to 50% of the total
pres-sure ulcer burden.63 82 101 Stage 1 pressure ulcers are
defined as non-blanchable erythema without skin loss or
a‘pre-pressure ulcer’.63 82This suggests the real pressure ulcer-related foot wound prevalence in those inpatients with skin loss may make up only 50% of the 4.6% pooled prevalence estimate reported from this review. Thus, it could be hypothesised that the real pressure ulcer-related wound prevalence may be closer to 2.4%
pooled prevalence estimatefindings for diabetes-related
foot wounds. Again considering the high likelihood of cross-contamination of these two large condition-related foot wound types, this hypothesis may extend to the sug-gestion that pressure ulcer-related foot wounds with skin loss could be a useful surrogate marker for all-cause foot wound prevalence and a potential indicator of foot care quality. However, these hypotheses need to be inter-preted with much caution until further investigations support its use in this capacity.
Foot infection was the other major foot disease dis-order included in this review and was typically reported
to affect existing foot wounds.47 51 55 The retrospective
analysis by Currie et al24 was the only study primarily
investigating all-cause foot infection prevalence and reported a rate of 0.5%. Another retrospective study to primarily investigate foot infection reported a rate of 0.1%; however, this study only investigated foot
osteo-myelitis (bone infection).36 The remaining five cohorts
reported diabetes-related foot infections.24 40 47 55 56
The prospective pooled prevalence estimate for diabetes-related foot infection was 3.4% (0.2–6.5); yet, statistical heterogeneity was again high and needs to be inter-preted with caution. This is particularly the case
consid-ering the pooled prevalence estimate for
diabetes-related foot infection was higher than for
diabetes-related foot wounds. However, the findings
from the three studies used to calculate the diabetes-related foot infection pooled prevalence estimate each individually found higher diabetes-related foot wound prevalence than they did for diabetes-related foot infec-tion prevalence.40 47 55
The aforementioned study by Currie et al24 was also
the only study to primarily investigate all-cause collective foot disease prevalence in a general inpatient popula-tion. This retrospective study analysed the proportion of foot disease that were the primary reason for admission from over 300 000 hospitalisations recorded in a Welsh
national hospital discharge data set.24 Interestingly, even
though the retrospective study design used in this large study make significant under-reporting likely,5 30 31it still
identified that collectively foot disease was the primary
reason for admission in 1.2% of hospitalisations.24 Foot
disease was also collectively reported in 11 other study cohorts with prevalence ranging from 0.2% to 11.9%.
However, a pooled prevalence estimate of
4.7%40 43 45 47 51 55 could only be calculated for
diabetes-related foot disease and this was again a
hetero-geneous finding. One factor that may have influenced
these high heterogeneous findings was the different
synonyms and inclusion criteria used to define collective
foot disease disorders between studies. The terms varied between ‘foot disease’,40 ‘foot problems’,42 53 ‘diabetic foot’38 41 and an aggregation of different foot disease
disorders.24 47 49The inconsistency of terms, definitions
and the specific foot disease disorders included within
these collective ‘foot disease’ groups appears to be a
major contributing factor in the heterogeneity of these
findings. It is recommended that a formal international
consensus process is undertaken to determine an agreed
foot disease definition so as to allow clinicians and
researchers to compare homogeneous‘foot disease’
out-comes in future.
The major risk factors for foot disease included in this study were PAD, PN and foot deformity. PAD was the
most reported risk factor in 10 cohorts. Two
‘moderate-to-good’ quality prospective studies of
all-cause PAD using similar gold standard non-invasive vas-cular outcome measures reported similar 29.6% and
36.0% prevalence findings.32 37 In contrast, other PAD
studies were either retrospective in design or reported PAD using a non-valid or reliable method. However, the
methodological deficiencies of these studies translated
to poorer study quality scores and much lower PAD
prevalence ranges of 0.01–0.5%. Thus, using the most
robust study quality evidence available, it could be hypothesised that PAD is present in approximately
one-third of general inpatient populations.32 37 PN was
reported in six cohorts with the only study reporting all-cause PN prevalence (0.2%) again the retrospective
study by Currie et al.24 All other studies reported
diabetes-related PN prevalence ranging from 0.003% to
2.8% in general inpatient populations.24 40 44 48 52 The
only study to primarily investigate diabetes-related PN
identified that 2.8% of all inpatients had diabetes-related
PN using a validated tool.40 However, with only one
retrospective study reporting all-cause PN and all other
studies reporting condition-related PN, these low
reported PN prevalence rates could again be considered to under-report the actual all-cause PN prevalence in
Lazzarini PA,et al.BMJ Open2015;5:e008544. doi:10.1136/bmjopen-2015-008544 11
Open Access
group.bmj.com on June 8, 2016 - Published by
inpatients. Foot deformity was not identified by this
review. Unfortunately, there were insufficient studies of
satisfactory quality to enable the calculation of a pooled prevalence estimate for any risk factor. Therefore, until further studies are conducted, the best estimate of the proportion of general inpatient populations with a major risk factor for foot disease appears to be up to 36%.32 37
Lastly, amputation prevalence was reported in 10
included study cohorts identified by this review ranging
from 0.03% to 1.5%.24 33 36 40 46 48 55 50The only study
primarily investigating all-cause amputation in this context was again the retrospective study by Currie
et al24 suggesting 0.1% prevalence in general inpatient populations. Most remaining studies reported diabetes-related amputation rates which ranged between 0.04%
and 1.5%.24 33 40 46 48 55 50 Unfortunately, there were
insufficient studies to calculate a pooled prevalence
esti-mate. However, this prevalence range may not be exhaustive and needs to be interpreted with caution, as amputation was a secondary aim of this review and only reported from studies that also reported foot disease or risk factors.
Implications for clinicians, researchers and policymakers While reviews have been investigating the inpatient burden of major organ disease for some time, such as heart disease,113–115 this appears to be thefirst review to determine more precise estimates for foot disease in
general inpatient populations. This review has identified
that foot disease is present in considerable proportions
of the general inpatient population. Primary findings
indicate 1 in 20 inpatients had foot disease and 1 in 3 inpatients had a major risk factor for foot disease. This review also supports existing evidence suggesting foot disease is present in large proportions of discrete
inpatient populations, such as patients with diabetes1–3
and pressure ulcers.4 82 101Furthermore, additionalfi
nd-ings indicate 1 in every 100 inpatients had been hospita-lised because of foot disease and up to 1.5% of all inpatients were in hospital to have an amputation pro-cedure. Although pooled prevalence estimates in this review had high heterogeneity, they are the most precise prevalence estimates to date to quantify the burden of foot disease present in general inpatient populations.
Overallfindings from this review appear to be very likely
an underestimate of this burden.
With such a considerable proportion of foot disease present in inpatient populations, it is perhaps surprising that more research has not been conducted to primarily
investigate this potentially considerable burden.
However, this review does highlight the need for clini-cians, researchers and policymakers to better understand and address this seemingly under-recognised burden in inpatient populations. It is recommended that future
studies in this field should be prospective in design,
have a primary aim to investigate foot disease in inpatient populations and use unbiased, reliable and
validated foot disease and risk factor outcome measures.
Furthermore, it is recommended the findings of this
review should inform policy to more precisely address this under-recognised yet considerable burden of foot disease in inpatient populations.
CONCLUSIONS
This is thefirst known systematic review to synthesise the
literature on foot disease in inpatient populations and provides the best estimates to date of this burden. Findings from this review indicate up to 36% of all inpa-tients had a major risk factor for foot disease, 5% had foot disease and up to 1% were in hospital because of foot disease. Owing to the high heterogeneity of included studies, these estimates need to be interpreted with caution; however, they are more likely to under-report the inpatient foot disease burden. This review highlights the urgent need for further research to more robustly quantify, and address, what appears to be a con-siderable burden of foot disease present in general inpatient populations.
Author affiliations
1School of Clinical Sciences, Queensland University of Technology, Brisbane,
Queensland, Australia
2Institute of Health and Biomedical Innovation, Queensland University of
Technology, Brisbane, Queensland, Australia
3Allied Health Research Collaborative, Metro North Hospital & Health Service,
Brisbane, Queensland, Australia
4Wound Management Innovation Cooperative Research Centre, Brisbane,
Queensland, Australia
5Queensland Research Centre for Peripheral Vascular Disease, College of
Medicine and Dentistry, James Cook University, Townsville, Queensland, Australia
6Podiatry Service, Kirwan Community Health Campus, Townsville Hospital and
Health Service, Townsville, Queensland, Australia
7Department of Podiatry, West Moreton Hospital & Health Service, Ipswich,
Queensland, Australia
8Centre for Musculoskeletal Research, Griffith Health Institute, Griffith
University, Gold Coast, Australia
Acknowledgements The authors wish to warmly acknowledge the work of the independent research assistant and the external content experts for their very kind assistance. The authors also wish to recognise the ongoing support provided to this work by Queensland Health, Wound Management Innovation Cooperative Research Centre, the Australian Government’s Cooperative Research Centres Program and Queensland University of Technology.
Contributors PAL conceived and designed the study, carried out the literature searches, quality assessments, data extraction, statistical analysis and drafted the manuscript. SEH conceived and designed the study, assisted with the literature searches, quality assessments, data extraction, statistical analysis, contributed to discussion and reviewed/edited the manuscript. MEF conducted quality assessments, contributed to discussion and reviewed/ edited the manuscript. SDJ conducted data extraction, contributed to discussion and reviewed/edited the manuscript. SSK, MCK and LFR conceived and designed the study, contributed to discussion and reviewed/edited the manuscript.
Funding This work was supported by grant funding from Queensland Health (Queensland Government, Australia) and the Wound Management Innovation Cooperative Research Centre (Australia).
Competing interests None declared.
Provenance and peer review Not commissioned; externally peer reviewed.
12 Lazzarini PA,et al.BMJ Open2015;5:e008544. doi:10.1136/bmjopen-2015-008544
Open Access
group.bmj.com on June 8, 2016 - Published by