University of Southern Queensland
Faculty of Health, Engineering & Sciences
Modal Testing of Existing Supermarket Floor Systems
and Predictive Finite Element Modelling for Better
Design
A dissertation submitted by
Daniel Roy Hatch
Supervisor: Dr Sourish Banerjee
in fulfilment of the requirements of
ENG4111 Research Project
towards the degree of
Bachelor of Engineering Honours (civil)
Abstract
The liveliness of the floor system at the Imperial Centre due to vibration is well known.
The magnitude of the floor vibration is unknown and is caused by pedestrian activity.
This raises questions about structural performance and serviceability for longevity and
future use. This project assesses the serviceability of two supermarket floor systems by
implementing a range of existing design procedures developed primarily for pedestrian
activity on foot bridges. The validity of these procedures on supermarket floor systems
is investigated. Erina Fair is not known to be lively and is used only for comparison.
Determination of the dynamic behaviour of floor systems in service is quite complex.
In this project, an actual measured response is obtained from the modal testing of two
supermarket floor systems, whereas the numerical response is predicted using finite
element modelling. The measured responses obtained from the Imperial Centre and
Erina Fair are compared to the predicted numerical responses obtained from the finite
element modelling to validate the excitation models and propose a new model, and to
assess the serviceability of the floor systems. Further work includes long term vibration
monitoring for trends and loading patterns in supermarket floor systems to build upon
University of Southern Queensland Faculty of Health, Engineering & Sciences
ENG4111/2 Research Project
Limitations of Use
The Council of the University of Southern Queensland, its Faculty of Health,
Engineer-ing & Sciences, and the staff of the University of Southern Queensland, do not accept
any responsibility for the truth, accuracy or completeness of material contained within
or associated with this dissertation.
Persons using all or any part of this material do so at their own risk, and not at the
risk of the Council of the University of Southern Queensland, its Faculty of Health,
Engineering & Sciences or the staff of the University of Southern Queensland.
This dissertation reports an educational exercise and has no purpose or validity beyond
this exercise. The sole purpose of the course pair entitled “Research Project” is to
contribute to the overall education within the student’s chosen degree program. This
document, the associated hardware, software, drawings, and other material set out in
the associated appendices should not be used for any other purpose: if they are so used,
it is entirely at the risk of the user.
Dean
Certification of Dissertation
I certify that the ideas, designs and experimental work, results, analyses and conclusions
set out in this dissertation are entirely my own effort, except where otherwise indicated
and acknowledged.
I further certify that the work is original and has not been previously submitted for
assessment in any other course or institution, except where specifically stated.
Daniel Roy Hatch
Supervisor: Dr Sourish Banerjee
0050078374
Signature
Acknowledgments
I would like to thank Deborah Warwick from the Imperial Centre in Gosford and Matt
McMahon from Erina Fair in Erina for allowing access to the supermarket floor systems.
I would also like to thank Dr Sourish Banerjee as supervisor for this project.
Daniel Roy Hatch
Supervisor: Dr Sourish Banerjee
University of Southern Queensland
Contents
Abstract i
Acknowledgments iv
List of Figures ix
List of Tables xiv
Abbreviations xvii
Nomenclature xix
Chapter 1 Introduction 1
1.1 Scope and Objective . . . 2
1.2 Overview of the Report . . . 5
Chapter 2 Literature Review 6
2.1 Chapter Overview . . . 6
2.2 Modal Testing and System Identification . . . 7
CONTENTS vi
2.2.2 Operational Modal Analysis of Floor Systems . . . 12
2.3 System Identification and Estimation of Modal Properties . . . 14
2.3.1 Peak Picking Method . . . 14
2.3.2 Half Power Bandwidth Method . . . 15
2.3.3 Frequency Domain Decomposition and Enhanced Frequency Do-main Decomposition . . . 15
2.4 Sensing . . . 15
2.5 Data Processing . . . 16
2.6 Quality of Experiments and Data . . . 16
2.7 Finite Element Models and Model Updating . . . 17
2.7.1 Approaches to Model Updating . . . 18
2.8 Current Excitation Models and Design Methods . . . 18
2.8.1 Design Procedures . . . 19
2.9 Chapter Summary and the Need for Research . . . 21
Chapter 3 Methodology and Programme 23 3.1 Preparatory Phase . . . 25
3.2 Exploratory Phase . . . 26
3.2.1 Accelerometer Suitability and Application Method . . . 27
3.3 Measurement Phase . . . 29
3.3.1 Experimental Modal Analysis . . . 29
CONTENTS vii
3.4 Post Test Analysis and Parameter Estimation . . . 30
3.5 Calibration and Model Updating . . . 31
3.6 Review and Comparison of Excitation Models, Modelling and Design Procedures . . . 31
3.7 Chapter Summary . . . 31
Chapter 4 Modal Testing 32 4.1 Chapter Overview . . . 32
4.2 EMA and OMA at Imperial Centre, Gosford . . . 32
4.2.1 Forced Vibration Testing at The Imperial Centre . . . 33
4.2.2 Ambient Vibration Testing at The Imperial Centre . . . 33
4.3 EMA and OMA at Erina Fair . . . 42
4.3.1 Forced Vibration Testing at Erina Fair . . . 42
4.3.2 Ambient Vibration Testing at Erina Fair . . . 43
4.4 Chapter Summary . . . 56
Chapter 5 Predictive Finite Element Modelling 57 5.1 Chapter Overview . . . 57
5.2 Initial Finite Element Models . . . 57
5.2.1 Initial Finite Element Model of The Imperial Centre . . . 58
5.2.2 Initial Finite Element Model of Erina Fair . . . 75
5.2.3 Summary of Initial Finite Element Results . . . 86
CONTENTS viii
5.3.1 Calibrated FEM of Imperial Centre . . . 91
5.3.2 Calibrated FEM of Erina Fair . . . 92
5.4 Chapter Summary . . . 99
Chapter 6 Vibration Serviceability and Excitation Models 100 6.1 Chapter Overview . . . 100
6.2 Measured Harmonic Response . . . 102
6.2.1 Evaluation of Harmonic Vibration Serviceability . . . 104
6.3 Response to Impact at Imperial Centre . . . 107
6.4 ISO 10137 . . . 110
6.5 French Setra Guide . . . 113
6.6 UK NA to Eurocode 1 . . . 114
6.7 Brownjohn et al. (2004) . . . 115
6.8 Response Spectrum Method . . . 116
6.9 Chapter Summary . . . 127
Chapter 7 Conclusions and Further Work 130 7.1 Achievement of Project Objectives . . . 131
7.2 Recommendations . . . 132
7.3 Further Work . . . 133
References 134
List of Figures
1.1 Location of subject supermarket floors (Source: Google Maps) . . . 3
1.2 Composite floor system at the Imperial Centre . . . 3
1.3 Reinforced concrete floor system at Erina Fair . . . 4
3.1 Subject floor system - Imperial Centre, Gosford NSW . . . 24
3.2 Subject floor system - Erina Fair, Erina NSW . . . 24
3.3 Typical 3x3 grid of driving and response points . . . 26
4.1 Accelerometers installed at the Imperial Centre . . . 34
4.2 Tested Slab Panels at the Imperial Centre . . . 35
4.3 Typical acceleration time history at mid-bay of the slab panels at the Imperial Centre . . . 36
4.4 Acceleration time history at mid-bay of the slab panel 4 at the Imperial Centre . . . 36
4.5 Acceleration time history at mid-bay of the slab panel 5 at the Imperial Centre . . . 36
4.6 Averaged PSD for slab panel 4 at the Imperial Centre . . . 37
LIST OF FIGURES x
4.8 Averaged PSD for slab panel 34 at the Imperial Centre . . . 37
4.9 Overlaid PSD’s for all measured channels in floor area 1 at the Imperial Centre . . . 38
4.10 Averaged PSD for all measured channels in floor area 1 at the Imperial Centre . . . 38
4.11 Overlaid PSD’s for all measured channels in floor area 2 at the Imperial Centre . . . 39
4.12 Averaged PSD for all measured channels in floor area 2 at the Imperial Centre . . . 39
4.13 Averaged PSD for all measured midbay channels in floor area 2 at the Imperial Centre . . . 40
4.14 SVD plot for all measured channels in floor area 1 at Imperial . . . 40
4.15 SVD plot for all measured channels in floor area 2 at Imperial . . . 40
4.16 Example source of noise induced by wind at Erina Fair . . . 42
4.17 Accelerometers installed on underside of floor at Erina Fair . . . 44
4.18 Accelerometer and additional wall locations at Erina . . . 45
4.19 Node numbers for the AVT models of Erina Fair . . . 46
4.20 Response PSD at node 19 . . . 47
4.21 Response PSD at node 17 . . . 47
4.22 Response PSD at node 152 . . . 48
4.23 Response PSD at node 154 . . . 48
4.24 Natural Frequency at Erina by peak picking the overlaid PSD’s . . . 49
LIST OF FIGURES xi
4.26 Natural frequency at Erina by PP the SVD plot of all measured channels 50
4.27 Acceleration time history and PSD at 6am . . . 52
4.28 Acceleration time history and PSD at 8:30am . . . 52
4.29 Acceleration time history and PSD at 1pm . . . 52
5.1 Existing floor system at the Imperial Centre . . . 59
5.2 Slab joint along ’Grid F’ . . . 60
5.3 Typical 4 bolt and 6 bolt pinned end connections at the ends of bearers 62 5.4 Typical 8 bolt moment splice end connection in the main steel beams . 63 5.5 Structural steel framing layout at the Imperial Centre . . . 64
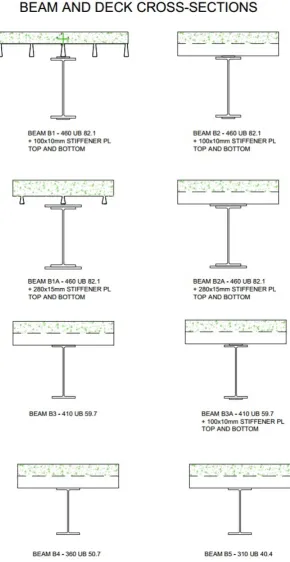
5.6 Beam and slab cross-sections at the Imperial Centre . . . 65
5.7 Imperfections at the Imperial Centre (a) & (b) Penetration in webs (c) Material degredation . . . 66
5.8 Node Supports and Beam End Releases . . . 68
5.9 Mechanical properties of TriLok steel floor deck . . . 69
5.10 Composite Slab Section . . . 70
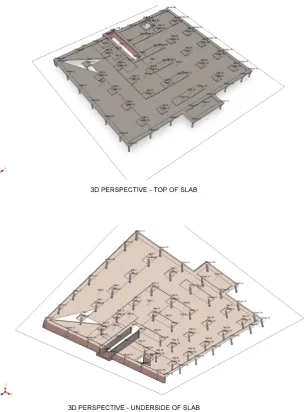
5.11 Strand 7 (2010) 3D model of floor system at the Imperial Centre between grids A-F . . . 71
5.12 Strand 7 (2010) 3D model of floor system at the Imperial Centre between grids F-L . . . 72
5.13 Strand 7 (2010) deflected shape of floor system at the Imperial Centre between grids A-F . . . 72
LIST OF FIGURES xii
5.15 Subject floor system and typical actions at Erina Fair . . . 75
5.16 Monolithic reinforced concrete structure at Erina Fair . . . 76
5.17 Layout of the reinforced concrete floor system at Erina Fair . . . 77
5.18 Boundary conditions at Erina Fair . . . 79
5.19 Strand 7 (2010) end fixities and column structure interaction at Erina Fair 80 5.20 Strand 7 (2010) 3D model . . . 81
5.21 Strand 7 (2010) deflected shape of floor system at Erina Fair . . . 81
5.22 Slabs (2014) 3D perspective output image . . . 83
5.23 Slabs (2014) deflected shape of floor system at Erina Fair . . . 84
5.24 Relative difference between the initial FEM and the measured natural frequency in floor area 1 at The Imperial Centre . . . 88
5.25 Relative difference between the initial FEM and the measured natural frequency in floor area 2 at The Imperial Centre . . . 88
5.26 Relative difference between the initial FEM and the measured natural frequency at Erina Fair . . . 89
5.27 Relative error between measured and predicted natural frequency at Erina Fair . . . 94
5.28 Example of non-structural mass at Erina Fair . . . 94
5.29 Position and magnitude of non-structural mass at Erina Fair . . . 95
LIST OF FIGURES xiii
6.1 (a)Excitation potential and reduction factors for French Setra and UK
NA EC1 (Zivanovic et al. 2010) (b) Frequency content of walking
accord-ing to Zivanovic et al. (2010) (c) Frequency content of walkaccord-ing accordaccord-ing
to Brownjohn et al. (2004) . . . 103
6.2 Pedestrian density during typical operations. Higher density during peak
periods . . . 104
6.3 Serviceability evaluation of harmonic response . . . 106
6.4 The acceleration response to an impact loading at the Imperial Centre . 111
6.5 The clipped time history record of the impact loading acceleration
re-sponse at the Imperial Centre . . . 111
6.6 The PSD of the impact loading acceleration response at the Imperial
Centre . . . 111
6.7 The displacement time history from double integration . . . 112
6.8 The static deflection of a single slab panel from Strand 7 . . . 112
6.9 The reconstructed reference response spectrum to include approximate
List of Tables
4.1 Modal Identification Results - Imperial Area 1 . . . 41
4.2 Modal Identification Results - Imperial Area 2 . . . 41
4.3 Modal Identification Results - Erina Fair . . . 51
4.4 Modeshape from FDD/EFDD - Erina Fair . . . 53
4.5 Discarded Modeshapes from FDD/EFDD - Erina Fair . . . 54
4.6 Auto-Correlation Functions - Erina Fair . . . 55
5.1 Strand 7 Frequency Solver Results - Imperial Area 1 . . . 73
5.2 Strand 7 Frequency Solver Results - Imperial Area 2 . . . 74
5.3 Strand 7 Frequency Solver Results - Erina Fair . . . 82
5.4 Slabs Dynamic Analysis Results - Erina Fair . . . 85
5.5 Comparison of Initial FEM and Measured Frequency - Imperial Area 1 . 86 5.6 Comparison of Initial FEM and Measured Frequency - Imperial Area 2 . 87 5.7 Comparison of Initial FEM and Measured Frequency - Erina Fair . . . . 87
5.8 Comparison of Slabs and Strand 7 Mode Shapes - Erina Fair . . . 90
LIST OF TABLES xv
5.10 Final Frequency Results of Updated FEM -Imperial Area 2 . . . 92
5.11 Final Frequency Results of Updated FEM . . . 96
5.12 Predicted and Measured Modes 1 to 5 - Erina Fair . . . 97
5.13 Predicted and Measured Modes 6 to 10 - Erina Fair . . . 98
6.1 Measured peak accelerations . . . 105
6.2 Raw and Filtered Acceleration Time Signals and Probability of Non-Exceedance . . . 105
6.3 ISO 10137 - Imperial Floor 1 Results . . . 119
6.4 ISO 10137 - Imperial Floor 2 Results . . . 119
6.5 ISO 10137 - Erina Results . . . 120
6.6 French Setra - Imperial Floor 1 Results . . . 120
6.7 French Setra - Imperial Floor 2 Results . . . 121
6.8 UK NA to Eurocode 1 - Imperial Floor 1 Results . . . 121
6.9 UK NA to Eurocode 1 - Imperial Floor 2 Results . . . 122
6.10 UK NA to Eurocode 1 - Erina Fair Results . . . 122
6.11 Brownjohn et al. Method - Imperial Floor Area 1 Results . . . 123
6.12 Brownjohn et al. Method - Imperial Floor Area 2 Results . . . 123
6.13 Brownjohn et al. Method - Erina Results . . . 124
6.14 Response Spectrum Method - Imperial 1 Results . . . 124
6.15 Response Spectrum Method - Imperial 2 Results . . . 125
LIST OF TABLES xvi
6.17 Response Spectrum Method - Erina Fair Results . . . 126
6.18 Comparison of Design Methods - Imperial Floor Area 1 . . . 127
6.19 Comparison of Design Methods - Imperial Floor Area 2 . . . 128
Abbreviations xviii
Abbreviations
ACF Auto Correlation Function
AISC/CISC DG11 American/Canadian Institute of Steel Construction Design Guide 11
ASD Auto Spectral Density
AVT Ambient Vibration Test
CSD Cross Spectral Density
DFT Discrete Fourier Transform
DOF Degree of Freedom
EFDD Enhanced Frequency Domain Decomposition
EMA Experimental Modal Analysis
FDD Frequency Domain Decomposition
FE Finite Element
FEM Finite Element Model
FFT Fast Fourier Transform
FRF Frequency Response Function
FVT Forced Vibration Test
IDFT Inverse Discrete Fourier Transform
IFFT Inverse Fast Fourier Transform
MAC Modal Assurance Crtierion
MEMS Micro Electro Mechanical System
OMA Operational Modal Analysis
PP Peak Picking
PSD Power Spectral Density
RC Reinforced Concrete
RTC Real Time Clock
SCI P354 The Steel Construction Institute Publication P354
SI System Identification
SVD Singular Value Decomposition
Nomenclature
A(ω) Accelerance Frequency Response Function
F(ω) Fourier Transform of Input
H(ω) Frequency Response Function
P Power spectral density
S Auto spectral density
X(ω) Fourier Transform of Response
¨
X(ω) Fourier Transform of Acceleration Response
β Modal damping ratio
γ Coherence
ω Angular/radial Frequency
Φ DOF for Mode shape
Chapter 1
Introduction
Modern engineers are designing structures with lightweight high strength materials,
creating a slender structure, and thus creating structures more susceptible to vibration
problems. These slender structures are built to span further and minimise wasted space
in communities growing in density. Structures under various actions with vibrations
perceptible to the occupants can cause discomfort and raise questions about it’s fitness
to fulfill the intended purpose. In rare cases failure has occured due to resonance
caused by dynamic loading. Rectification of floor vibration problems after construction
is completed is an expensive exercise, so identification of any potential problems during
the design stage is critical.
Floor vibration problems typically occur when the walking frequency of pedestrians
match the natural frequency of the floor system and resonance occurs. Resonance
is a critical issue in floor structures (DeSilva 2006) and resulted in structural failure
when the walkway at the Kansas City Hyatt Regency Hotel collapsed (McGrath &
Foote n.d.). Australian Standard AS1170.1-2002 Structural Design Actions;
Perma-nent and Imposed Actions gives little reference to problems relating to dynamically
imposed actions on structures. AS1170.1-2002 vaguely mentions that further analysis
may be required without giving any advice or guidance. The live loads or imposed
actions in AS1170.1-2002 are equivalent static pressure models which have been used
for many years, however it is evident from the problematic floor structures, the subject
of recent research (Hanagan 2005), that imposed actions on certain floor structures
1.1 Scope and Objective 2
their structural behaviour in service. Dynamic models for vibration serviceability are
more suited to these problematic floor structures. Existing design procedures for
mod-elling foot traffic, where some procedures are more recent than others, generally present
vibration serviceability in a simplified manner by applying simulated walking forces to
a numerical model of the dynamic floor system and comparing the numerical dynamic
response of the system to established levels of acceptability, a task that is the subject
of recent research. The numerical model is expected to predict better performance.
The liveliness of the floor system at the Imperial Centre due to vibration is well known.
The magnitude of the floor vibration is unknown and is caused by human activity. This
raises questions about structural performance and serviceability for longevity and future
use. This comprehensive research project assesses the serviceability of two supermarket
floor systems at the Imperial Centre in Gosford, and Erina Fair in Erina, in Figure
1.1, by implementing existing design procedures, and investigates the validity of these
procedures on supermarket floor systems. Erina Fair is not known to be lively and is
used only for comparison.
Determination of the dynamic behaviour of floor systems in service is quite complex.
In this project, an actual measured response is obtained from the modal testing of the
two supermarket floor systems, whereas the numerical response is predicted using finite
element modelling. The measured responses obtained from the Imperial Centre and
Erina Fair are compared to the predicted numerical responses obtained from the finite
element modelling to validate the excitation models and to assess the serviceability of
the floor systems. The Imperial Centre is a composite concrete on steel deck structure
in Figure 1.2, and Erina Fair is a monolithic reinforced concrete floor structure in
Figure 1.3. Both floor systems are subjected to similar human-induced actions from
foot traffic, wheeled trolleys and handling of bulk goods.
1.1
Scope and Objective
The scope of this research is to build an enhanced understanding of the vibration
behaviour of supermarket floor systems by full scale in-situ testing of two supermarket
floor systems in service. The aim is to quantify the level of vibration at the Imperial
1.1 Scope and Objective 3
Figure 1.1: Location of subject supermarket floors (Source: Google Maps)
[image:23.595.128.455.497.747.2]1.1 Scope and Objective 4
Figure 1.3: Reinforced concrete floor system at Erina Fair
suitable excitation model. The existing time domain procedures within ISO 10137, Steel
Construction Institute Publication P354, French Setra Guide, UK National Annex to
Eurocode 1, and the existing frequency domain procedures by Brownjohn et al. (2004),
and Ingolfsson and Georgakis (2008a and 2008b) are assessed to accurately represent
actions in a supermarket, and if necessary modifications will made to these models.
The scope and specific objectives are;
1. To build an enhanced understanding of the vibration characteristics of
supermar-ket floor systems by full scale in-situ testing of two supermarsupermar-ket floor systems in
service.
2. To quantify the level of vibration at the Imperial Centre and assess the floor
systems serviceability.
3. To perform and compare experimental modal analysis and operational modal
analysis of full-scale in-situ supermarket floor systems while implementing a low
cost data acquisition and system identification system.
4. To develop comprehensive and calibrated Finite Element Models (FEM’s) of
su-permarket floor systems in service.
5. Critically review and assess the validity of existing design procedures to model
1.2 Overview of the Report 5
1.2
Overview of the Report
This report is organized as follows:
Chapter 1 The dynamics problem is introduced. The scope and objectives are defined
for this research project.
Chapter 2 A detailed literature review of past and current research with methods
of full-scale in-situ dynamic testing, system identification and model updating is
provided. A review of literature containing excitation, sensing, data acquisition,
data processing and model updating techniques is presented.
Chapter 3 The research methodology followed throughout the experimentation to
meet the aims and objectives of this research project is presented in this chapter.
Chapter 4 Modal testing and system identification of the two supermarket floor
sys-tems is presented in this chapter.
Chapter 5 Initial finite element models based on site measurements and design
draw-ings are developed. The initial finite element models are calibrated using the
modal parameters extracted in Chapter 4 and are presented as updated finite
element models.
Chapter 6 The vibration serviceability of the floor systems is assessed. Existing
de-sign procedures and excitation models are implemented and modified where
nec-essary, in order to provide a closer estimation of actions within a supermarket.
Chapter 2
Literature Review
2.1
Chapter Overview
A range of research and literature relating to modal testing and analysis of structures
is available. Literature relevant to this research contains the estimation of dynamic
properties by modal testing and system identification, finite element models and model
updating, pedestrian traffic excitation models and modelling procedures. The
rele-vant research has been carried out by numerous researchers on floors, road and foot
bridges, stadia, stairs and many others structures subject to a range of loading
con-ditions, including pedestrian traffic. This chapter will begin by reviewing literature
related to modal testing and system identification using Experimental Modal Analysis
(EMA) with the frequency response function, and Operational Modal Analysis (OMA)
with the Auto-Spectral Density (ASD) or Power-Spectral Density (PSD). A review
is provided on system identification using the peak picking (PP) method, half power
bandwidth method and the frequency domain decomposition (FDD) method. A review
of literature containing sensing, data processing, and quality control of experiments,
finite element models and approaches to model updating. A review of current
litera-ture presenting design and modelling methods for excitation and structural response is
provided. Finally this chapter summarises the gap in knowledge and the contribution
2.2 Modal Testing and System Identification 7
2.2
Modal Testing and System Identification
Modal testing and system identification is carried out on structures to determine the
modal characteristics such as natural frequency, mode shape and damping (Ewins 2000).
Modal characteristics vary in all structures and is uncertain unless modal analysis is
carried out (Omenzetter, Beskhyroun, Shabbir, Chen, Chen, Wang & Zha 2013). The
damping ratio can be one of the most uncertain estimates in designing for dynamic
loading (Omenzetter et al. 2013). Three major forms of dynamic tests are available,
and are classified depending on the source of excitation. They are the forced
vibra-tion test, ambient vibravibra-tion test and free vibravibra-tion test (Ewins 2000). Experimental
modal analysis using forced vibration test, and operational modal analysis using the
ambient vibration test is used in this research to identify the modal properties of
full-scale in-service supermarket floor systems. The main components of modal testing are
excitation, sensing, data acquisition and data processing (Omenzetter et al. 2013).
Experimental modal analysis (EMA) has been carried out by Barrett (2006),
Omen-zetter et al. (2013) and DeSilva (2006) to name only a few. The only literature found
containing vibration analysis on a shopping centre floor system is by Pernica & Allen
(1982), where a series of unmeasured heel drops and ”walk pasts” were used to estimate
the modal properties of the floor system and categorize the peak accelerations
encoun-tered as a percentage of gravity (Pernica & Allen 1982). The floor was considered
”reasonable” and no quantification of the vibration source was attempted. Current
output only operational modal analysis (OMA) has been carried out by Omenzetter
et al. (2013), Yousaf (2007) and Vu, Thomas, Lakis & Marcouiller (2006) with varying
degrees of accuracy.
2.2.1 Experimental Modal Analysis of Floor Systems
By measuring the input excitation and output response of floor systems with full-scale
EMA an accurate description of the dynamic properties of supermarket floor systems
in service are determined. Full-scale EMA by forced vibration tests are accomplished
by exciting the structure with a measured input force and measuring the output
vibra-tion response. The input force time history and output acceleravibra-tion time history are
2.2 Modal Testing and System Identification 8
spectral analysis to form a Frequency Response Function (FRF). The FRF is further
processed to estimate the natural frequency, mode shapes and damping ratio of the
structural system (Ewins 2000), (Omenzetter et al. 2013), (Barrett 2006). Structural
systems can be excited by modal shaker, instrumented impact hammer or instrumented
heel drop.
Modal shakers can provide excitation by inducing a force at known frequencies or
fre-quency bands (Omenzetter et al 2013). Swept sine or chirp signal, continuous chirp
or burst chirp signal are typically used to introduce a known forcing function into the
system for a higher signal to noise ratio (Barrett 2006). The most expensive piece
of equipment, the modal shaker (Barrett 2006) is not considered any further in this
research due to budget restrictions. In Reynolds and Pavic (2000b) critical comparison
of the impulse hammer to a modal shaker for modal testing of building floors the
im-pulse hammer is suggested as a ’cheap starter’ but the shaker provides higher quality
data suitable for research applications. The instrumented heel drop, like the impulse
hammer, introduces a form of broadband excitation or impulse into the floor system.
The unmeasured heel drop, originally introduced by Murray (1975), is an impact
ex-citation force introduced by a person standing in a location, rising onto their toes by
approximately 5 centimeters and suddenly relaxing to allow their full weight to free-fall
and strike the floor with their heels. Blakeborough and Williams (2002) introduced the
instrumented heel drop test, rectifying the problem of unreferenced and unmeasured
input impulses with the standard heel drop test by Murray (1975). The traditional heel
drop test is now an oversimplified method that gives a generic triangular impulse of
2670 Newtons for 0.05 seconds, and it is difficult to achieve exactly the same heel drop
multiple times (Barrett 2006), although Blakeborough and Williams (2003) found that
this was a good estimate when compared with their measured heel drops, the impulse
can change from test to test, changing with the weight of the tester and the height of
the heel drop. Blakeborough and Williams (2003) found that the instrumented heel
drop test gives better coherence in the 2 to 15Hz frequency range and shorter testing
times when compared with data from an impact hammer. The coherence of the
in-strumented heel drop test was ’almost perfect’, whereas the impact hammer gives poor
data, spurious FRF peaks and poor coherence at frequencies below 4 Hz. Hanagan et
al (2003) also concluded that the instrumented heel drop yielded high quality data and
2.2 Modal Testing and System Identification 9
The advantage of using the tried and tested EMA is that the input into the system is
measured and known. With a known input force and output response the tranfer
func-tion is highly accurate when proper quality control measures are adopted. Extracfunc-tion of
modal data from the transfer function will provide the most accurate estimates of
nat-ural frequency, mode shapes and damping ratio. The disadvantage with experimental
modal analysis is that the entire extent of the structural floor system has to be closed to
avoid any unknown input forces being introduced into the system. Noise and unknown
inputs can be cancelled out by averaging multiple measurements, however unknown
discrepancies still exist in the resulting FRF’s and may result in poor coherence within
the data. Although shaker excitation is clearly the excitation source of choice for many
experimentalists (Barrett 2006), (Omenzetter et al. 2013), (Reynolds and Pavic 2000a
and 2000b) (Ewins 2000) (Hannagan et al 2003), due to cost restraints and expected
accuracy this research will use the recommended alternative source of excitation, the
instrumented heel drop.
Spectral Analysis and the Frequency Response Function
Dynamic parameters of floor structures can be estimated by recording the acceleration
response and input excitation in the time domain and converting into the frequency
domain by spectral analysis. The Frequency Response Function (FRF), a transfer
func-tion, is the ratio of the acceleration response to input force in the frequency domain
(Ewins 2000), (Omenzetter et al. 2013), (Barrett 2006). Frequency Response
Func-tions and Power Spectra are commonly used for analysis of structural systems and
identification of modal parameters in the frequency domain (Ewins 2000).
To form a frequency response function the time history response is transformed from the
time domain into the frequency domain by spectral analysis. For spectral analysis by
Fourier analysis it is assumed that the time history signal is a Fourier series represented
by a series of sine and cosine signals (Ewins 2000), (Omenzetter et al. 2013), (Barrett
2006). The general frequency response function H(ω)is defined as response per unit
input (Ewins, 2000) (Barrett, 2006);
H(ω) =X(ω)
F(ω) (2.1)
2.2 Modal Testing and System Identification 10
ω is in radians per second and is interchangeable with the cyclical frequency f in
cycles/second or Hertz. For simplicity within formulations the circular frequency ω in
radians per second is used to match the units within texts such as Ewins (2000), the
final FRF curves are converted to frequency f in Hertz by multiplying by 2π for ease
of comparison with finite element models.
The accelerance frequency response function A(ω)is of interest and used throughout
this research project, which is;
A(ω) = X¨(ω)
F(ω) (2.2)
Where ¨X(ω) is the acceleration response in the frequency domain andF(ω) is the input
force in the frequency domain. Structural floor systems can be represented by a
multi-degree of freedom system. So a matrix of frequency response functions are determined
[A(ω)]. Each term in the FRF matrix is a complex function in the frequency domain
representing the response per unit force relationship between two degrees of freedom on
the structure. Aik is the accelerance FRF matrix. Where i is the output acceleration
response location and k is the input force location. This is represented as follows;
A(ω) = ¨
Xi(ω) Fk(ω)
= ai(ω)
Fk(ω)
(2.3)
And in matrix form;
Aik(ω) =
A11(ω) A12(ω) ... A1k(ω)
A21(ω) A22(ω) ... ...
A31(ω) ... A33(ω) ...
... ... ... Aik(ω)
A single term from the FRF matrix is (Barrett 2006) (Ewins 2000);
Aik(ω) = ai(ω) Fk(ω)
=
R
X
r=1
−ω2(Φir)(Φkr)/mr
(ω2
r−ω2) +j(2βrωrω)
(2.4)
Where R is the number of modes,
2.2 Modal Testing and System Identification 11
mr is the modal mass of therth mode,
βr is the modal damping ratio of therth mode,
Φir and Φkr are the corresponding i or k DOF term of therth mode shape.
This expression is in the form that assumes viscous damping, referring to Ewins (2000)
will show that other general forms accommodating other damping models are available.
For any continuous acceleration time signal ¨x(t) it’s Fourier transform is (Omenzetter
et al, 2013) (Barrett, 2006) (Ewins 2000);
¨
X(ω) = Z +∞
−∞
¨
x(t)e−jωt, dt (2.5)
where X(ω) is the Fourier transform of ¨x(t) and j is the imaginary unit√−1.
The inverse Fourier transform is (Omenzetter et al, 2013) (Barrett, 2006) (Ewins 2000);
¨
x(t) = Z +∞
−∞
¨
X(ω)ejωt, dω (2.6)
Using an infinite time signal it is practically impossible to work with so the problem is
simplified by using only a block of time. The signal within the block is assumed to be
periodic and is sampled a finite number of times at discrete increments. By the process
of discretisation a discrete fourier transform (DFT) can then be used for analysis to take
advantage of the speed of the Fast Fourier Transform (FFT) (Omenzetter et al, 2013)
(Barrett 2006) (Ewins 2000). As stated previously the accelerance FRF is of interest in
this research. The data is converted from the time domain into the frequency domain
using the Fast Fourier Transform (FFT), the FFT of each time history is;
F F Tx(ω) = the FFT of the acceleration response time history
F F Tf(ω) = the FFT of the input force time history
F F Tx∗(ω) = the complex conjugate ofF F Tx(ω) F F Tf∗(ω) = the complex conjugate ofF F Tf(ω)
The cross spectral density (CSD) of acceleration response and the input force is;
2.2 Modal Testing and System Identification 12
And it’s complex conjugate is;
Sf x=Sxf∗ (2.8)
The auto spectral density (ASD) of acceleration response Sxx and the input forceSf f
is;
Sxx =F F Tx∗(ω)∗F F Tx(ω) Sf f =F F Tf∗(ω)∗F F Tf(ω)
(2.9)
Two forms of the Frequency Response Function are then computed (Omenzetter et al.
2013) (Ewins 2000);
H1(ω) =A1(ω) =
Sf x Sf f
(2.10)
H2(ω) =A2(ω) =
Sxx Sxf
(2.11)
The coherence according to Barrett (2006) is;
γ2= |Sxf|
2
SxxSf f
(2.12)
The coherence is a measure of linear depedence between acceleration response and input
excitation. The closer the value is to unity the more accurate the results. That is, a
coherence of 0 indicates no correlation and a coherence of 1 shows complete correlation
between input excitation and the output response. In practice a coherence of 1 is
nearly impossible to achieve, hence in forced vibration testing a coherence above 0.9 is
typically aimed for (Omenzetter et al 2013) (Barrett 2006) (Ewins 2000).
2.2.2 Operational Modal Analysis of Floor Systems
OMA is an output only form of analysis, acceleration response is the only measured
data. By measuring and analysing only the dynamic response of the floor system and
assuming the input excitation is a stationary uncorrelated white noise process, OMA
of full scale structures can estimate the dynamic properties of floor systems in service
with varying degrees of accuracy depending on the analysis methods used (Omenzetter
2.2 Modal Testing and System Identification 13
system to obtain the Auto-Spectral Density (ASD) and Power Spectral Density (PSD)
of the acceleration response. The ASD or PSD of the acceleration response is used
in-lieu of the FRF developed in forced vibration tests. Ambient vibration testing can lead
to accurate estimates of natural frequency, mode shapes, and with varying accuracy
the damping ratio. This can be accomplished quickly with little cost and disruption to
normal operating conditions (Omenzetter et al. 2013).
Research containing ambient vibration tests on structures excited by foot traffic, wheeled
traffic, wind and seismic actions are all relevant to this research because they all share
the relationship that the source of input is an ambient white noise process (Omenzetter
et al. 2013) (Zivanovic, Pavic & Ingolfsson 2010). The methods and handling of
out-put only response data in structures subject to wind and seismic actions can also be
adopted in structures subject to random human-induced vibrations. Ambient
white-noise excitation can be considered true for most structures and has been successfully
applied to foot bridges by Zivanovic et al. (2010) and Omenzetter et al. (2013) as well as
road bridges by Omenzetter et al. (2013) where the extracted modal parameters from
the ambient vibration test and forced vibration test were similar, however Zivanovic
et al (2010) found a small difference in natural frequency due to the presence of the
additional modal mass from the pedestrian weight. The presence of pedestrians during
modal testing represents the true modal properties during service. The ambient
white-noise input assumption will be tested on typical operations within a supermarket. By
considering the operations within a supermarket to be ambient excitation, the vibration
response data alone from the structure can be used to estimate the dynamic parameters
of the system. Output only OMA methods are becoming increasingly popular because
no special forcing equipment is required and the ambient excitation is a true loading
condition encountered in the structure. For large structures, ambient excitation is often
the only practical choice (Omenzetter et al. 2013).
The advantages of using operational modal analysis procedures is that it is a low cost
solution, with minimal disruption to normal operating conditions and extracted modal
parameters are representative of the structure in service conditions. Modal shakers,
impact hammers and other instrumented excitation equipment can cost considerable
amounts with a modal shaker being the most expensive piece of equipment (Barrett,
2006). Normal services and traffic flow are not disrupted because the floor structure is
2.3 System Identification and Estimation of Modal Properties 14
modal analysis is the actual unknown input force. The assumption that the input is
a random white noise process is usually a fairly accurate assumption, however if this
assumption is not true, the identified modal parameters will have errors.
Spectral Analysis and Power Spectral Density
For ambient vibration test the acceleration response in the time domain is converted
into the frequency domain by spectral analysis to obtain the Power Spectral Density
(PSD), and the Auto-Spectral Density (ASD), which is also referred to as the cross
power spectral density.
By spectral analysis of the time history signal the PSD is estimated. The PSD of
acceleration responsePxx is;
Pxx = [F F Tx(ω)]2 (2.13)
From this estimate the peaks in the PSD curve show the natural frequency of the
system.
By assuming the input into the system is Gaussian white noise, the PSD can be used
as an approximation to the FRF function and the structural floor system can be
rep-resented by a multi-degree of freedom system by a matrix of PSD curves. Each term
in the matrix is a complex function in the frequency domain (Yousaf 2007).
2.3
System Identification and Estimation of Modal
Prop-erties
2.3.1 Peak Picking Method
The peak picking method is simply picking the resonance peaks from the FRF plot
extracted from forced vibration tests, or by picking the peaks from the PSD/ASD plot
in ambient vibration tests. By picking the resonance peaks of the FRF and PSD/ASD
2.4 Sensing 15
2.3.2 Half Power Bandwidth Method
The Half Power Bandwidth Method used by Omenzetter et al (2013), Barrett (2006)
and derived in Chopra (1995) is a simple and straight forward method of calculating
damping ratios directly from the FRF plot (Omenzetter et al 2013). The method
is based on the properties of a resonance peak on the FRF, where the half-power
bandwidth is the width of the FRF at √1
2 of the peak amplitude at resonance fr. The
damping ratio from the half power bandwidth method is;
βr =
fb−fa
2fr
(2.14)
Barrett (2006) and Omenzetter et al (2013) reported that the best measurements to
use are the driving point FRFs with good resolution and correlation in the response
curves.
2.3.3 Frequency Domain Decomposition and Enhanced Frequency Do-main Decomposition
The frequency domain decomposition (FDD) technique by Brincker, Zhang & Andersen
(2009) is an easy to use method that identifies the mode shapes by locating the peaks
in a singular value decomposition plot of the auto-spectral density and cross spectral
density of response vibrations (Omenzetter et al. 2013). FDD only calculates mode
shapes and the natural frequency where the accuracy depends on the resolution of the
FFT. The Enhanced Frequency Domain Decomposition (EFDD) by Jacobsen, Andersen
& Brincker (2007) technique gives an improved estimate of natural frequency and mode
shape and also provides a damping estimate (Omenzetter et al. 2013). EFDD was
successfully applied, with varying degrees of accuracy, to the full scale modal testing
of bridge structures by Omenzetter et al. (2013).
2.4
Sensing
Sensing solutions using force transducers, accelerometers, combined force and
acceler-ation sensors in the form of an impedance heads, rotacceler-ational sensors and many
2.5 Data Processing 16
transducers to measure the input and output during modal testing. A detailed scope
and proper application of other sensors can be found in texts such as Ewins (2000).
The range of accelerometers and their manufacturers is wide, each accelerometer and
it’s manufacturer has it’s own set of advantages and limitations. The piezoelectric
transducer, such as those available from PCB Piezotronics and Omega Engineering are
the most popular and widely used means of measuring modal parameters (Ewins 2000).
However this research will take advantage of the increasingly popular and more readily
available Micro Electro Mechanical Systems (MEMS) based accelerometers (Haritos
2009), (Beskhyroun & Ma 2012). PCB Piezotronics, SensR, Phidgets and Gulf Coast
Data Concepts each offer there own range of MEMS accelerometers. A qualitative and
comparative analysis of accelerometers is provided by Haritos (2009) and Beskhyroun
& Ma (2012).
2.5
Data Processing
Data can be processed using software provided by the manufacturers of modal testing
systems and other commercial suppliers of such software. Matlab (2013) toolboxes
are also available for data processing, such as open source Matlab (2013) toolboxes
EasyMOD (Kouroussis, Fekih, Conti & Verlinden 2012a) and Engineering Vibration Toolbox (Slater 2014) or commercial toolboxes such as SDTools (Philippe & Balmes
2013) and Macec (Reynders, Schevenels & Roeck 2011). Processing modal data in
Matlab has been carried out by Beskhyroun & Ma (2012), (Omenzetter et al. 2013),
Ojeda (2012), Kouroussis, Fekih, Conti & Verlinden (2012b), Bosco (2012), and Gomaa, Tayel, Kandil & Hekal (2012).
2.6
Quality of Experiments and Data
A literature review on quality assurance methods and control of modal testing data was
conducted. Prior to collecting data or conducting any experiments a clear benchmark
of quality assurance is to be established and should be followed throughout each modal
testing project. Reynolds and Pavic (2000a) present a tried and tested guideline to aid
in the aquisition of high quality modal testing data. The guideline is aimed at full-scale
2.7 Finite Element Models and Model Updating 17
2.7
Finite Element Models and Model Updating
Finite Element Models (FEM’s) are developed to numerically simulate the response of
structures to given loading conditions. The predicted numerical response from initial
FEM’s and the measured response in final constructed systems will contain
discrepan-cies. These differences are mainly caused by inaccurate assumed physical properties,
discretization errors, inaccurate boundary conditions, and inaccurate spatial properties
of members. To minimise the error between the simulated response and the
experi-mental response of the real structure, model updating methods are used to calibrate
the uncertain parameters in the FEM. Finite element modelling and updating has been
carried out recently by Omenzetter et al. (2013), Barrett (2006), and DeSilva (2006).
Omenzetter et al. (2013) modelled a range of bridges of both monolithic concrete
struction modelled as concrete elements in ANSYS, and composite steel-concrete
con-struction modelled as transformed equivalent beam elements in SAP2000 with good
correlation between real and observed measurements in the initial FE model.
Bar-rett (2006) modelled a 3D office floor structure, also in SAP2000, constructed with
a composite concrete slab poured on a steel deck using beam elements and assigning
transformed equivalent composite cross-sectional properties by the methods described
in AISC/CISC Design Guide 11. Barrett (2006) found the initial FE model using the
equivalent cross-section method was close to the real responses observed from forced
vibration tests with shaker excitation. DeSilva (2006) modelled composite office floor
structures with a layered approach using brick and plate elements for the two seperate
materials and comparing to the simplified plate element using Abaqus solvers. The
shapes for the first two modes were the same but the frequencies calculated were
differ-ent, all subsequent mode shapes and natural frequency were different. No mode shapes
were calculated from the experimental results to prove which was the correct shape,
the equivalent plate elements were discarded and the layered models were calibrated
to suit the frequency obtained from experimental results. This research will use beam
elements for all steel beams, plate elements by the equivalent cross-section method to
model composite floor elements, and beam and plate elements to model monolithic
2.8 Current Excitation Models and Design Methods 18
2.7.1 Approaches to Model Updating
FEM’s can be calibrated by traditional manual updating or by contemporary methods
such as the Sensitivity Method (SM) (Yu, Taciroglu & Wallace 2007), (Brownjohn &
Xia 2000), a local optimisation method, or the Global Optimisation Algorithm (GOA)
method (Bakir, Reynders & Roeck 2008). Omenzetter et al. (2013) successfully applied
and evaluated a range of contemporary updating methods in their research on bridge
structures. The programming to develop these methods in Matlab is time consuming,
so only the manual method of model updating is used in this research. The manual
method of updating involves changing the dynamic parameters by trial and error until
the numerical natural frequency, mode shape, damping ratio and response match the
results obtained from modal analysis.
2.8
Current Excitation Models and Design Methods
A large amount of research has been devoted to modelling pedestrian-induced dynamic
loading and predicting the corresponding vibration response of floors and footbridges.
Five scenarios of excitation, as described by Zivanovic et al (2010) are imposed actions
from;
1. single person loading
2. normal spatially unrestricted traffic
3. crowd loading
4. group loading
5. vandal loading
Single loading as the name suggests is the imposed actions induced by a single person.
Normal spatially unrestricted traffic is the imposed actions induced by traffic where
individuals are free to walk anywhere within the bridge boundaries. ”Normal” traffic
refers to ”multi-person traffic” at a maximum density of 0.3 people/m2 (Zivanovic
et al. 2010). This can be applied to most floor structures, including supermarket floors
2.8 Current Excitation Models and Design Methods 19
possible exception is that the arranged isles of shelves restrict the pedestrians to within
the isle boundaries similar to handrails on a pedestrian bridge. Crowd loading refers to
high density pedestrian traffic, this usually refers to concerts and similar, however the
density of the crowds in shopping centres and supermarkets could approach this value.
The walking of an individual is spatially restricted because of the close proximity of
other pedestrians. Vandal loading is the identification of liveliness in the structure by an
individual pedestrian or group of pedestrians and deliberately exciting the structure by
jumping, bobbing or bending knees or by running back and forth. A supermarket floor
structures will encounter single person loading, normal spatially unrestricted traffic,
crowd loading and possibly vandal loading.
2.8.1 Design Procedures
A literature review reveals that Zivanovic et al. (2010) provided a comprehensive review
of existing design procedures provided in Euorcode 5, ISO 10137, French Setra
Guide-line, the UK National Annex to Eurocode 1, and methods developed by Brownjohn et
al (2004), Butz (2006, 2008a), and a Response Spectrum Method (Georgakis and
In-golfsson, 2008; Ingolfsson et al 2008) by comparing the numerical acceleration responses
to the measured acceleration response of two foot bridges. The two bridge structures
were excited by spatially unrestricted pedestrian traffic. It was concluded by Zivanovic
et al. (2010) that the procedures found in Eurocode 5 and ISO 10137 are outdated and
oversimplified. The two methods model multi-person traffic as a ’smaller number of
perfectly correlated people’ and does not provide an accurate estimate of the response
encountered in foot-bridges. However ISO 10137 was updated in 2012 to accommodate
Zivanovic et al. (2010) recommendations. The publication AISC/CISC Design Guide
11: Vibrations Due to Human Activity (AISC/CISC DG11, 1997) contains simplified
procedures based on single-person loading to predict the peak acceleration and
evalu-ate it against human tolerance levels (Barrett 2006). The acceptable human tolerance
levels are of interest to this research. The Steel Construction Institute Publication
P354 (SCI 2009) is a more comprehensive treatment of floor vibrations compared to
AISC/CISC DG11 (1997). Newer methods such as the French Setra Guideline and the
UK National Annex to Eurocode 1 are time domain methods that present the load
as a dynamic pressure model, as opposed to the static pressure models in AS1170.2.
2.8 Current Excitation Models and Design Methods 20
with 500 simulations under laboratory conditions, deals with multi-pedestrian traffic
flow but does not deal with a continuous random flow of traffic. Of all the time domain
Fourier techniques the UK National Annex to Eurocode 1 was the only model to deal
with a continuous stream of traffic, allowing for damping effects of pedestrians and was
the closest representation of multi-person traffic in the study (Zivanovic et al 2010).
Butz (2008), Brownjohn et al. (2004), and the Response Spectrum Method (Georgakis
and Ingolfsson, 2008; Ingolfsson et al 2008) are frequency domain based representations
of multi-person traffic. These methods were reviewed by Zivanovic et al. (2010) and
found to be based on extensive numerical simulations that ’take into account various
structural and traffic parameters to the vibration response’.
The time domain methods in SCI P354, UK National Annex to Eurocode 1, French
Setra Guide and each of the frequency domain methods are evaluated in this research
project. The AISC/CISC method involving single person loading, and the simplified
procedures adapted to multi-person traffic are already well researched and found to be
an unsuitable method for accurately modelling the response of floor systems excited by
multi-person pedestrian traffic.
Australian Standards
Australian Standard AS2670 provides guidance on the evaluation of human exposure
to whole body vibration, it is adapted from ISO 2631.1 Human Exposure to Whole
Body Vibration. The standard looks at vibrations from a health and safety point. ISO
10137, AISC/CISC DG11 and SCI P354 provide recommended peak acceleration limits
for human comfort. These limits are developed from extensive research and studies
on human perceptibility of vibrations. Barrett (2006) concluded that the tolerance
and perception levels in AISC/CISC DG11 are still relevant guides for serviceability
limits. AS1170.1-2002 notes in Section 3.1(b) that ’the imposed actions have sufficient
allowance for the effect of vertical impact arising from usual movement of people and
shifting of furniture. This allowance does not cover the effects of highly active crowds.
This is a rather loose statement open to interpretation from different readers and does
not take into account the spatial and modal properties of floor structures. Crowd
loading in supermarkets may not be as ’active’ as a concert hall or gymnasium, however
2.9 Chapter Summary and the Need for Research 21
dynamic actions is inadequate for checking the strength and serviceability of structures.
A clear need for research of dynamic actions for inclusion AS1170.1 is required.
2.9
Chapter Summary and the Need for Research
The presented literature review has documented that modal testing of bridges, floors
and many other floor type structures subject to excitation from foot traffic has been
carried out in the past. Much of this research has identified resonant frequencies, modal
parameters, damping estimates and sources of excitation for the subject structures,
some presented methods of best practice for modal testing, and comparisons of different
testing techniques.
Minimum research comparing traditional Experimental Modal Testing techniques with
up-to-date Operational Modal Testing techniques has been found. Some limitations
and biased opinions exist between the two methods. There is a clear need for a
crit-ical evaluation and comparison between the two methods, since OMA techniques are
becoming more popular due to the obvious advantages of being more time efficient
and a cheaper method of testing without the need to close the structure to traffic.
The excitation source is true to the operating conditions and true to the modal mass
and the strain levels encountered in the system. This research will present a detailed
comparison between the two methods of modal testing.
It is obvious by comparing the opinions of Hanagan et al (2003) and Barrett (2006)
that biases towards quality of modal testing data from certain testing methods exist
and the only true way to yield high quality modal parameters is through adopting
quality assurance procedures, such as those outlined by Pavic and Reynolds (2000a)
and to a limited extent Barrett (2006). Addressing these biases and opinions are beyond
the scope of this research since no modal shaker or related expensive data aquisition
system is available to the researcher at the time of the project being performed. Future
research is recommended to include a detailed comparison between test setups to set
a clear benchmark between shaker induced full scale testing and ambient vibration
testing. It is the researchers opinion that the same results will be yielded as found by
Hanagan et al (2003) where the same if not better quality can be obtained from the
2.9 Chapter Summary and the Need for Research 22
quality assurance methods adopted by the tester and not the price of the equipment
used, thereby setting a clear benchmark for up-to-date Operational Modal Analysis
and related output only ambient vibration techniques.
Some research exists where finite element models have been calibrated with parameters
extracted from experimental modal analysis. To obtain a well calibrated finite element
model for a later evaluation of excitation models and design methods, review of the
latest model updating methods has been carried out. No original developments have
been sought in this area, merely an application of existing methods is performed.
Furthermore, no up-to-date design methods were found within Australian Standards for the treatment of human induced vibrations in supermarket floor systems (or any
floor system for that matter). Some published design guides from other countries or
institutions are over-simplified and out-dated methods (Zivanovic et al. 2010). Current
research and developments found economical excitation models and design methods to
predict responses and model bridge structures under excitation from spatially
unre-stricted pedestrian traffic with varying degrees of accuracy. A need for research and
Chapter 3
Methodology and Programme
Determination of the dynamic behaviour of floor systems in service is quite complex.
In this project, an actual measured response is obtained from the modal testing of two
supermarket floor systems, whereas the numerical response is predicted using finite
element modelling. The measured responses obtained from the Imperial Centre and
Erina Fair are compared to the predicted numerical responses obtained from the finite
element modelling to validate the excitation models and to assess the serviceability
of the floor systems. The location and extent of the subject floor systems in the
Imperial Centre and Erina Fair are shown in Figure 3.1 and Figure 3.2, respectively.
The collection, analysis, processing and production of modal testing data, finite element
models and design methods are explained in this chapter.
This research project will follow a programme similar to Reynolds and Pavic (2000a),
and Barrett (2006) adaptation of the UK Dynamic Testing Agency’s four phases of
modal testing. An additional two phases to account for the extra research activities is
included. Phase five contains calibration and finite element model updating. The sixth
and final phase reviews and compares excitation models and design procedures.
This research follows the programme as listed;
1. Preparatory Phase
2. Exploratory Phase
24
4. Post Test Analysis and Parameter Estimation
5. Calibration and Model Updating
6. Review of Excitation Models, Modelling and Design Procedures
Figure 3.1: Subject floor system - Imperial Centre, Gosford NSW
3.1 Preparatory Phase 25
3.1
Preparatory Phase
In the preparatory phase an initial Finite Element Model (FEM) of the Imperial Centre
and Erina Fair is developed in Strand 7 to determine the likely dynamic properties of the
structure. The quality of the initial FEM’s are controlled by applying the appropriate
spatial properties and boundary conditions to match those found on site within the
real structure. Barrett (2006) found the initial FEM’s by the AISC/CISC method were
very close to the real structure. Natural frequencies evaluated numerically in the FEM
are monitored to ensure no large discrepancies to the initial single point acceleration
responses are found. The level of detail in the modal testing and the adequacy of
the proposed accelerometer grid is determined with the assistance of the FEM’s. The
preparation of the finite element models involves adequately representing the structural
system with an accurate spatial distribution of mass and stiffness. This is achieved by;
1. Laying out the floor geometry using the design drawings or site measurements,
assign vertical restraints at column locations, and assign end fixities, or rotational
and translation restraints that appropriately represent the connections on the end
of the members.
2. Assign member and area properties, mass properties to represent the floor slabs
(composite steel concrete and reinforced concrete).
3. Perform a preliminary ’dynamic analysis’ to predict the frequencies and mode
shapes expected in the structural systems.
The level of detail required from the modal testing is Class II and Class III testing
(Barrett, 2006). Class II testing is multi-channel response testing and class III testing
is impact induced modal testing. Clearly the benchmark class of testing in this research
is governed by the available equipment and limited to Class II testing for the ambient
vibration tests and minimum Class-III testing for the instrumented heel drop.
The location of the data centre, that is, laptop and other related equipment, although
insignificant in comparison to the mass of the structure, will be placed over the top of
columns or as close as possible to the tops of columns to avoid distorting the acquired
data. In order to adequately pick up all mode shapes of interest the accelerometers
3.2 Exploratory Phase 26
beams located on grid lines, by sweeping the accelerometers across the slab bays in the
Imperial Centre and Erina Fair, shown in Figure 3.3. This proposed 3x3 grid is used
for both the Operational Modal Analysis and Experimental Modal Analysis, where the
driving point for EMA is at . The driving point will be at midspan of all slabs. This
is a course grid, however sufficient enough to pick up the modes of interest, that is all
single bending modes. High frequency modes with two or more wave crests/troughs in
a single floor panel is not of interest in this research.
Figure 3.3: Typical 3x3 grid of driving and response points
3.2
Exploratory Phase
In the exploratory phase an initial single point ambient vibration response test is carried
out to verify that the chosen accelerometers can pick up the output vibration and verify
the optimum settings for the accelerometers, an initial single point ambient vibration
test is carried out by placing the accelerometer on the underside of a slab bay that is
known to be excitable and has a reasonable amplitude of vibration. The single point is
chosen based on common complaints of the floor slab at The Imperial Centre and by
examination of the results from the dynamic analysis of both The Imperial Centre and
3.2 Exploratory Phase 27
3.2.1 Accelerometer Suitability and Application Method
The chosen accelerometer data logger is the X2-2 by Gulf Coast Data Concepts (Gulf
Coast Data Concepts, 2014). The accelerometer sensor within the X2-2 is a Kionix
KXRB5-2050 3-axis. A 12-bit analog-to-digital converter is used to sample the output
from the Kionix KXRB5-2050 3-axis accelerometer. The sensor output is oversampled 8
times the selected sample rate and processed through a Finite Impulse Response (FIR)
filter (Gulf Coast Data Concepts, 2014). The X2-2 has two sensitivity settings, high
and low sensitivity where high gain sensitivity uses a +−1.25g range and low sensitivty gain uses a +−2g range. The USB acccelerometer operates at the USB voltage of 2.5
volts. The resulting 15 bit raw data after Analogue to Digital conversion with 32768
discrete counts covers the full range of the input voltage (0 to 2.5 volts). Each count
is 32768(1.25countsg ) = 0.000038147 volts/count. A zero g reading is written to file when
the MEMS accelerometer registers 1.25 volts, +1.25 g at +2.5 volts and -1.25g at 0
volts. In high gain mode the 15 bit raw data is provided in counts/g, and at 500mV/g
the data is converted to g acceleration by dividing by 0.0000381470.5 = 13107.2 counts/g.
The raw data is accurately time stamped and stored on a microSD card. During the
exploratory phase a single accelerometer is placed at the centre point of a slab span that
was known to be excitable in both floor systems, determined from the preliminary finite
element model in the preparatory phase. If the encountered acceleration amplitudes
are less than +−1.25g under ambient conditions, the X2-2 is set to high gain mode, for higher acceleration readings low gain mode is used. High gain mode has improved
accuracy over low gain mode because the resolution is concentrated over a smaller range
of voltage readings, whereas the resolution is spread out over a large range of voltage
readings in
The time is recorded accurately and stored on the microSD card in a comma separated
value (csv) file. The X2-2 has the option to use ”micro-resolution” (Gulf Coast Data
Concepts 2014). By using micro-resolution the X2-2 device stores time stamped data
to 0.1ms precision. At a sample rate of 512 Hz a new data record of the acceleration
magnitude is created every 5121 = 0.001953125 seconds. Using micro-resolution the time
stamps are recorded as XX.YYYYZZ where XX are seconds YYYY are accurate to 0.1
milliseconds and ZZ spurious digits that should be ignored or cropped from the data
prior to analysis. Gulf Coast Data Concepts (2014) recommend using micro-resolution
3.2 Exploratory Phase 28
to 1 milli-second.
Before installation of the X2-2 on the floor structures the real time clock (RTC) in
each accelerometer is synchronised to a computer clock. Beskhyroun and Ma (2012)
has shown that this approach immediately produces an exact synchronisation of the
RTC. As time progresses some small drift is present on the RTC in some random
accelerometer units causing a time lag between the accelerometers. This results in
an inaccurate phase angle, and a distorted mode shape estimate. This is evident in
the waterfall plot of the frequency response functions (Beskhyroun and Ma, 2012).
Note that the natural frequency and modal damping are not influenced by this drift.
Beskhyroun and Ma (2012) suggested two methods to correct the drift in the RTC,
the first method involves connecting all the accelerometers to a rigid plate and shaken
manually to produce a cyclic graph. The drift per unit time is calculated and applied
to the time history response in each unit. The second method involves calculating the
first mode frequency by peak picking and phase angles are determined. The bending of
the system in the first mode should all be in phase, the time lag can be estimated by
dividing the difference in the phase angle of each accelerometer by the natural frequency.
The first method was found to be the simplest and most reliable method because in
the second method the lag between two accelerometers can be more than one cycle of
the first mode (1/f). It should be noted that this drift was only significant when the
accelerometers were installed for a continuous 3 weeks in ambient vibration testing.
In this research the accelerometer will only be installed for a maximum of 10 minutes
for EMA and OMA, and 1 day to evaluate the serviceability, before being connected
to a computer to download and store the raw data in the csv file of the time history
response. At the end of each test the first method will be applied to check the drift in
the RTC, it is expec