5HVHDUFKRQWKH
(GXFDWLRQDO3V\FKRORJLVW
:RUNIRUFH
5HVHDUFKUHSRUW
0DUFK
Clare Lyonette, Gaby Atfield, Beate Baldauf
and David Owen, The Institute for
Employment Research, University of Warwick
Acknowledgements
Contents
Acknowledgements ... ii
Acronyms ... 3
Executive summary ... 5
1. Introduction ... 9
1.1 The research requirements ... 11
1.2 The research objectives ... 11
1.3 Report structure... 12
2. Methodology ... 13
2.1 Expert interviews ... 13
2.2 Workforce data analysis ... 14
2.3 Online survey with Principal Educational Psychologists (PEPs) ... 15
2.4 Online survey with Newly-Qualified Educational Psychologists (QEPs) ... 15
2.5 Online focus groups ... 16
2.6 Telephone interviews with other stakeholders ... 17
3. Mapping the EP workforce ... 18
3.1 Introduction ... 18
3.2 Newly-qualified EPs’ employment upon course completion ... 19
3.3 How many qualified EPs are currently working in individual LAs in England? .... 24
3.4 How is the LA EP workforce distributed in England?... 26
3.5 The demographic profile of the LA EP workforce in England ... 28
3.6 The distribution and demographics of the non-LA EP workforce in England ... 33
3.7 How many trainee EPs are on placement in each LA in England? ... 34
3.8 Conclusions ... 35
4. Understanding the drivers of EP shortages... 37
4.1 Introduction ... 37
4.2 Are LAs experiencing a shortage of EPs? ... 38
4.3 What are the drivers of EP shortages? ... 39
4.3.1 Supply-side drivers of EP shortages ... 41
4.3.2 Demand-side drivers of EP shortages ... 47
4.3.3 The combination of supply and demand-side drivers? ... 51
4.4 Conclusions ... 55
5. Possible mechanisms for addressing the shortage of EPs ... 57
5.1 Introduction ... 57
5.2 LA strategies to address shortages ... 57
5.2.1 Increasing workforce capacity ... 57
5.2.2 Reviews of service delivery and business models ... 58
5.2.3 Rationing services ... 59
5.3 Potential reforms to the training model to address shortages ... 60
5.3.2 Alternative training models ... 67
5.4 Conclusions ... 72
6. Conclusions ... 74
References ... 79
Appendices ... 80
I. Detailed methodology ... 80
I.1 Online surveys... 80
PEP survey management ... 80
PEP data analysis ... 81
QEP survey management ... 82
QEP data analysis ... 82
I.2 Focus groups and qualitative interviews ... 83
Qualitative data analysis ... 85
3
Acronyms
AEP Association of Educational Psychologists
CAMHS Child and Adolescent Mental Health Services
DfE Department for Education
DHSC Department of Health and Social Care (formerly Department of Health, DOH)
EHC plans Education, Health and Care plans
EIP Educational Inclusion and Partnership
EP Educational Psychologists
EPS Educational Psychology Services
FTE Full-time equivalent
HCPC Health and Care Professions Council
IAPT Improving Access to Psychological Therapies
ITEP Initial Training for Educational Psychologists
LA Local Authority
NAPEP National Association of Principal Educational Psychologists UK
PEP Principal Educational Psychologists
PT Part-time
QEP (Newly-) Qualified Educational Psychologists
SEN Special educational needs
SEND Special educational needs and disability
SPSS Statistical Package of the Social Sciences
4 Glossary of
selected terms Academies and
free schools Funded by central government, Academies receive additional funding to provide help for children with special educational needs. Academies and free schools were created after the Academies Act 2010 that received Royal Ascent in July 2010.
LA maintained
schools Schools funded by Local Authorities (LAs)
Traded Services Non-statutory services paid for by schools and other
organisations. A partially or fully “traded” model is one in which the existing service organisation is required to generate
income from “customers” (mainly schools) in order to meet some or all of its costs1. There has also been a corresponding
rise in EPs working within other “trading” organisations such as limited company psychological service providers, social enterprises, or as sole traders2.
1 National College for Teaching and Leadership (NCTL). (2014). Educational psychology workforce
survey: Research report April 2014. Manchester, NH: NCTL; Woods, K. (2014a). “In this together”: Developing university-workplace partnerships in initial professional training for practitioner educational psychologists. In O. McNamara, J. Murray, & M. Jones (Eds.), Teacher learning in the workplace: Widening perspectives on practice and policy. Part 2: Insights from practice across professions and nations (pp.87–102). London: Springer; Woods, K. (2014b). The preparation of practitioner educational psychologists in England. International Journal of School & Educational Psychology, 2, 198–204.
5
Executive summary
The Institute for Employment Research (IER) at the University of Warwick was commissioned by the Department for Education (DfE) to conduct research into the educational psychologist (EP) workforce in England. The main aims of the study were to:
• Map the current distribution and demographic profile of the Local Authority (LA) EP workforce in England and, where possible, also the non-LA EP workforce;
• Provide evidence on factors driving shortages of trainee and qualified EPs in LAs facing recruitment and retention difficulties;
• Inform an evidence-based decision on whether to implement a regional commissioning training model, wherein training provider places would be redistributed to broadly correspond to the number of LAs in each region.
The study took a mixed-methods approach to meeting these aims, including analysis of EP workforce data, surveys of newly-qualified EPs (QEPs) and LA principal EPs (PEPs) and telephone interviews and focus groups with key stakeholders.
Key findings
Mapping the EP workforce
• The majority of EPs are employed by LAs. Over four-fifths (85%) of QEP survey
respondents were currently employed by an LA for at least some of their work time.
• However, a common theme in interviews and focus groups with key stakeholders
and PEPs was that private practice is becoming an increasingly important source of employment for EPs. PEP survey data also showed that portfolio working across the public and private sectors is becoming more prevalent, with almost half (47%) of LA PEPs saying that some of their employees were also working in private practice.
• When asked if working for an LA was important to them, more than three quarters (78%) of QEPs currently employed by an LA said that it was very or quite important, while only 6% said that it was unimportant. The reasons given for preferring LA employment focussed on engaging with and serving a local community; the quality of colleagues; opportunities for team-working and multi-agency work; and job security and associated benefits.
6 take trainee EPs and were slightly more resilient to recruitment problems. The PEP survey showed that the majority of LAs had at least one final year trainee on placement, but almost half of those surveyed (47%) had only one.
• The Association of Educational Psychologists (AEP) monthly recruitment data
shows that public sector recruitment of EPs has fallen by a third (33%) between 2015 and 2017, from 476 to 321, which continued into 2018. Private sector recruitment doubled between 2017 and 2018 but, as it represents only about 5% of the public sector total, this doubling in recruitment from 12 to 23 provides few employment opportunities.
Understanding the drivers of EP shortages
Recruitment
• Over two-thirds (68%) of PEPs surveyed reported difficulties in recruiting to
fill vacant posts, resulting in a shortage of EPs and insufficient staff to cope with demands. Two-thirds (66%) of LA PEPs said that they had at least one vacancy for a permanent EP post and of these, 83% reported that they consistently experienced recruitment difficulties.
• However, not all LAs with vacancies were actively recruiting to fill these posts. The PEP survey highlighted that just over half (55%) of LAs with a vacancy were recruiting to fill the vacancy: feedback from PEP focus groups was that this was partly due to a consistent failure to recruit when vacancies were advertised and to uncertainty about the funding of posts.
Supply and demand factors
• The two supply-side issues most commonly cited by PEPs as driving recruitment difficulties were a lack of applicants for vacant posts (mentioned by 56% of LA PEPs in the survey) and a lack of EPs being trained (53%).
• Under-supply was also exacerbated by factors such as the availability of EP jobs
outside LAs (mentioned by 50% of LA PEPs who were experiencing recruitment difficulties).
• Location was less commonly cited as a factor: 23% of LA PEPs said that they experienced recruitment difficulties because their location was unattractive to EPs and 10% said that their distance from a training provider had an impact.
7 meant that the number of trainees graduating each year did not necessarily translate into the number of EPs who were available to work at any one time.
• Data from all sources suggested that the under-supply of EPs was exacerbated by demand factors, such as perceptions of the high workload of LA EPs (mentioned by 40% of LA PEPs experiencing recruitment difficulties) and pay levels (23%).
• Of the LA PEPs surveyed, 93% said that they were experiencing more demand
for EP services than could currently be met. The most commonly cited demand-side factor contributing to a shortage of EPs in LAs was the increase in statutory assessment work following the SEND reforms in 2014. More than three quarters of the QEPs surveyed thought that their workload was increasing (78%) and that they never seemed to have enough time to get everything done on their job (76%).
• PEPs noted that in some LAs, EPs were not only seeing an increase in their
workloads, but were also seeing a decrease in the variety of work they did due to the amount of statutory work required.
Mechanisms for addressing shortages
• The most commonly-cited demand-side mechanisms used by PEPs to help alleviate the shortfall of EPs in the short-to-medium term included increasing workforce capacity and improving the variety of work undertaken by LA EPs to improve the attractiveness of the job. Other common measures suggested by PEPs in the focus groups included increasing their pay offer and reviewing the career structure of EPs to introduce more opportunities for progression, employing more assistant EPs and recruiting trainee EPs (TEPs) before they completed their courses.
• 45% of PEPs and 49% of QEPs in the survey thought that the current training
model worked well, while 31% of PEPs and 21% of QEPs thought it was not working well. The most common responses to what did not work well related to issues around a lack of trainees being trained, the funding of placements and the geographical location of some training providers. A strong theme emerging from this research was a high level of satisfaction with the current quality of the training, the relationships between training and placement providers and the operation of the consortium system.
• There was little support from PEPs and training providers for the creation of
8 training places and distributing these to new providers, as questions were raised about the quality of new providers and the difficulties faced in building good relationships with placement providers.
• PEPs, training providers and stakeholders tended to feel strongly that a regional
training model that distributed training places based on the number of LAs local to a training provider, or the demographic characteristics of the areas served, could not adequately account for changing replacement demand when EPs retired, moved out of LA work or to different LAs, or took time out of the profession.
• The most common preference amongst PEPs and training providers
9
1. Introduction
The Institute for Employment Research (IER) at the University of Warwick was commissioned by the Department for Education (DfE) to conduct research into the educational psychologist (EP) workforce in England. The aim of the research was to gain a better understanding of the profile of the workforce, and of any recruitment and retention issues that may be addressed by future reform of the training model. This section sets out the background to the study, followed by the main aim and objectives of the research.
EPs are critical in identifying special educational needs (SEN) and providing a statutory contribution to Education, Health and Care (EHC) assessments. They also play an essential role in upskilling the education and wider workforce, thus ensuring high quality special educational needs and disability (SEND) provision is available. A fundamental part of their role is supporting the social, emotional and mental wellbeing of children and young people, families and teachers, to help address the increase in mental health problems in children and young people3.
A review held in 2016, jointly commissioned by the then Department of Health (DoH) and the DfE, the National College for Teaching and Leadership (NCTL) and NHS Health Education England (HEE), found that although Local Authorities (LAs) employ the majority of EPs, increasing numbers are employed directly by academies and other schools, the National Health Service (NHS) or as independent contractors (ibid).
To become a qualified EP, trainees are required to undertake a three-year doctoral training course, including two years on a practice placement with an LA or other organisation. The number of Initial Training for Educational Psychologists (ITEP) places has risen from 116 in 2012 to 150 in 2017 and 160 in 2018, representing an increase of 38% since 2012. In 2013, 98% of ITEP graduates had secured employment as EPs within 6 months of completion4. However, recruitment into the
profession is a recurring concern, as are problems of uneven recruitment across England. According to the National Association of Principal Educational Psychologists (NAPEP), the number of EP vacancies has been increasing (e.g. almost three quarters of LAs reported vacancies in 20155), and both the public and private sectors report
difficulties in filling vacancies. The number of services experiencing difficulties in
3 National College for Teaching and Leadership (NCTL) and NHS Health Education England (HEE)
(2016) Review of clinical and educational psychology training arrangements March 2016. https://www.gov.uk/government/uploads/system/uploads/attachment_data/file/510725/Review_of_clini cal_and_educational_psychology_training_arrangements_report.pdf
4 National College for Teaching and Leadership (NCTL) and NHS Health Education England (HEE)
(2016) ibid.
5 NAPEP National Executive Committee (2015) The Educational Psychology Workforce Survey 2015,
10 recruiting rose by 10% from 2013, with a 20% increase since 20126. However, it must
be noted that these workforce surveys are limited, since they cover only 70% of all LAs.
According to different data sources, the proportion of LAs with vacancies that were hard to fill ranges from 43%7 to 67%8. Numerous reasons have been suggested in
publications by NAPEP (2015), the National College for Teaching and Learning (NCTL) and the DfE (2012 and 2013), NCTL and NHS Health Education England (HEE) (2016) and other published sources, including the Local Government Association, for these recruitment (and retention) difficulties, including:
• Greater demand for EPs, partly due to increasing statutory duties including the introduction of the 2014 SEND reforms (including the introduction of the EHC plan process and expansion of the age range covered by SEN provision) and other policy developments in Improving Access to Psychological Therapy (IAPT), Education and Inclusion Partnership (EIP) and Child and Adolescent Mental Health Services (CAMHS);
• Inadequate number and/or poor-quality9 of applicants for employment, partly
caused by moving to three-year training courses and recruitment gaps caused by public sector freezes;
• An overall shortage of EPs being trained;
• Increased competition for EP services due to increases in traded services and staff
working for more than one provider;
• Changes to staff pay and conditions, and increasing workloads, making the profession less attractive;
• An ageing workforce, with greater numbers retiring or due to retire;
6 NAPEP National Executive Committee (2015) ibid.
7 Truong, Y. and Ellam, H. (2014) Educational Psychology Workforce Survey 2013. National College
for Teaching and Leadership (NCTL) & DfE.
http://dera.ioe.ac.uk/19840/1/RR338_-_Educational_Psychology_Workforce_Survey_April_2013.pdf This represents an increase of 10% from 33% in 2012.
8 Local Government Association, 2014. Soulbury pay and workforce survey 2013.
https://www.local.gov.uk/sites/default/files/documents/soulbury-survey-report-20-967.pdf. This figure is for recruitment to the main educational psychologist grade. NAPEP (2015) ibid. give a figure of 50%, an increase of 10% from 2013 and 20% from 2012.
9 Possible poor quality of applicants is mentioned in the Soulbury reports, e.g. Local Government
Association, 2014 (ibid), but it should be noted that these report combine findings on educational
11
• Training arrangements led by DfE and the Department of Health and Social Care (DHSC) evolving relatively independently of policy-making related to SEND and Mental Health support10;
• Lack of alternative routes into the profession;
• Geographical location of some LAs, with some attracting fewer trainee EPs and qualified EPs than others.
This range of suggestions to explain the recruitment/retention difficulties highlights multiple areas where policy interventions may help to address shortages in the EP profession. However, more evidence is needed about the most appropriate level of policy intervention, including whether this should be at the national level or whether there is scope for greater devolution in the commissioning model. This report aims to contribute to this evidence base.
1.1 The research requirements
The main aim of this research is to gather evidence on the distribution and demographic characteristics of the current EP workforce – with a particular focus on the LA EP workforce - in order to map existing and projected EP shortages. It also aims to review the current training model.
1.2 The research objectives
The project has the following objectives:
• To map the current distribution and demographic profile of the LA EP workforce in England;
• Where possible, to map the current distribution and demographic profile of the non-LA EP workforce in England;
• To provide evidence on factors driving shortages of trainee and qualified EPs in LAs having recruitment and retention difficulties;
• To inform an evidence-based decision on whether to implement a regional commissioning model (wherein training provider places would be redistributed so that they broadly correspond to the number of LAs in each region) or an alternative
10 National College for Teaching and Leadership (NCTL) and NHS Health Education England (HEE)
(2016) Review of clinical and educational psychology training arrangements, March 2016.
12 solution based on the factors that have been identified as driving recruitment and retention issues.
1.3 Report structure
13
2. Methodology
A mixed-methods study was conducted, incorporating five phases.
• Phase 1 comprised a series of expert interviews with representatives from
professional bodies, training providers, Principal Educational Psychologists (PEPs) and others with an overview of the sector as a whole;
• Phase 2 involved analyses of existing EP workforce data, including data from the
Health and Care Professions Council (HCPC), the Association of Educational Psychologists (AEP) and DfE;
• Phase 3 comprised an online survey of all PEPs working in LAs;
• Phase 4 was an online survey of newly-qualified EPs (QEPs) who had graduated in the past five years;
• Phase 5 included focus groups and telephone interviews with a range of other stakeholders, including PEPs, EPs, training providers, school representatives, private EP agency representatives and SEN experts, among others.
More details on each of the study elements are provided below and in Appendix I.
All data collection tools were cleared with the University of Warwick Humanities and Social Sciences Research Ethics Committee (HSSREC) and with the DfE before any fieldwork commenced. All data collection and analysis fully complied with General Data Protection Regulation (GDPR) requirements, which came into force shortly before the project started.
2.1 Expert interviews
To obtain information on the changing pattern of organisations employing EPs and views on EP shortages, and to gauge existing EP workforce data sources, eight expert interviews, lasting between 30 and 45 minutes each, were conducted with representatives of professional bodies, schools and training providers11. The DfE
provided a list of initial contacts and others were approached as a result of recommendations from interviewees or if the original contact was unavailable. These findings fed into the design of the topic guides for later stakeholder interviews and focus groups, as well as the online survey questionnaires.
11 In order to protect the anonymity of our sources, these bodies are not named here but include all
14
2.2 Workforce data analysis
Given that the number of EPs in England is relatively small (see Table 3.5), limited information on the profession is available from statistical data sources such as the Labour Force Survey. Other sources providing data for the EP profession therefore needed to be identified that could provide information on the demographic profile (age and gender), the type of employer (LA or other organisation) or self-employment, and the geographical distribution of EPs across England.
Information about potential data sources was gathered through early expert interviews (see above). Organisational representatives were asked a) if they held comprehensive workforce data; b) if they would be willing to share their anonymised data for the purposes of the project, in line with GDPR requirements; and/or c) if they could provide requested breakdowns of data (e.g. by age group and gender). Where it was not possible to collect workforce data on these issues, the new surveys and qualitative data from this research provided more information.
Three sources were identified that could provide more information on the profile of the EP workforce:
• HCPC: The most comprehensive data is available from the HCPC as all EPs are required to register with them. The HCPC registration questionnaire asks for relevant data such as the demographic characteristics of EPs and their geographical distribution (home and/or work address) and cross-tabulated data for a range of characteristics were provided on request.
• AEP: A high percentage of EPs are members of the AEP and some of their membership data have been used here to provide additional information about the profile of their members.
• School Workforce Census: Finally, the annual DfE School Workforce Census collects data about EPs in LAs, but findings from these datasets have only been published in the form of written answers to House of Commons Parliamentary Questions. On balance, this data was not considered to be robust and was therefore excluded from this reporting.
15
2.3 Online survey with Principal Educational Psychologists
(PEPs)
The survey was designed by drawing on previous surveys such as the NCTL & DfE EP Workforce Survey (2013)12 and the 2015 NAPEP survey of EPs13 in order to review
the changing EP workforce over time. The survey set out to replicate the wording of questions drawn from the 2013 and 2015 surveys to allow comparability of data. Where there were discrepancies between the two surveys (in the terminology used to refer to trainee contracts/bursaries, for example) the 2015 questions were used as this provided comparability to the most recent data available. As well as the questions replicating the previous surveys, additional questions were included that addressed issues that have arisen following the SEND reforms, subsequent changes to EP services and other trends identified in previous surveys14.
The survey invitation and two subsequent reminders were emailed out via NAPEP, AEP, the Educational Psychology List (EPNET) and through personal networks of PEPs and training providers to all PEPs working in any of the 152 LAs across England. Overall, 95 PEPs responded, giving a response rate of approximately 63%15.
2.4 Online survey with Newly-Qualified Educational
Psychologists (QEPs)
While the PEP survey allows identification of some of the factors affecting EP employment choices, it could not provide information about how EPs make those choices. Previous research on career choices16 has shown that what people want and
believe to be possible in terms of their future career, and the factors they are willing to compromise on in order to find broadly suitable employment, often change when they enter the labour market. Consequently, an additional survey was conducted of EPs
12 Truong, Y. and Ellam, H. (2014) ibid.
13 NAPEP National Executive Committee (2015) ibid.
14 These include increases in EPs working across services and commissioners; the continuing rise of
direct commissioning by schools (particularly as a result of conversions to academy status), employment of EPs for some or most of their time by NHS services (including CAMHS, Health and Wellbeing Boards and Clinical Commissioning Groups), EPS working in social enterprises, the voluntary sector and as private consultants; and the impact of vacancy freezes and training reforms travelling through the system.
15 It is not possible to provide the total number of PEPs that the survey was issued to, and therefore not
possible to provide the true response rate for PEPs. The approximate response rate of 63% is based on the number of PEP responses compared to the number of LAs in England.
16 See, for example, Purcell, K., Elias, P., Atfield, G., Behle, H., Ellison, R., Luchinskaya, D., Snape, J.,
Conaghan, L. and Tzanakou, C. (2012) Futuretrack: Transitions into employment, further study and
16 who had qualified in the past five years, to allow further investigation of the factors that ultimately affected where EPs chose to work. This new QEP survey provided the added benefit of including EPs working in all settings, including those working in LAs, as well as those working as private self-employed EPs.
The survey invitation was distributed by training providers, via the mailing lists of professional organisations (AEP and NAPEP) and the EPNET mailing list and by PEPs to their staff, targeting all QEPs who had qualified within the last 5 years. To boost response rates, two reminders were also emailed via these organisations. The survey received 217 valid responses from QEPs,17 resulting in a response rate of
approximately 36%. Responses should be taken as indicative rather than representative.
2.5 Online focus groups
The key aim of the online focus groups was to discuss local and regional workforce issues and training commissioning models in detail.
Three focus groups with different target groups were held, with each group lasting up to 90 minutes and one giving participants the option to provide follow-up details to a named researcher. One focus group comprised representatives from a particular region with EP recruitment and retention difficulties (3 participants), one included EPs and PEPs (7 participants) and the final focus group included training providers only (8 participants).
Invitations for the first focus group were sent out with the help of DfE, while recruitment for the EP and PEP focus group took place via invitations on the AEP and NAPEP mailing lists, recommendations by DfE and targeted invitations to participants in the PEP survey who had indicated that they were willing to be contacted about participation in other parts of the research. Training providers were contacted directly via the initial contact details provided by the DfE and consortia leads. Training providers who were unable to participate in a focus group were invited to submit written answers to the focus group questions which focussed on the training model. Five training providers provided written answers. In total, 12 of the 13 training providers contributed their views to the research.
17 There were 600 DfE-funded training places available to students completing their Doctorate between
17
2.6 Telephone interviews with other stakeholders
Semi-structured telephone interviews with relevant stakeholders were conducted across a number of regions in England to explore similar issues as those in the expert interviews. Overall, 8 participants took part across 7 interviews (two stakeholders from the same organisation chose to take part together in one interview), including EPs, PEPs, training providers, representatives of schools and teachers and those with specific expertise in SEN-related issues.
For more detail on the methodology for the project, see Appendix I.
18
3. Mapping the EP workforce
3.1 Introduction
This section brings together information from a range of sources: existing EP workforce data, as well as new data gathered through an online survey with PEPs in LAs to explore EP employment in LAs, and another with QEPs to learn more about their preferences and employment patterns during the early stages of their careers.
Data on the size of the entire EP workforce are available from the HCPC as all practising EPs need to be registered with the regulator. However, as will be seen later, this does not provide comprehensive information about the type of employer which would permit a full assessment of the size of the EP workforce in LAs. Workforce data about EPs working in schools are collected annually by the DfE, as part of the School Workforce Census. This data has only been made available through parliamentary enquiries and time-series data raises questions about the robustness of this data, in part due to a significant number of LAs not submitting a response in different survey years.
With the introduction of traded services18, a wider range of organisations have evolved
to deliver Educational Psychology Services (EPS), including (publicly-funded) not-for-profit community interest companies, other private organisations and independent EPs being self-employed. LAs may also have set up a trade arm or launched a new organisation, together with other stakeholders. Thus some of the work previously undertaken by LAs may now be outsourced, in part or in full. As will be seen in Sections 3 and 4, EPs may adapt to changes in service delivery to optimise their working conditions by, for example, choosing to combine public and private work. Taking all of this into account, the following section presents data which aims to map the EP workforce. This is designed to provide context to later discussions on supply and demand issues related to recruitment and retention. This section provides data on:
• Newly-qualified EPs’ employment upon course completion;
• How many EPs are currently working in LAs in England and their contractual status; • How the EP workforce is distributed across LAs in England;
• The demographic profile of the EP workforce;
• The distribution and demographics of the non-LA EP workforce;
19
• The number of trainees currently on placement in England and the settings in which they work.
In relation to some of these issues, the data is limited or partial, and the strengths and limitations of the data are noted throughout.
3.2 Newly-qualified EPs’ employment upon
course
completion
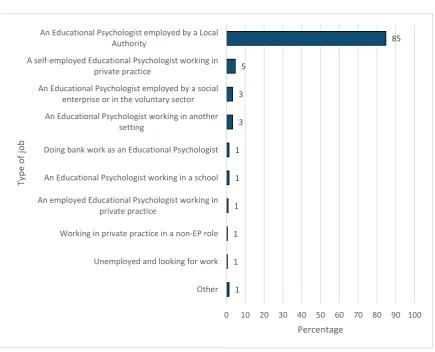
[image:21.595.81.517.356.708.2]As can be seen in Figure 3.1, data from the survey of EPs who had qualified in the past five years (QEPs) shows that the majority (85% of the 217 survey respondents) were currently employed by an LA for at least some of their work time. At this early stage in their careers, only 6% worked in some form of private practice but, as will be seen in Section 4, this pattern is less pronounced later in EPs’ careers, with increasing numbers moving into private practice, whether in a self-employed or sole-trader capacity or as an employee of a larger private provider.
Figure 3.1 Current job of EPs who qualified in the past five years
Source: Survey of Educational Psychologists who qualified in the past five years. N=217. Multiple responses indicating multiple jobs possible
85
5
3
3
1
1
1
1
1
1
0 10 20 30 40 50 60 70 80 90 100 An Educational Psychologist employed by a Local
Authority
A self-employed Educational Psychologist working in private practice
An Educational Psychologist employed by a social enterprise or in the voluntary sector An Educational Psychologist working in another
setting
Doing bank work as an Educational Psychologist
An Educational Psychologist working in a school
An employed Educational Psychologist working in private practice
Working in private practice in a non-EP role
Unemployed and looking for work
Other
Percentage
Ty
pe o
f j
20 Less than 2% of survey respondents were not employed as an EP at the time of responding or at all in the previous 5 years. In part, this is likely to reflect the requirement that trainees are employed as an EP in England for two years post-qualification or they may be required to repay their bursary, but it is also the case that at this stage in their careers, QEPs saw a range of benefits from being employed by an LA. LA employment after completion of the training programme was driven largely by choice (see below).
The placement experiences gave trainees an opportunity to find out what is important to them in their professional practice and what they are looking for in an employer after the end of the training programme. Additional detailed comments provided in the QEP survey show that preferences vary between individuals and may include type of employer, type of work, methods used, size of the work team or reputation of EPS.
“Having three placements meant I knew what I was looking for in employment and looking for to avoid. Things like how time allocations were handled, reputation of EP service with schools, overall effectiveness and vision of wider LA children’s services, how EP services were structured and managed (…), and balance of statutory and early intervention and therapeutic work were all important”. (EP who trained and worked in the South of England)
Trainees who had a placement with an LA they enjoyed or that met with their expectations were more likely to apply for a job there, in part because this facilitated transition into employment after the training programme.
“I stayed at my final year placement when I completed the training and am still there now. This enabled me to continue working with schools and staff that I already knew and made the transition into full time work as an EP much easier and reduced the stress of starting a new place of work, learning procedures etc.” (EP who trained and worked in the South East of England)
Others reported that they were looking for LA employment but were choosing a different LA after their placement that matched their preferences or to broaden their skills set.
Some had changed the type of organisation or were considering changing the type of employer as they had not enjoyed their experience.
21
employee of a large private practice”. (EP working for a Local Authority in the Midlands)
“I didn’t enjoy working in a private company. I felt like it was far less creative than the LA and I enjoyed having a larger team in the LA, there were more opportunities for informal support and supervision”. (EP working for a Local Authority in the North West)
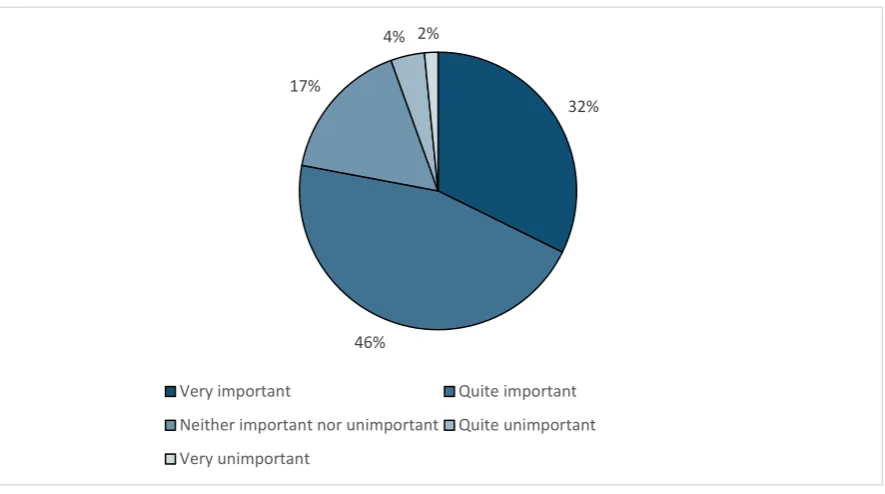
As Figure 3.2 shows, more than three quarters (78%) of QEPs currently employed by an LA said that it was very or quite important for them to be employed by an LA, while only 6% said that it was quite or very unimportant. When asked to provide more detail about the benefits of working for an LA EP service, QEPs focussed on three areas: an altruistic sense of engaging with the community and those with most need; the quality of their colleagues and their experience, including opportunities for team-working and multi-agency work; and job security and associated benefits, including pensions, paid sickness leave and maternity pay.
“It seems fairer - EP services are accessed on the basis of need across the LA rather than according to which parents can pay. Also, from a selfish perspective, the LA offers a good pension scheme”. (EP working for a Local Authority in the Midlands)
22 Figure 3.2 Whether working for a Local Authority is important to newly-qualified Educational Psychologists employed by a Local Authority
Source: Survey of Educational Psychologists who qualified in the past five years. N=184
Across the sector, almost two thirds of QEPs (63%) were working full-time in permanent jobs, although a fifth (20%) were working part-time and 6% were in temporary employment. Further detailed responses from survey participants who were working part-time showed that part-time working appeared to be largely driven by choice and was primarily related to decisions about personal work-life balance and, in some cases, returning to work after having children.
Three quarters (75%) of the EPs who responded to the survey said that the job they were doing was definitely the type of job they thought that they would go into when they were training and a further fifth said that the job was one that they were considering while they were training. Just 2% said that they did not know what kind of work they wanted to go into while they were training, a further 2% said that they had not considered doing the type of job they were currently doing and 1% said that while they were training they thought that they would not go into the kind of job they were currently doing.
Taken together, these findings suggest that educational psychology is not a profession that relies on insecure employment which causes frequent job changes (i.e. people
32%
46% 17%
4% 2%
23 are not leaving their jobs because their contract has ended)19. However, as will be
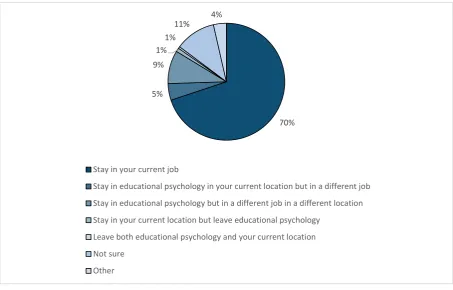
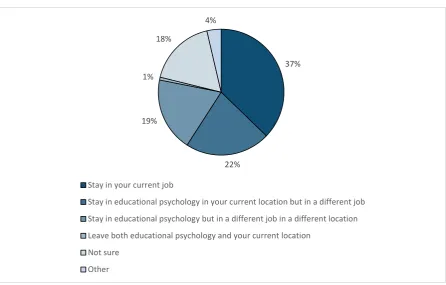
seen in Section 4, it appears to be the case that there is a certain amount of turnover as a result of people moving between jobs with permanent contracts, prompted in part by the nature of the work undertaken by EPs working in LAs. As Figures 3.3 and 3.4 show, while 70% of QEPs anticipated remaining in their current job for the next one or two years, with this figure being consistent across those in LA and non-LA employment, just over a third (37%) of those who said they would remain in their current job in the short-term thought that they would do so in the longer term20. The
[image:25.595.72.526.284.574.2]proportion of respondents in LA employment who anticipated remaining in their current job in both the short and longer term was 35%, slightly lower than average.
Figure 3.3 Career plans of newly-qualified Educational Psychologists over the next one to two years
Source: Survey of Educational Psychologists who qualified in the past five years. N=198
19 See also Section 3.3.
20 It should be noted that 22% said they would stay in Educational Psychology in their current location
but in a different job which could mean promotion within the same LA, moving into private practice or to work for another type of non-LA employer, or job changes involving working in a different LA but continuing to live in the same location.
70% 5%
9% 1%
1%
11% 4%
Stay in your current job
Stay in educational psychology in your current location but in a different job Stay in educational psychology but in a different job in a different location Stay in your current location but leave educational psychology
Leave both educational psychology and your current location Not sure
24 Figure 3.4 Longer-term career plans of newly-qualified Educational Psychologists who anticipated remaining in their current job in the short-term
Source: Survey of Educational Psychologists who qualified in the past five years. N=139
The reasons behind these findings will be discussed further in Section 4, which outlines the drivers of recruitment and retention issues.
3.3 How many qualified EPs are currently working in
individual Local Authorities in England?
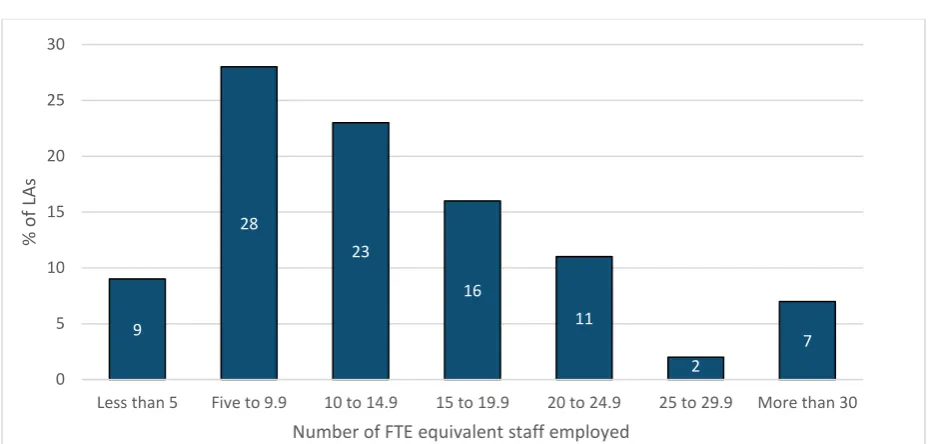
Figures provided by PEPs suggest that there is a spread in the number of EPs employed by each LA. As Figure 3.5 shows, 9% of LAs in the PEP survey employed less than five FTE EPs: at the other end of the scale, however, 7% employed more than 30 FTE and the highest number recorded was almost 58 FTE. This has an impact on the capacity of different LAs both to fund trainees and to absorb the impact of recruitment and retention issues. For example, a common view among stakeholders21
related to the particular issues faced by smaller, especially unitary, authorities outside
21 For more on stakeholders, see Section 2.6.
37%
22% 19%
1% 18%
4%
Stay in your current job
Stay in educational psychology in your current location but in a different job Stay in educational psychology but in a different job in a different location Leave both educational psychology and your current location
[image:26.595.76.523.106.391.2]25 London, simply because a larger LA has more staff to take on a share of the additional workload caused by the need to supervise trainees or to cover vacant posts.
Figure 3.5 Number of Full Time Equivalent (FTE) qualified Educational Psychologists employed by each LA
Source: Survey of Principal Educational Psychologists. N=96
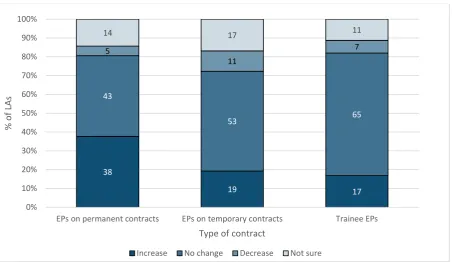
The PEP survey provided some evidence of an increase in the use of temporary contracts, but the picture is mixed across the LAs that participated in the survey (Figure 3.6). Overall, 30% of LA PEPs said that the proportion of their EP staff on temporary contracts had increased over the past five years, while 17% said that it had declined and 38% said it had stayed about the same. In addition, 19% of PEPs thought that the number of EPs they employed on temporary contracts would increase over the next year, but 38% anticipated that the number of EPs they employed on full-time contracts would increase. It should be noted that only 6% of QEPs responding to the survey were in temporary employment (63% were working full-time in permanent jobs and 20% were working part-time and, on average, each LA employs 1.8 people on a temporary contract, 0.84 as a FTE). This suggests that there has not been a significant casualisation of the profession and PEPs do not anticipate that there will be in the near future.
9
28
23
16
11
2
7
0 5 10 15 20 25 30
Less than 5 Five to 9.9 10 to 14.9 15 to 19.9 20 to 24.9 25 to 29.9 More than 30
% o
f L
As
[image:27.595.71.537.170.392.2]26 Figure 3.6 Anticipated changes to the size of each Local Authority’s Educational Psychology workforce by type of contract
Source: Survey of Principal Educational Psychologists. N=95
3.4 How is the Local Authority EP workforce distributed
across Local Authorities in England?
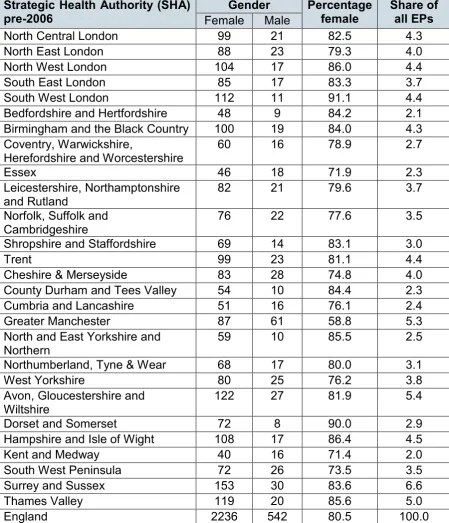
The number of male and female EPs on the HCPC register currently working within each pre-2006 Strategic Health Authority (SHA) area is presented in Table 3.122. The
numbers presented understate the total number of EPs, because this data is derived from the information provided upon registration (and not everyone stated their location of work or residence).
The regional total of EPs working in each SHA tends to be higher in southern England and other more populous parts of England, and lower in more peripheral areas. The percentage of females is highest in London (80% or more, rising to 91% in South West London) and lowest in Greater Manchester (59%). It is also lower in some SHAs neighbouring London (e.g. 71% to 72% in Essex and Kent and Medway), some more
22 It is unusual that the HCPC uses this areal framework, since SHAs have not been operational since
2005.
38
19 17
43
53 65
5
11
7
14 17 11
0% 10% 20% 30% 40% 50% 60% 70% 80% 90% 100%
EPs on permanent contracts EPs on temporary contracts Trainee EPs
% o
f L
As
Type of contract
27 peripheral SHAs (e.g. the South West Peninsula) and North-West England (75 to 76% in Cheshire and Merseyside and Cumbria and Lancashire), although still high overall.
Table 3.1 Work location of educational psychologists on HCPC register by gender, 2018
Strategic Health Authority (SHA)
pre-2006 Female Gender Male Percentage female Share of all EPs North Central London 99 21 82.5 4.3 North East London 88 23 79.3 4.0 North West London 104 17 86.0 4.4 South East London 85 17 83.3 3.7 South West London 112 11 91.1 4.4 Bedfordshire and Hertfordshire 48 9 84.2 2.1 Birmingham and the Black Country 100 19 84.0 4.3 Coventry, Warwickshire,
Herefordshire and Worcestershire 60 16 78.9 2.7
Essex 46 18 71.9 2.3
Leicestershire, Northamptonshire
and Rutland 82 21 79.6 3.7
Norfolk, Suffolk and
Cambridgeshire 76 22 77.6 3.5
Shropshire and Staffordshire 69 14 83.1 3.0
Trent 99 23 81.1 4.4
Cheshire & Merseyside 83 28 74.8 4.0 County Durham and Tees Valley 54 10 84.4 2.3 Cumbria and Lancashire 51 16 76.1 2.4 Greater Manchester 87 61 58.8 5.3 North and East Yorkshire and
Northern 59 10 85.5 2.5
Northumberland, Tyne & Wear 68 17 80.0 3.1
West Yorkshire 80 25 76.2 3.8
Avon, Gloucestershire and
Wiltshire 122 27 81.9 5.4
Dorset and Somerset 72 8 90.0 2.9 Hampshire and Isle of Wight 108 17 86.4 4.5
Kent and Medway 40 16 71.4 2.0
South West Peninsula 72 26 73.5 3.5 Surrey and Sussex 153 30 83.6 6.6
Thames Valley 119 20 85.6 5.0
England 2236 542 80.5 100.0
[image:29.595.74.524.154.678.2]28 Summarising this table to Government Office Regions (Table 3.2) emphasises the concentration of EPs in London and South-East England (each of which contains a fifth of all EPs), and enables a clearer comparison of how well the geographical distribution of EPs meets the potential demand for their services to be calculated.
[image:30.595.77.523.308.539.2]The ratio of the number of people in the age groups in which most education takes place (aged 5 to 19) to the number of EPs working in a region gives an indication of the extent to which EPs are under-represented or otherwise in any given region. The number of people aged 5 to 19 served by each EP is lowest in London, the South-West, the North-East and the South-East, and highest in Yorkshire and the Humber (more than twice as high as in London) and the East of England, suggesting some under-representation in these two regions.
Table 3.2 Educational psychologists working in each Government Office Region by gender
Government Office Region
Gender
% female
Thousand persons aged 5-19 per EP 2017
Share of EPs Male Female
East 170 49 77.6 4.9 7.9
East Midlands 181 44 80.4 3.7 8.1
London 488 89 84.6 2.7 20.8
North East 122 27 81.9 3.0 5.4 North West 221 105 67.8 3.9 11.7 South East 420 83 83.5 3.2 18.1 South West 266 61 81.3 2.8 11.8 West Midlands 229 49 82.4 3.8 10.0 Yorkshire and
The Humber 139 35 79.9 5.6 6.3
England 2236 542 80.5 3.5 100.0
Source: HCPC and ONS mid-year population estimates, 2017
3.5 The demographic profile of the Local Authority EP
workforce in England
29 gender, location of residence and workplace23, as well as the profession of
psychologists. EPs may also be registered as working as Clinical, Occupational, Forensic or Sport psychologists or in “Health” or “Counselling”.
Table 3.3 Gender profile of Educational Psychologists (2018)
Female Male Total Percentage female All Educational Psychologists with
education as a responsibility alongside others
3,756 790 4,546 82.6
Educational Psychologist only 3,697 754 4,451 83.1 Percent with non-educational roles 1.6% 4.6% 2.1% Unknown
Source: HCPC data, 2018
More than four-fifths (83%) of all EPs are female (Table 3.3; the percentage of those who are educational psychologists only is slightly higher than the overall average). Male EPs tend to be older, with only 8% per cent aged under 35 (compared to 13% for females) and the largest single age group for men (15%) is 65-69 (see Table A3, Appendix II). This can be seen in Figures 3.7 and 3.8. As will be discussed further in Section 4, the result of these changes is that the EP workforce is becoming increasingly female.
23 Registered address is also provided, but this seems to be the same as home address. Note, only
30 Figure 3.7 Age/gender breakdown for all EPs
Source: HCPC data, 2018 Total sample: males = 989; females = 3798.
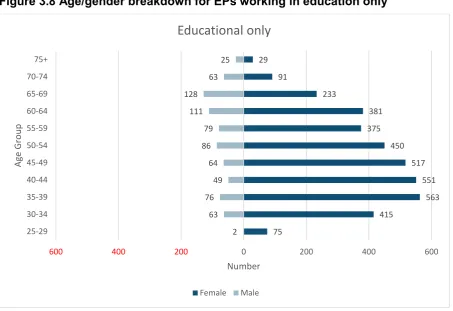
Figure 3.8 Age/gender breakdown for EPs working in education only
75 418 566 554 521 456 382 387 247 103 29 4 78 101 83 96 117 109 138 150 82 31
600 400 200 0 200 400 600 25-29 30-34 35-39 40-44 45-49 50-54 55-59 60-64 65-69 70-74 75+ Number Ag e G ro up
All
Female Male 75 415 563 551 517 450 375 381 233 91 29 2 63 76 49 64 86 79 111 128 63 25 [image:32.595.73.527.435.746.2]31
Source: HCPC data 2018 Total sample: males = 746; females = 3680.
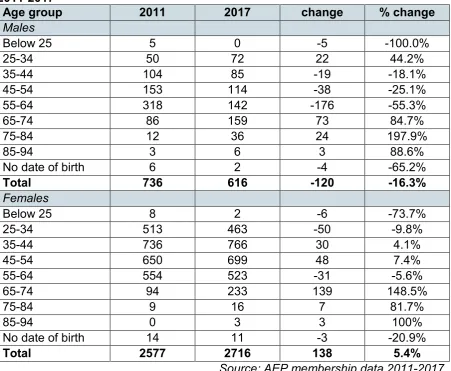
The AEP provided time-series data on their membership, which was used to provide an indication of change in the number of EPs by age and gender over time. Table 3.4 compares the mean number of members24 in 2011 and 2017 by age and gender.
[image:33.595.75.527.230.601.2]Figure 3.9 contrasts membership types by gender in 2018, showing once again that females make up the majority of all categories of membership.
Table 3.4 Change in the mean number of registered EPs by age and gender, 2011-2017
Age group 2011 2017 change % change
Males
Below 25 5 0 -5 -100.0%
25-34 50 72 22 44.2%
35-44 104 85 -19 -18.1%
45-54 153 114 -38 -25.1%
55-64 318 142 -176 -55.3%
65-74 86 159 73 84.7%
75-84 12 36 24 197.9%
85-94 3 6 3 88.6%
No date of birth 6 2 -4 -65.2%
Total 736 616 -120 -16.3%
Females
Below 25 8 2 -6 -73.7%
25-34 513 463 -50 -9.8%
35-44 736 766 30 4.1%
45-54 650 699 48 7.4%
55-64 554 523 -31 -5.6%
65-74 94 233 139 148.5%
75-84 9 16 7 81.7%
85-94 0 3 3 100%
No date of birth 14 11 -3 -20.9%
Total 2577 2716 138 5.4%
Source: AEP membership data 2011-2017. Note: AEP membership data and HCPC data are not consistent with each other. AEP totals should be smaller than HCPC because they record membership of a professional organisation while HCPC records the registrations necessary for an educational psychologist to practice.
32 Figure 3.9 AEP membership type by gender, 2018
Source: AEP membership data, 2018
As shown in Table 3.4, the number of male AEP members fell by 16% between 2011 and 2017, while the number of females increased by 5%. The increase in the number of females exceeded the decrease in males. In total, females accounted for 78% of all EPs in 2011, rising to 82% of EPs in 2017.
While the number of 55-64 year old male AEP members fell by more than half, there was a high rate of increase in the number of older male AEP members. Figure 3.10 illustrates the ageing of the AEP membership. Part of the pattern is determined by an increase in the number of retired members for both genders (Figure 3.10), but the number of male full members fell as the number of female self-employed and trainee members increased over the period 2011-2017.
The number of female AEP members fell fastest in the youngest age groups, while the number of 55-64 year olds also declined. It is unclear why these figures have changed over time. While the number of female members aged over 65 increased rapidly, it is likely that many of the older AEP members are no longer working.
2094
166 246 52
1 157
375
70 38 11 0 122
0 500 1000 1500 2000 2500
full full - self
employed trainee affiliate Assistant retired
M
ea
n me
mb
ers
hi
p i
n
20
18
33 Figure 3.10: Percentage change in AEP memberships by age and gender, 2011-2017
Source: AEP membership data 2011-2017
3.6 The distribution and demographics of the non-Local
Authority EP workforce in England
The written answer to House of Commons parliamentary question 137956 (asked by Chris Ruane on 25 April 2018) stated that in November 2016, 1,368 EPs were directly employed by LAs in England (this excludes LAs where EP provision has been outsourced or shared with other LAs)25. Though individual academies and free schools
obtain private provision, the written answer states that “information regarding the number of EPs employed in the private sector is not held centrally”26.
AEP monthly recruitment data for the public and private sector provides a further indication of where EPs work (Table 3.5). The most notable feature of the data is the fall in the level of recruitment between 2015 and 2017, from 476 to 321 in the public sector (a 33% decline) and from 28 to 12 in the private sector (a 57% decline). This decline seems to have continued for public sector recruitment into 2018, although figures are only provided up until August. For the private sector, however, the numbers increased in 2018. Private sector recruitment represents about 5% of the public sector
25 Data from the 2017 School Workforce Census has not yet been published.
26 Data from HoC written questions:
https://www.parliament.uk/business/publications/written-questions-answers-statements/written-question/Commons/2018-04-25/137956 -74 -10 4 7 -6 148 82 0 -100 44 -18 -25 -55 85 198 89 -150.0 -100.0 -50.0 0.0 50.0 100.0 150.0 200.0 250.0
Below 25 25-34 35-44 45-54 55-64 65-74 75-84 85-94
34 total, so the doubling in private sector recruitment between 2017 and 2018 provides few employment opportunities.
Table 3.5 Monthly EP recruitment totals by sector, 2015-2018 Public sector EPs
Jan Feb Mar Apr May June Jul Aug Sep Oct Nov Dec Total
2015 41 34 37 41 45 66 45 9 39 65 44 10 476
2016 19 34 29 25 36 35 23 10 30 39 47 20 347
2017 11 31 28 18 44 40 22 17 22 44 37 7 321
2018 38 22 27 35 28 27 30 8 215 Private sector EPs
Jan Feb Mar Apr May June Jul Aug Sep Oct Nov Dec Total
2015 4 5 1 6 1 3 0 0 4 4 0 0 28
2016 0 9 2 1 4 1 6 1 0 0 6 6 36
2017 0 1 2 0 0 0 0 1 1 0 4 3 12
2018 0 0 2 3 6 1 1 10 23
Source: AEP data 2015-2018
The workforce datasets provide no information on EPs working with an LA in England while also undertaking work outside an LA. The PEP survey gives some indication of the extent of this issue. Nearly half of the LA PEPs who responded to the survey (47%) stated that some of their qualified EPs were also working as private providers and 10% of LAs have outsourced at least some of their EP services to a private provider.
Nine in ten LAs (90%) were aware of non-LA EP services being provided in their area, and a third (34%) were aware of other LA-provided EP services being provided in their area. This suggests that there is some potential for private providers to draw EPs away from LA work, but, as Table 3.5 shows, the proportion of EPs working for private providers remains relatively low.
3.7 How many trainee EPs are on placement in each Local
Authority in England?
35 Table 3.6 Number of EP trainees funded each year
Year 2011 2012 2013 2014 2015 2016 2017 2018 Number
of
trainees 120 116 132 129 132 153 150 160
[image:37.595.74.525.366.589.2]Source: data provided by DfE, 2018
Figure 3.11 shows survey data on the number of Year 3 trainees that LAs were hosting on placement. Almost three quarters (73%) of LAs had at least onethird year trainee on placement, giving a total of 112 Year 3 placements. Of these, 83% were in the same organisation in their second year. Over a quarter (27%) of LAs had no third-year trainees on placement.
Figure 3.11 Number of 3rd Year placements in each LA as of October 2018
Source: Survey of Principal Educational Psychologists. N=95
3.8 Conclusions
Much of the data on the EP profession is partial or incomplete and must be drawn from various sources that do not necessarily employ the same terminology or definitions. Additionally, much of the available information is based on membership data from
27
47
18
6 1 1
0 5 10 15 20 25 30 35 40 45 50
0 1 2 3 4 5 6 7
% o
f L
As
36 professional bodies such as the AEP. While membership of the AEP is high, the exclusion of non-members from this data means that accurate figures cannot be provided on issues relating to, for example, temporary and part-time employment.
Overall, the data shows that LAs continue to be significant employers and newly-qualified EPs who took part in the survey show a preference for working for an LA, at least in the early stages of their careers. Private providers account for a relatively low share of employment. However, there is no accurate data on EPs leaving LA work to establish as sole traders or self-employed EPs, which is a common route into private practice and it is clear that there is capacity for this sector to expand and, potentially, to draw EPs away from LA work.
Educational psychology is not a profession that relies on insecure employment, but there appear to be some structural issues, such as a relatively flat career structure with limited opportunities for progression, that have the potential to cause turnover in the profession, with EPs moving between LAs and private work, as well as combining the two. These issues will be discussed in greater detail in the following section.
37
4. Understanding the drivers of EP shortages
4.1 Introduction
This section examines the evidence of shortages related to recruitment and retention in the EP profession. It then discusses the supply and demand drivers that have been identified as contributing to these shortages. It covers:
• Whether LAs are experiencing shortages of EPs;
• Whether LAs are experiencing difficulties recruiting trainees for practice placements, and whether this has a subsequent impact on recruitment of employees;
• Patterns and common factors in the supply and demand drivers underlying
shortages of EPs, including the factors affecting newly-qualified EPs’ choices of employment destinations;
• Changes in demand for EP services and the impact this has on recruitment and retention in the profession.
Under the provision of the Children and Families Act 2014, LAs were required to replace SEN statements with EHC plans by April 2018. EPs have a statutory role in providing advice or information to LAs for children who are being assessed for an EHC plan. The age range covered by SEN provision was also expanded, alongside other policy developments in Improving Access to Psychological Therapies (IAPT), Education and Inclusion Partnership (EIP) and Child and Adolescent Mental Health Services (CAMHS).
The number of pupils with SEN in England increased for a second consecutive year from 1,244,255 in January 2017 to 1,276,215 in January 2018, an increase from 14.4% to 14.6% of pupils. This followed a period of year-on-year decreases from 1,704,980 in January 2010 to 1,228,785 in 2016. Currently, 2.9% of all pupils have complex needs requiring statements of SEN or EHC plans, an increase from 2.8% in 201727.
These changes have meant additional work for EPs employed by LAs. A strong theme that emerged from the interviews and focus groups with PEPs was the impact of direct cuts to LA budgets as a result of austerity measures. Stakeholders commonly argued
38 that cuts directly affect the number of EPs employed and the number of placements offered within EP training programmes by some LAs and that some regions are more badly affected than others, a point further highlighted by PEPs who participated in the focus groups.
“We were 'hit' by austerity in the LA which reduced our capacity to be able to support TEP placements. This reduced our name within the region and we effectively became anonymous to TEPs. It's only by being able to tell the directors of education that this has to be prioritised that we have been able to become known again to the training provider and TEPs”. (PEP working in a Local Authority in the North East)
“The 'elephant in the room' is the fact that LAs have had their budgets severely cut and cannot afford the numbers of EPs they had in any case”
(PEP working in a Local Authority in the South East)
4.2 Are Local Authorities experiencing a shortage of EPs?
Shortages of EPs can occur when vacant posts cannot be filled. Data from the PEP survey shows that more than two thirds of PEPs (68%) reported experiencing difficulties recruiting to fill vacant LA posts (see Figure 4.1).
Figure 4.1 Whether Local Authorities reported experiencing difficulties recruiting to fill vacant posts
Source: Survey of Principal Educational Psychologists. N=94
68% 10%
1% 20%
[image:40.595.74.522.452.679.2]39 Overall, two thirds (66%) of PEPs surveyed reported at least one vacancy for a permanent EP post, but of these, only 55% were actively recruiting to fill any of the vacancies they had. Similarly, 18% of PEPs said that they had at least one vacancy for a temporary EP post but a higher proportion (67%) were recruiting to fill those vacancies. Participants in a focus group from an area experiencing particular difficulties were reluctant to try to recruit: they found recruitment costly and were concerned that potential employees would see they were repeatedly recruiting and consider them a less attractive employer. Moreover, other focus group participants and stakeholders tended to feel strongly that some LAs were also unable to recruit due to budget cuts or uncertainty over budgets.
Of the 66% of PEPs who said that they currently had at least one vacant post, 83% reported that they consistently experienced recruitment difficulties.
“We haven't had a full staff complement for years”. (PEP working in a Local Authority in the North East)
4.3 What are the drivers of EP shortages?
Broadly, the drivers of the shortages identified by experts, PEPs and other stakeholders interviewed as part of the research can be divided into those that are primarily related to the supply of EPs and those pertaining to changes in demand for EP services. However, as will be seen in the following sections, supply and demand issues are also interlinked.
PEPs who reported in the survey that they were experiencing recruitment difficulties were asked about all the underlying reasons and the three main reasons they thought were contributing to these difficulties. As Figure 4.2 shows, a lack of applicants was mentioned by 56%, an overall shortage of EPs being trained by 53% and competition from other providers by 50%. More than 40% saw the lack of applicants and the overall shortage as one of the three main reasons for recruitment difficulties and 20% said provider competition (not shown in Figure 4.2). Among all the reasons given, 40% also mentioned perceptions of the workload of EPs working in LAs, while fewer PEPs mentioned pay (29%), preferences for other geographical areas (23%) and non-permanent contracts being less attractive (20%).28
28 As a third of LA PEPs did not respond to the survey, it should be noted that other LAs may have
40 Figure 4.2 All reasons Local Authorities believed they were experiencing recruitment difficulties
Source: Survey of Principal Educational Psychologists. N=65. Multiple responses possible
A general theme from additional detailed information provided by PEP survey respondents also noted that an increased demand for certain EP services, such as statutory assessment work, can result in a decreased supply of EPs willing to work in that LA because they perceive the work to be repetitive and stressful.
“I think some of the difficulties are around the type of work available. I know that some authorities are restricted by funds to do statutory work only […] EPs who have moved to us from other LAs talk about workload and those kind of pressures too. Probably more retention related”. (PEP working for a Local Authority in the South East)
“LAs can suffer a downward spiral of recruitment. If EPs are lost the strain on those who are left means that more are tempted to leave (and there are usually vacancies elsewhere) and the situation escalates. A small number of EPs in a LA also means that most work will be statutory which gives much
56 53 50 40 29 23 20 10 9 7 2 17
0 20 40 60
Not enough applicants generally
An overall shortage of EPs being trained
Competition from other providers of EP services locally Perceptions of the workload of EPs working in Local
Authorities
The pay we offer
People prefer to work in other areas of the country
Temporary or fixed-term contracts are less attractive
We are not located near to any training providers
Lack of alternative routes into the profession
Poor quality applicants A shortage of EPs being trained in an appropriate
specialism
Other reason(s)
% of LAs experiencing difficulties giving this reason
[image:42.595.78.522.111.451.2]41
less work satisfaction for EPs and means they are unable to engage in preventative work”. (PEP working for a Local Authority in the South East)
4.3.1 Supply-side drivers of EP shortages
In addition to those supply-side drivers highlighted in the PEP survey, the most common supply-side drivers of EP shortages identified through the interviews and the focus groups were:
• A lack of EPs being trained and consequently a lack of EPs applying for vacancies;
• Demograp