This is a repository copy of
Photothermal conversion efficiency of nanofluids: An
experimental and numerical study
.
White Rose Research Online URL for this paper:
http://eprints.whiterose.ac.uk/106756/
Version: Accepted Version
Article:
Jin, H, Lin, G, Bai, L et al. (3 more authors) (2016) Photothermal conversion efficiency of
nanofluids: An experimental and numerical study. Solar Energy, 139. pp. 278-289. ISSN
0038-092X
https://doi.org/10.1016/j.solener.2016.09.021
© 2016. This manuscript version is made available under the CC-BY-NC-ND 4.0 license
http://creativecommons.org/licenses/by-nc-nd/4.0/
[email protected] https://eprints.whiterose.ac.uk/ Reuse
Unless indicated otherwise, fulltext items are protected by copyright with all rights reserved. The copyright exception in section 29 of the Copyright, Designs and Patents Act 1988 allows the making of a single copy solely for the purpose of non-commercial research or private study within the limits of fair dealing. The publisher or other rights-holder may allow further reproduction and re-use of this version - refer to the White Rose Research Online record for this item. Where records identify the publisher as the copyright holder, users can verify any specific terms of use on the publisher’s website.
Takedown
If you consider content in White Rose Research Online to be in breach of UK law, please notify us by
1
Photothermal Conversion Efficiency of Nanofluids: An
1Experimental and Numerical study
2Haichuan Jin
1,2Guiping Lin
1Lizhan Bai
1,2Muhammad Amjad
23
Enio Bandarra
3Dongsheng Wen2,*
4
1 Laboratory of Fundamental Science on Ergonomics and Environmental Control, School of Aeronautic Science and Engineering,
5
Beihang University, Beijing 100191, PR China
6
2 School of Chemical and Process Engineering, University of Leeds, Leeds, LS2 9JT, UK
7
3 Department of Mechanical Engineering, Federal State University of Uberlandia, Uberlandia, Brazil
8 9
Abstract: This work investigated experimentally the photothermal conversion efficiency (PTE) of
10
gold nanofluids in a cylindrical tube under natural solar irradiation conditions, and compared with a 11
developed 3-dimensional numerical model. The PTE of gold nanofluids was found to be much higher 12
than that of pure water, and increased non-linearly with particle concentration, reaching 76% at a 13
concentration of 5.8 ppm. Significant non-uniform temperature distribution was identified both 14
experimentally and numerically, and a large uncertainty can be caused in the PTE calculation by using 15
only one temperature measurement. A mathematical model was also developed to calculate the 16
absorption efficiency without knowing the temperature field, which can be used to predict the 17
theoretical PTE for nanofluids based on their optical properties only. 18
19
Keywords: nanoparticle; nanofluid; solar energy; photothermal conversion efficiency, direct
20
absorption 21
22
23 24 25
26
27
28
29
Nomenclature
30
A surface area exposed to solar radiation (m2) / absorbance (-)
31
n
a
Mie coefficient to compute the amplitudes of the scattered field (-) 32n
b
Mie coefficient to compute the amplitudes of the scattered field (-) 33c specific heat capacity (
J/ kg K
) 34p
c
specific heat capacity (J/ kg K
) 35D particle diameter (
m
) 36E spectral emissive power (
W/m
3) 37v
f
volume concentration (-) 38h convection coefficient (
W/ m
2
K
) 39I radiative intensity (
W/m
2) 40k
thermal conductivity (W/ m K
) 41f
k
imaginary part of the complex refractive index of the based fluid (-) 42L optical depth (
m
) 43m mass (
kg
) / relative refractive index (-) 44n complex refractive index (-) / order of accuracy 45
q heat flux (
W/m
2) 46Q efficiency factor for Mie scattering (-) 47
r
Q
radiative heat source in heat transfer equation 48R radius of cylinder experimental tube (m) 49
r radius in integrating process (m) 50
ˆ
s
one specific direction which contains infinitesimal pencil of rays 51T temperature (
C
) 52t time (
s
) 53x characteristic size of nanoparticles (-) 55
56
Greek symbols 57
extinction coefficient (m
-1) 58
scattering phase function 59
spectral emissivity 60
efficiency (-) 61
absorption coefficient (m
-1) 62
wavelength of light in vacuum (m
) 63
scattering coefficient (m
-1) / Stefan-Boltzmann constant =5.670 10 -8
W/ m
2K4
64
solid angle 65
density 66n
spherical Bessel function of order n 67n
spherical Bessel function of order n 6869
Superscripts 70
- average value 71
vector quantity 72Subscripts 73
abs absorption 74
amb ambient 75
b black body 76
ext extinction 77
f fluid 78
wavelength range 79i direction number of light 80
n nanoparticle 81
out outlet 82
sca scattering 84
s scattering 85
w water 86
87
1 Introduction
89
The concerns over excessive use of fossil energies and increasing environmental problems have accelerated 90
rapid development of solar energy technologies [1]. However, the difficulties in efficiently collecting solar 91
energy and converting it into useful energies (i.e., either electricity or heat) limit the extensive utilization of 92
solar energy [2]. Most of solar thermal collectors have ‘tube-in-plate’ arrangements, which absorb solar energy 93
on their surfaces and transfer heat to a working fluid running inside the tubes. Such an arrangement is 94
surface-limited, i.e., relying on the transfer of heat from a tube surface to the fluid inside. This would produce 95
a large temperature difference between the fluid and the absorber especially for high temperature applications 96
(i.e., solar thermal power plants) [3], and result in a limited solar energy utilization efficiency. 97
The concept of volumetric solar energy absorption, i.e., certain materials are seeded in a working fluid to 98
absorb solar energy directly within the fluid itself, was originated in 1970’s and coined as direct absorption 99
solar collector (DASC) [4]. In the concept, selective tube materials are used to allow most of the solar energy 100
pass through the wall and into the fluid, but prevent the radiation leakage from the fluid, forming a ‘thermal 101
trapping’ phenomenon[5]. In this way, the highest temperature exists in the fluid and the overall conversion 102
efficiency from solar energy to heat can be largely improved due to reduced re-radiation heat loss. 103
The use of nanoparticles as effective absorption media is a recent development. It has been reported that 104
adding very diluted particles into base fluid could enhance the radiative absorbing efficiency and improve the 105
overall heat transfer rate due to their large specific surface areas [6]. A range of nanoparticles including metal 106
(such as Cu, Au, and Ag), metal oxide (such as TiO2, Al2O3) and carbon materials [7–11] have been
107
investigated under laboratory [3,12–14] and natural sunlight conditions [15–17]. Some results were very 108
encouraging. For instance, the solar conversion efficiency of a 0.01% graphite nanofluid was found to be as 109
high as 122.7% of that of a conventional surface absorbing collector [12]. Some metallic nanoparticles such as 110
[18,19]. For these kinds of materials, the resonance frequencies of conduction electrons are usually in the 112
visible-light spectrum , which is weakly absorbed by most of the heat transfer fluids but occupies nearly half of 113
the total solar radiation energy [20]. Zhang et al. [14] showed that a very low concentration of gold 114
nanoparticles (i.e., mass concentration of 0.0028%) could increase the photothermal conversion efficiency 115
(PTE) of the base fluid by 20%, reaching an impressive specific absorption rate (SAR) of ~10 kW/g under 116
laboratory conditions. In another study conducted outdoor, up to 144% enhancement in the stored thermal 117
energy was obtained for 6.5 ppm silver nanoparticle-based direct absorption under natural sunlight conditions 118
[15]. However it shall be noted that only one temperature was measured in most of the published work [21–25] 119
and a uniform temperature assumption was used to calculate the energy efficiency, neglecting the temperature 120
distribution within the fluid. Considering a reduced radiative intensity along the path of the absorbing liquid, 121
there shall exist large temperature non-uniformity in the fluid, whose neglect may lead to inaccurate 122
calculations for the PTE and disguise some key parameters (such as the optical depth) in optimizing the 123
collector design. 124
Quite a few studies [3,24,26–28] have built numerical models to simulate the radiative and heat transfer 125
process in nanofluids. Unfortunately, most of these simulative studies were based on the ideal solar spectrum, 126
and ignored that the spectral emissive power distribution is affected by the atmosphere’s absorption, especially 127
in the infrared spectrum. As the radiation properties of nanoparticles are highly spectral dependent, any 128
numerical work should consider the solar spectrum associated with realistic experimental conditions. A 129
theoretical method to predict photothermal efficiency directly based on nanoparticle’s basic physical properties 130
with respect to particle loadings and optical depth has yet to be established. 131
To overcome the issues reviewed above, a detailed investigation of the photothermal conversion 132
characteristics of gold nanoparticle dispersions was conducted both experimentally and numerically. Gold 133
sunlight conditions with multiple temperature measurement. A 3-dimensional model was developed to simulate 135
the experimental results, which was followed by a parametric investigation of the influence of particle 136
concentration, solar radiation intensity and receiver geometrical parameters on the solar conversion efficiency. 137
A new method to theoretically predict the photothermal conversion efficiency of nanoparticle dispersions was 138
proposed according to the radiative transfer equation. 139
2 Experimental investigation
140
2.1 Gold nanoparticle dispersions formulation
141
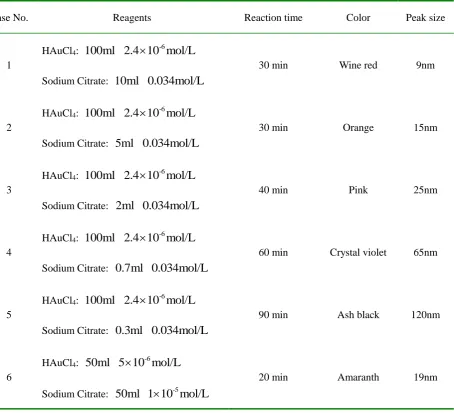
In this study, a one-step method [29] was used to produce gold nanoparticle dispersions and different 142
concentrations were prepared. A typical procedure is introduced below as an illustration, i.e., CASE 6 in Table 143
1. Here
2.5 10 mol
-7HAuCl
4 was dispersed into 50ml
DI water in a three-necked flask under144
heating. A magnetic blender was used to stir the liquid until boiling. Boiling was continued for 10 min and then 145
50 ml of
1 10 mol/L
5 sodium citrate was added. The solution turned dark blue within 30 seconds and the 146final color became wine red after being heated for an additional 20 minutes. The size and shape of CASE 6 147
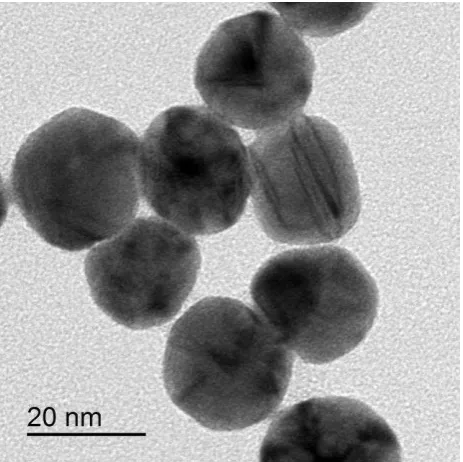
identified by a transmission electron microscopy are shown in Fig. 1a. Table. 1 represents 6 cases of gold 148
nanoparticle dispersions. The dispersions were maintained good stability for over two months, and were used 149
for the below experiments without further purification and separation. 150
An UV/Vis spectrometer (UV-1800 SHIMADZU UV Spectrophotometer) was applied to measure the 151
absorption spectrum of the nanoparticle dispersions at different concentrations. As shown in Fig. 1b, due to the 152
strong surface Plasmon resonance of gold nanoparticles in the visible light spectrum[14], a peak absorption 153
wavelength was found at 526 nm for all the dispersions, which is consistent with the TEM analysis that the 154
size of gold nanofluids was about 20 nm. According to the Beer-Lambert Law (known as Beer's Law) [30], 155
also seen in Eq. 8 below, there is a linear relationship between the absorbance and the concentration of the 156
2.2 Experimental settings
158
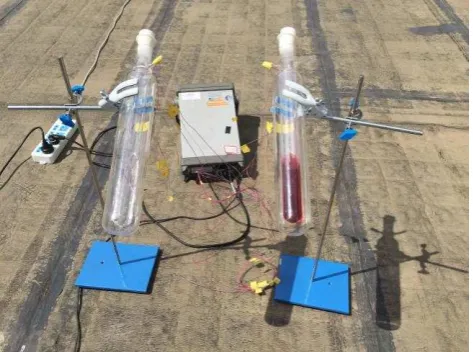
The experimental setup in this study is showed in Fig. 2a and b. The tubes used in this experiment were 159
custom-made from high temperature resistant quartz glass. The tube contained a vacuum interlayer to reduce 160
the impact of convection from outside air. The sample fluids were placed in the inside-tube with a diameter of 161
25 mm and length of 300 mm. The outside-tube had a diameter of 60 mm with two small-bore pipes, which 162
were used to fix temperature sensors. 163
As shown in Fig. 2b, three T-type thermocouples (Omega TT-T-40-SLE) with a precision of ±0.5 K were 164
placed evenly in the bottom, middle, top of the sample fluids along the optical depth, and two more 165
thermocouples were applied to measure the air inside and outside the tube (i.e., the ambient), respectively. A 166
data acquisition (Agilent 34970A) system was used to measure the thermocouple voltage signal and then 167
transferred it into digital form, recorded in a PC under LabVIEW environment. A solar radiation intensity 168
sensor was employed to measure the solar intensity, and the data was also recorded in the PC. 169
3 Experimental results analysis
170
3.1 Temperature variation
171
Example temperature curves of gold nanofluids and DI water under varied natural solar intensity are shown 172
in Fig. 3a, together with the air temperature inside and outside the tube. A slow increase in DI water 173
temperature is observed and the solar intensity (I) was varied from about 400 W/m2 to 700 W/m2. Clearly the
174
temperature variation of both water and nanofluids lags behind, but gold nanofluids show much more rapid 175
temperature increase under the same intensity than pure water. For example, the bulk temperature is increased 176
by ~21 K after 60 minutes’ heating for a GNP concentration of 5.8 ppm, more than three times of pure water 177
temperature rise. Here the average temperature from three thermocouples, i.e., (
T
T
TC1
T
TC2
T
TC3
/ 3
),178
was used to represent the fluid temperature. 179
three thermocouples for 5.8 ppm gold nanofluid and DI water respectively under the same condition as Fig. 181
3a. . Consistent large temperature difference was found for the nanofluid. A maximum 2.6 K temperature 182
difference was found for nanofluid after 28 minutes’ illumination, but for DI water, the maximum temperature 183
difference was in a relative small region (i.e., less than 0.5 K). Considering the potential large temperature 184
difference in the nanofluid, as will be revealed by the numerical model, the location of the thermocouple 185
would affect the calculated PTE significantly if only one measurement was used. 186
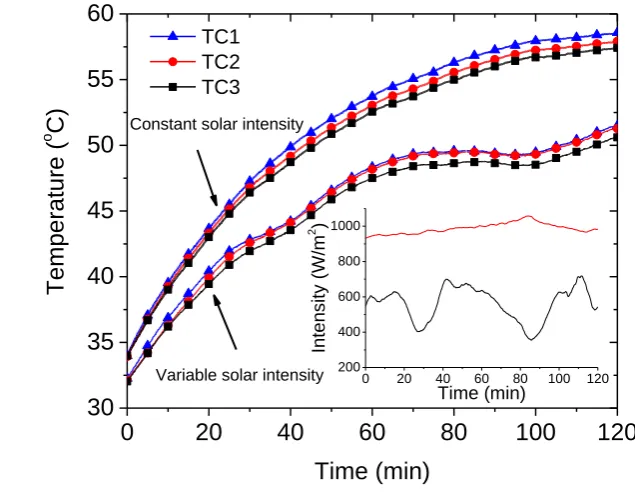
Fig. 3c shows an example of the influence of solar intensity variation on the PTE for 0.72 ppm gold
187
nanofluid. For the constant solar intensity case , the temperature increased smoothly and reached the 188
equilibrium point after two hours’ illumination; but for varied solar intensity (cloudy day), the same nanofluid 189
exhibits a changing tendency, which follows the pattern of solar intensity variation. Generally, salient 190
temperature difference among three thermocouples can be observed under both solar intensities, being larger 191
for a higher solar intensity. Further non-uniform temperature distribution and its effects on the solar efficiency 192
is discussed in section 5. 193
3.2 Efficiency and SAR
194
The average photothermal conversion efficiency (PTE) is defined as the ratio of the internal energy increase 195
of the fluid to the total incoming radiation input: 196
(
c m
w wc m
n n)
T
c m
w wT
IA t
IA
t
(1)197
where
T
is the average temperature difference (
T
=
T
TC1
T
TC2
T
TC3
/ 3
). Comparing with the198
base water, thermal energy stored in gold nanoparticles is negligible owing to extremely low concentration: i.e., 199
a maximum of 5.8 ppm in volume (0.01% in mass). 200
To quantify the capability of nanoparticles in absorbing solar energy, the specific absorption rate (SAR) is 201
w w n n
n-
w w wn
c m
c m
T
c m
T
SAR
m t
(2)203
The calculated PTEs within the measurement uncertainty of
3%
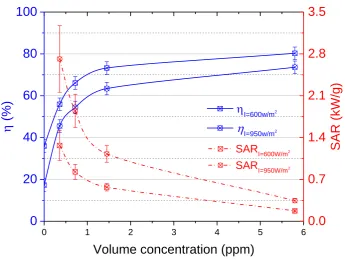
under two different solar intensities are 204shown in Fig. 4, which is in general similar to previous studies[14,15]. The PTE reaches 45.5% even at a 205
relatively low concentration (0.36 ppm), increased by 163% comparing with the base water (17.3% at 206
2
950W/m
I
). The highest PTE of gold nanofluids is 73.6%, which is more than 4 times of DI water and 207more promising than what found in previous studies [12,14,31]. The PTE increases rapidly under low particle 208
concentrations and approaches asymptotically to a constant value when the concentration reaches a certain 209
status (i.e., 1 ppm for
I
=600 W/m
2). A lower PTE value (i.e., 10% smaller) is found for the high solar 210intensity case, which is assumed to be related to an increased heat loss. Fig. 4 also shows that SAR rapidly 211
decreases with the increasing concentration below 1 ppm, and the highest SAR reaches
2.715 kW/g
at 212nanoparticle concentration of 0.36 ppm for
I
=950
W/m
2solar intensity, which is in the broad range of 213previous studies [14,15]. Further investigation with numerical results will be conducted regarding to PTE and 214
SAR in section 5. 215
4 Numerical model of direct absorbing solar energy for nanofluids
216
4.1 Solar radiation and Mie scattering theory
217
In order to get better understanding of radiative heat transfer in gold nanofluids, a numerical model was built 218
in this work. Realistic solar irradiation profile was calculated based on ASTM G173-03 Reference Spectra [32]. 219
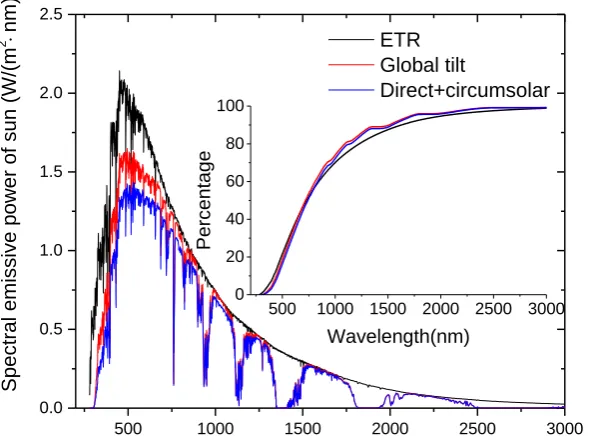
As shown in Fig. 5a, the solar irradiation on the ground is distinctly different from that at top of atmosphere, 220
especially for spectral emissive power in infrared, which is due to the intense absorption of H2O and CO2 in
221
atmosphere. The result from integrating the spectral emissive power with wavelength shows that nearly 99% of 222
solar radiation energy at sea level exists in 0.2~3
m
. As solar emissive power takes part of nearly 43% in 223infrared, which can be seen in the inset figure, considering the actual solar spectrum on the ground becomes 224
for sun (T=5762 K) and nanofluid (T=303 K) has been calculated and separated into two bands on wavelength 226
of 3
m
(see in Fig. 5b); Solar irradiation wavelength locates mainly below 3m
with a peak at 480 nm, 227while wavelength for nanofluid of 303 K is beyond 3
m
. 228In the present modeling, the characteristic size employed in radiative transfer equation is as
x
D
/
, 229where
D
represents the diameter of nanoparticles. For our experimental study, the diameter of gold 230nanoparticles is 20 nm characterized by TEM as shown in Fig. 1a. Although it is appropriate to use simplified 231
equations, i.e., the Rayleigh scattering approximation [30], to calculate the absorption coefficient, since the 232
diameter of suspended particles in the experiments are much smaller than the wavelength of irradiation 233
(
x
<<1). The original Mie scattering equations [30] is preferred to identify the optical properties for spherical 234nanoparticle suspensions in order to obtain detailed scattering parameters, such as the efficiencies for 235
scattering, absorption, backscattering, averaged absolute-square E-field. The Mie scattering equations can be 236
described by: 237
n n n n
n
n n n n
m
mx
x
x
mx
a
m
mx
x
x
mx
(2-a)238
n n n n
n
n n n n
mx
x
m
x
mx
b
mx
x
m
x
mx
(2-b)239
2
2 21
2
2
1
sca n n
n
Q
n
a
b
x
(2-c) 240
2
1
2
2
1 Re
ext n n
n
Q
n
a
b
x
(2-d) 241where the functions
n
x
and
n
x
are spherical Bessel functions[30] of order n (n= 1, 2,..) and the 242primes refer to the derivatives with respect to the argument, and m represents the ratio of refractive indexes, 243 calculated by: 244 particles fluid
n
m
n
where
n
particlesandn
fluidare the complex refractive index [33–35] of gold and based fluid relative to the 246ambient medium, respectively. In consideration of relative low concentrations of nanofluids developed for 247
solar thermal applications, particles should absorb and scatter light independently according to the scattering 248
map [30]. With such a consideration, the absorption coefficient can be calculated from the below equation: 249
=
3
4
2
f v abs p fk
f Q
D
(4)250
4.2 Radiative transfer equation and heat transfer equation
251
The property of spectral intensity can be described simultaneously by the radiative transfer equation, known 252
as RTE [30]: 253
4
ˆ
ˆ
ˆ ˆ
s
s
s ,s
4
s
b i i i
I
I
I
I
d
(5-a)254
4
4
bq
I
I d
(5-b) 255
s (5-c) 256where
I
represents the radiative intensity of wavelength range
1
2 in the directions
ˆ
i,I
b is the257
re-emission of nanofluid,
s ,s
ˆ ˆ
i is called the scattering phase function and describes the probability that 258a ray from one direction
s
ˆ
i, will be scattered into a certain other directions
ˆ
,
,
and
are the 259absorption, extinction and scattering coefficient, respectively. Spectral radiative heat flux
q
can be obtained 260by integrating the radiative intensity with the solid angle
. 261Transient heat transfer equation is shown as: 262
c
pT
c u
pT
q
Q
rt
(6-a)263
q
k T
(6-b) 264
0 r
Q
q
d
(6-c) 265The boundary condition and initial condition are: 266
4 4
contact _
-
=
amb ambair
T
t0
T
i (7-b) 268where
h
is the convection coefficient due to convection from one end of the tube contacted with air outside, 269whose contribution to the result is small and a typical value of
15 W/(m K)
2
is used in this work. 2704.3 Predicted absorption efficiency for nanofluids
271
For most of our applied particles, scattering contribution can be neglected according to the Mie theory. 272
Furthermore, the radiative equations can be simplified as a 1-dimentional transfer process. Under these 273
assumptions, an analytical solution for Eq. (6-a) can be obtained: 274
E L
( )
E
,(y 0)e
-LE
bb,(1-
e
-L)
(8)275
where
E
represents the spectral emissive power with unit ofW/m
3. In order to investigate the spectrum 276behavior at wavelength below
1.1 m
, which is the upper limit of our spectrophotometer, black body 277re-emissive radiation can be neglected due to the small intensity of re-emission, seen in Fig. 5b. Coupled with 278
Eq. 5, Eq. 9 can be further simplified as: 279
10
10
0
3
log
log
log
=
2
out abs
v
E
Q
L
e
e
f L A
E
D
(9)280
Eq.10 represents the analytic derivation process of the famous Beer-Lambert Law [30]. With these 281
assumptions, a new method is proposed to evaluate the total absorption efficiency (ABE) for a given 282
nanoparticle concentration and optical depth, which is the theoretical maximum possible photothermal 283 conversion efficiency: 284
0 3 m 3 m 0 0.2 m 0 0.2 m3 m 3 m
0 0
0.2 m 0.2 m
1 10
1
,
=
v L A L f L vE
d
E
e
d
L f
E
d
E
d
(10)285
Further investigation will be discussed in next section with experimental results. 286
4.4 Solution methodology
287
optical properties for nanofluids and photothermal conversion efficiency, with functions powered by Matlab 289
associated with COMSOL Multiphysics, similar to the one described by Kluczyk[36]. It should be noticed that 290
obtaining an analytical solution to Eqs. (6) ~ (8) is extremely difficult as the 3-dimentional transient heat 291
transfer equations coupled with transient RTE equations are complicated partial differential equations. A finite 292
element method (FEM) was employed to solve the equations numerically in COMSOL. A predefined Heat 293
Transfer with Radiation in Participating Media equations [30] together with user defined functions (radiative 294
transfer equation) were used to describe thermal and radiative energy transfer process. The discretization of the 295
simulative space was conducted with the appliance of a built-in non-structured meshing COMSOL algorithm. 296
The maximum element size inside nanofluid was chosen as 0.2 cm, and the maximum was chosen as 0.05 cm 297
for the surface with respect to radiative and convective heat loss, which mainly happens at the surface. A direct 298
solver called MUltifrontal Massively Parallel sparse direct Solver (MUMPS) with tolerance of
10
5 was 299adopted to numerically solve the matrices assembled according to the governing equations and boundary 300
conditions described above. The initial and boundary conditions were originated from experimental 301
measurement (such as temperature of inside air and the ambient). With Mie scattering, RTE, transient heat 302
transfer equations coupled with varying boundary conditions, it is very demanding on the computational power. 303
The Advanced Research Computing (ARC) at University of Leeds is used to solve the equations in in parallel. 304
5. Numerical results and comparison
305
5.1 Validation against experimental data
306
The absorption coefficients for gold nanoparticles and working fluid (water) calculated by Mie scattering 307
theory (Eqs.3-5) can be seen in Fig. 6a, where the volume concentration of gold particles is 5.8 ppm. The 308
absorption coefficient which cannot be obtained through experiments is a key parameter for 3D heat transfer 309
and radiative transfer equations. As shown in Fig. 6a, gold nanoparticles contribute the absorption in the 310
reliability of our calculation, the absorbance from numerical results based on Eq.10 is compared with 312
experimental value in Fig. 6b. The simulation result is generally in agreement with the experimental value. 313
The experimental deviation in
600~800
nm
is due to the existence of some bigger particles in the fluids, 314which could make the absorbance red shift. 315
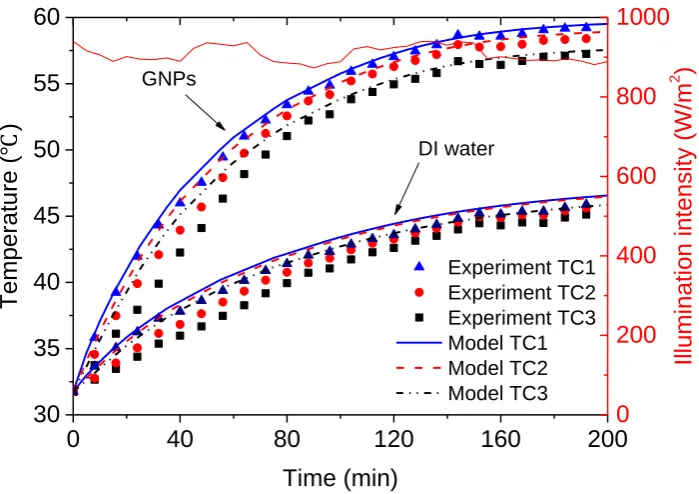
Based on experimental boundary and initial conditions, as an example, the comparison of the simulation 316
with experimental results under constant solar intensity (i.e., 950 W/m2) is shown in Fig. 7. The temperature
317
rise of 1.45 ppm gold nanofluid is much higher than that of DI water, for example ~25 K for nanofluid and ~12 318
K for water. However, both nanofluid and water exhibit non-uniform temperature distribution during the 319
illumination, as much as 4.4 K and 1.9 K temperature difference can be reached, respectively. The high 320
temperature of the top layer (TC1) shows that solar energy is mostly absorbed in the surface layer. The low 321
temperature at the bottom layer is related to effects of solar intensity decay along the optical path, and the 322
limited heat conduction capacity. After about three hours’ heating, nanofluid can maintain approximately an 323
equilibrium temperature (~ 57
C
), but for water the maximum is only ~ 45
C
, indicating that gold nanofluid 324even with very low concentration can significantly enhance the energy conversion from solar radiation to 325
thermal form. 326
5.2 Temperature distribution profile inside the tube
327
Non-uniform temperature distribution can be further demonstrated through T-profile in 3-dimensional fluid 328
(gold nanoparticles with volume concentration of 1.45 ppm, water as based fluid, under constant solar intensity, 329
i.e., 950 W/m2), which can be seen in Fig. 8a. The result in this case shows that the temperature at the up
330
middle of the tube along Y direction is higher than the bulk value. Generally, the highest temperature is located 331
inside the nanofluid volume (about 0.8 cm to the illuminated surface), for example 44
C
in this case. 332Clearly larger temperature difference (i.e., more than 6 K) for the whole considered volume can be seen in Fig. 333
8b, comparing with the 3 thermocouple measurement in Fig. 7, which illustrates the danger of using individual
measured values to calculate PTE. 335
5.3 Efficiency prediction and comparison
336
Most of the prior studies such as Andrej et al. [3] were based on experimental or simulative temperature 337
field to optimize the efficiency of nanofluid-based DASC. Here we report a mathematical method to predict 338
the absorption efficiency (ABE), which represents the maximum possible efficiency for any nanofluid-based 339
solar system, according to optical properties, seen in Eq. (11). 340
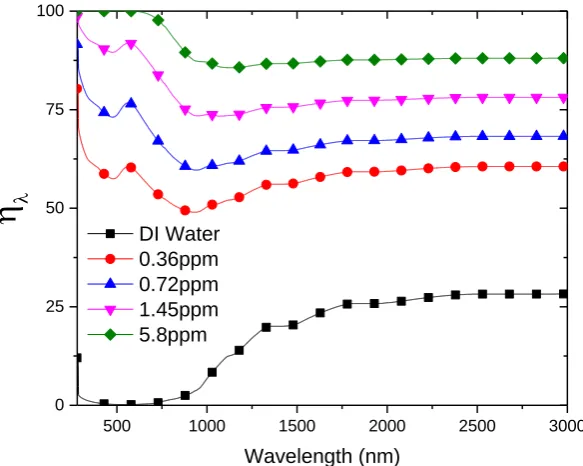
Fig. 9a shows the absorption efficient in different wavelength. Clearly comparing to the water case, much
341
higher ABE is observed for gold nanofuids across the whole solar spectrum. The spectrum ABE increases with 342
the particle concentration, and nearly 100% ABE is achieved for 5.8 ppm nanofluids in the visible light 343
spectrum, which is related to the surface plasmon resonance phenomenon of gold nanoparticles. The small 344
depression at ~900
nm
is associated with the poor absorbency performance in the near-infrared, which can 345be explained by the Mie scattering theory. 346
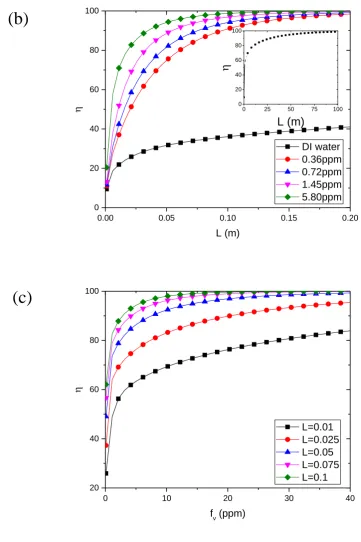
Fig. 9b and c show the ABE as a function of optical length
L
and particle concentrationf
v. The initial 347efficiency of the nanofluids receiver increases rapidly with
L
, then asymptotically reaches 100%. This result is 348similar to Zhang et al.[14]’s experimental observation, where it showed clearly that the PTE increased 349
nonlinearly with volume concentration but no proper explanation was provided. As shown in radiative transfer 350
equations (Eq. 9), the radiative transport energy is consumed inside nanofluid exponentially, and the PTE 351
should exhibit a nonlinear dependence on the particle concentration. 352
Fig. 9 also reveals the important parameters that determine the maximum possible solar receiver efficiency.
353
The impact of the optical depth L and particle concentration
f
v is embedded in the exponential term as 354v
L f
in Eq. 9. Fig. 9b reveals that both optical concentration and optical depth should be in a relative small 355values to achieve an optimized effect, as higher volume concentration of nanoparticle (i.e., more than 10 ppm 356
optical depth to reach a relative high value (i.e., 25 m for 80%). Overall, employing GNPs enhances the ABE 358
significantly compared with pure water. 359
In order to compare the prediction of ABE against experimental and simulative data (i.e., where the optical 360
depth is not a constant), a modified equation is proposed by integrating the efficiency with the radius, as: 361
3 m 2 ,
0 0 0.2 m
3 m 0 0.2 m
1
vR f r
v
E
e
d dr
f
R
E
d
(11) 362where
R
is the radius of cylindrical tube. The ABE becomes an only function of volume concentration. The 363ABE is compared with three ways of photothermal conversion efficiencies based on temperature field, i) 364
from one measured thermocouple, ii) from the average temperature measured by three thermocouples, and iii) 365
from the simulated temperature field. For the simulated data, the efficiency is obtained by considering 366
temperature difference in each computational nodes, as: 367
=
1n
w w i i i
c
V T
IA t
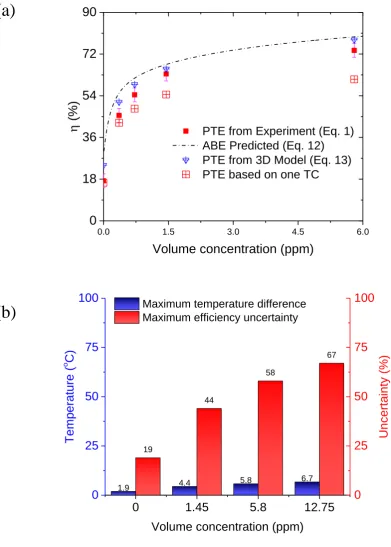
(12) 368Fig. 10a shows reasonably good agreement from four different methods. It can be expected that ABE from
369
Eq. 12 is the theoretical maximum efficiency, in which the scattering and heat leakage are not considered. It 370
can be used as an efficient method for nanoparticle selection and solar collector optimization without the need 371
of measuring the temperature field. Photothermal efficiency based only on one temperature point shows a large 372
underestimation of the PTE for all samples. For example, the PTE is 12% lower than that from the 373
experiment-determined average temperature at fv=5.8 ppm.
374
What’s more, the temperature used to determine PTE is usually at the beginning when the heat leak is not
375
significant, the temperature difference (i.e., 4.4
C
for 1.45 ppm under 950 W/m2 solar intensity) inside376
nanofluid is comparable to this temperature range (10-15
C
). Neglecting of non-uniform temperature 377efficiency. To illustrate such an effect, Fig. 10b shows the maximum differences in temperature and PTE based 379
on the simulation result under a solar intensity of 1000 W/m2 and particle size of 20 nm. Here the temperature
380
elevation employed to determine PTE is 10 K from the beginning of the experiment. Depending on the 381
measurement location, as high as 67% uncertainty could be obtained for the case of 5.8 ppm gold nanofluid. 382
The temperature non-uniformity issue will become more and more serious when the volume concentration 383
of nanofluids increases or the radiation intensity increases (i.e., under focused solar intensities). Quite a few 384
recent studies [13,16,17,37] have shown that under a focused solar light, i.e., via a typical Fresnel lens, rapid 385
steam can be produced from plasmonic nanofluids albeit the bulk solution was still under subcooled conditions. 386
In one study [16], by using very dilute gold nanoparticles (16.7 ppm) under a solar concentration of 1000 387
times, , steam generation efficiency was calculated as high as 80%, and only 20% of the absorbed solar energy 388
was used to increase the bulk fluid temperature. However, there is still a strong debate if the steam can be 389
produced around heated nanoparticles. Considering the potential large temperature difference in the fluids 390
under a focused solar intensity, there is a possibility that steam could be produced on the strongly heated 391
surface layer, where strong evaporation or even boiling can occur. Further exploration of this issue is ongoing, 392
and will be presented in the future. 393
6 Conclusions
394
Both outdoor experiments and simulation were conducted in this work to analyses the photothermal 395
conversion characteristics of gold nanofluids, and a new method was proposed to predict the theoretical 396
efficiency based only the optical properties. The main conclusions can be summarized as: 397
(1) The photothermal conversion efficiency of gold nanofluids is much higher than that of pure water, and 398
increased non-linearly with particle concentration, reaching 76% at a concentration of 5.8 ppm. 399
(2) Significant non-uniform temperature distribution was identified inside the fluid, indicating that the 400
(3) A new method was developed to predict radiative absorption efficiency based on the optical properties of 402
nanofluid, without the need of knowing the temperature field inside the fluid. The method can be used to 403
identify the performance of nanoparticles and optimize solar absorbers efficiently. 404
(4) A radiative heat transfer model coupled with the Mie scattering theory was developed. This model can 405
predict temperature profile successfully, which confirms the existence of large temperature difference inside 406
nanofluids. 407
(5) The comparison of various efficiencies shows that Eq. (11) can be used to predict the theoretical 408
maximum photothermal conversion efficiency, and using only one-point temperature measurement could cause 409
significant inaccuracy, i.e., uncertainty of 67% for 12.75 ppm gold nanofluid at 1000 W/m2 solar intensity.
410
ACKNOWLEDGEMENT
411
This work was supported by the EU Marie Curie Actions-International Incoming Fellowships 412
(FP7-PEOPLE-2013-IIF-626576), and the author Haichuan Jin also acknowledges the financial support for his 413
visiting study at the University of Leeds from the China Scholarship Council (CSC) under the Grant 414
No.201506020031. 415
References
417
[1] Sukhatme SP. Solar thermal power generation. J Chem Sci 1997;109:521–31. 418
doi:10.1007/BF02869211. 419
[2] Gupta HK, Agrawal G Das, Mathur J. An experimental investigation of a low temperature Al2O3-H2O 420
nanofluid based direct absorption solar collector. Sol Energy 2015;118:390–6. 421
doi:10.1016/j.solener.2015.04.041. 422
[3] Lenert A, Wang EN. Optimization of nanofluid volumetric receivers for solar thermal energy 423
conversion. Sol Energy 2012;86:253–65. doi:10.1016/j.solener.2011.09.029. 424
[4] Minardi JE, Chuang HN. Performance of a “black” liquid flat-plate solar collector. Sol Energy 425
1975;17:179–83. doi:10.1016/0038-092X(75)90057-2. 426
[5] Arai N, Itaya Y, Hasatani M. Development of a “volume heat-trap” type solar collector using a 427
fine-particle semitransparent liquid suspension (FPSS) as a heat vehicle and heat storage medium 428
Unsteady, one-dimensional heat transfer in a horizontal FPSS layer heated by thermal radiatio. Sol 429
Energy 1984;32:49–56. doi:10.1016/0038-092X(84)90048-3. 430
[6] Rahman MM, Al-Mazroui W a., Al-Hatmi FS, Al-Lawatia M a., Eltayeb I a. The role of a convective 431
surface in models of the radiative heat transfer in nanofluids. Nucl Eng Des 2014;275:382–92. 432
doi:10.1016/j.nucengdes.2014.05.028. 433
[7] Gan Y, Qiao L. Radiation-enhanced evaporation of ethanol fuel containing suspended metal 434
nanoparticles. Int J Heat Mass Transf 2012;55:5777–82. doi:10.1016/j.ijheatmasstransfer.2012.05.074. 435
[8] Hussain I, Graham S, Wang Z, Tan B, Sherrington DC, Rannard SP, et al. Size-controlled synthesis of 436
near-monodisperse gold nanoparticles in the 1-4 nm range using polymeric stabilizers. J Am Chem Soc 437
2005;127:16398–9. doi:10.1021/ja055321v. 438
Enhanced Light Harvesting in Dye-sensitized Solar Cells. Adv Funct Mater 2014;24:7619–26. 440
doi:10.1002/adfm.201401915. 441
[10] Mock JJ, Barbic M, Smith DR, Schultz D a., Schultz S. Shape effects in plasmon resonance of 442
individual colloidal silver nanoparticles. J Chem Phys 2002;116:6755–9. doi:10.1063/1.1462610. 443
[11] Otanicar TP, Phelan PE, Prasher RS, Rosengarten G, Taylor R a. Nanofluid-based direct absorption 444
solar collector. J Renew Sustain Energy 2010;2. doi:10.1063/1.3429737. 445
[12] Luo Z, Wang C, Wei W, Xiao G, Ni M. Performance improvement of a nanofluid solar collector based 446
on direct absorption collection (DAC) concepts. Int J Heat Mass Transf 2014;75:262–71. 447
doi:10.1016/j.ijheatmasstransfer.2014.03.072. 448
[13] Ni G, Miljkovic N, Ghasemi H, Huang X, Boriskina S V, Lin C. Volumetric solar heating of nano fl 449
uids for direct vapor generation 2015. 450
[14] Zhang H, Chen HJ, Du X, Wen D. Photothermal conversion characteristics of gold nanoparticle 451
dispersions. Sol Energy 2014;100:141–7. doi:10.1016/j.solener.2013.12.004. 452
[15] Bandarra Filho EP, Mendoza OSH, Beicker CLL, Menezes A, Wen D. Experimental investigation of a 453
silver nanoparticle-based direct absorption solar thermal system. Energy Convers Manag 454
2014;84:261–7. doi:10.1016/j.enconman.2014.04.009. 455
[16] Neumann O, Urban AS, Day J, Lal S, Nordlander P, Halas NJ. Solar vapor generation enabled by 456
nanoparticles. ACS Nano 2013;7:42–9. doi:10.1021/nn304948h. 457
[17] Neumann O, Feronti C, Neumann AD, Dong A, Schell K, Lu B, et al. Compact solar autoclave based 458
on steam generation using broadband light-harvesting nanoparticles. Proc Natl Acad Sci U S A 459
2013;110:11677–81. doi:10.1073/pnas.1310131110. 460
[18] Pérez-Juste J, Pastoriza-Santos I, Liz-Marzán LM, Mulvaney P. Gold nanorods: Synthesis, 461
doi:10.1016/j.ccr.2005.01.030. 463
[19] Eustis S, el-Sayed M a. Why gold nanoparticles are more precious than pretty gold: noble metal surface 464
plasmon resonance and its enhancement of the radiative and nonradiative properties of nanocrystals of 465
different shapes. Chem Soc Rev 2006;35:209–17. doi:10.1039/b514191e. 466
[20] Thuillier G, Hersé M, Labs D, Foujols T, Peetermans W, Gillotay D, et al. The solar spectral irradiance 467
from 200 to 2400 nm as measured by the SOLSPEC spectrometer from the ATLAS and EURECA 468
missions. Sol Phys 2003;214:1–22. doi:10.1023/A:1024048429145. 469
[21] He Q, Wang S, Zeng S, Zheng Z. Experimental investigation on photothermal properties of nanofluids 470
for direct absorption solar thermal energy systems. Energy Convers Manag 2013;73:150–7. 471
doi:10.1016/j.enconman.2013.04.019. 472
[22] Kasaeian A, Daviran S, Azarian RD, Rashidi A. Performance evaluation and nanofluid using capability 473
study of a solar parabolic trough collector. Energy Convers Manag 2015;89:368–75. 474
doi:10.1016/j.enconman.2014.09.056. 475
[23] Ladjevardi SM, Asnaghi A, Izadkhast PS, Kashani AH. Applicability of graphite nanofluids in direct 476
solar energy absorption. Sol Energy 2013;94:327–34. doi:10.1016/j.solener.2013.05.012. 477
[24] Tyagi H, Phelan P, Prasher R. Predicted Efficiency of a Low-Temperature Nanofluid-Based Direct 478
Absorption Solar Collector. J Sol Energy Eng 2009;131:041004. doi:10.1115/1.3197562. 479
[25] Yousefi T, Veysi F, Shojaeizadeh E, Zinadini S. An experimental investigation on the effect of 480
Al2O3–H2O nanofluid on the efficiency of flat-plate solar collectors. Renew Energy 2012;39:293–8. 481
doi:10.1016/j.renene.2011.08.056. 482
[26] Hordy N, Rabilloud D, Meunier J-L, Coulombe S. High temperature and long-term stability of carbon 483
nanotube nanofluids for direct absorption solar thermal collectors. Sol Energy 2014;105:82–90. 484
[27] Kabeel a. E, El-Said EMS. Applicability of flashing desalination technique for small scale needs 486
using a novel integrated system coupled with nanofluid-based solar collector. Desalination 487
2014;333:10–22. doi:10.1016/j.desal.2013.11.021. 488
[28] Khullar V, Tyagi H, Hordy N, Otanicar TP, Hewakuruppu Y, Modi P, et al. Harvesting solar thermal 489
energy through nanofluid-based volumetric absorption systems. Int J Heat Mass Transf 490
2014;77:377–84. doi:10.1016/j.ijheatmasstransfer.2014.05.023. 491
[29] Chen H-J, Wen D. Ultrasonic-aided fabrication of gold nanofluids. Nanoscale Res Lett 2011;6:198. 492
doi:10.1186/1556-276X-6-198. 493
[30] Modest MF. Radiative Heat Transfer. vol. 1. Academic Press; 2003. 494
doi:http://dx.doi.org/10.1016/B978-012503163-9/50021-7. 495
[31] Parvin S, Nasrin R, Alim M a. Heat transfer and entropy generation through nanofluid filled direct 496
absorption solar collector. Int J Heat Mass Transf 2014;71:386–95. 497
doi:10.1016/j.ijheatmasstransfer.2013.12.043. 498
[32] Gueymard CA. The sun’s total and spectral irradiance for solar energy applications and solar radiation 499
models. Sol Energy 2004;76:423–53. doi:10.1016/j.solener.2003.08.039. 500
[33] McPeak KM, Jayanti S V, Kress SJP, Meyer S, Iotti S, Rossinelli A, et al. Plasmonic Films Can Easily 501
Be Better: Rules and Recipes. ACS Photonics 2015;2:326–33. doi:10.1021/ph5004237. 502
[34] Babar S, Weaver JH. Optical constants of Cu, Ag, and Au revisited. Appl Opt 2015;54:477. 503
doi:10.1364/AO.54.000477. 504
[35] Hale GM, Querry MR. Optical Constants of Water in the 200-nm to 200-microm Wavelength Region. 505
Appl Opt 1973;12:555–63. doi:10.1364/AO.12.000555. 506
[36] Kluczyk K, Jacak W. Damping-induced size effect in surface plasmon resonance in metallic 507
(COMSOL) and Mie approach. J Quant Spectrosc Radiat Transf 2016;168:78–88. 509
doi:10.1016/j.jqsrt.2015.08.021. 510
[37] Hogan NJ, Urban AS, Ayala-Orozco C, Pimpinelli A, Nordlander P, Halas NJ. Nanoparticles heat 511
through light localization. Nano Lett 2014;14:4640–5. doi:10.1021/nl5016975. 512
Table captions:
514
Table 1 Different cases of gold nanoparticles dispersions.
515
Figure captions:
517
Fig. 1. Nanoparticle characterization: (a) TEM image of gold nanoparticles (CASE 6); (b) A: absorbance of gold nanoparticle
518
dispersions under different volume fraction; B: peak absorbance variation with concentrations in volume.
519
Fig. 2. Experimental setup: (a) Soar thermal illumination experiment under nature sunlight conditions (located on the roof of
520
Human Machine and Environment Engineering Building in Beihang University in Beijing, 39° 59' 5.49" North, 116° 21' 18.70"
521
East.); (c) A schematic illustration of experimental setup.
522
Fig. 3. (a) Temperature profile of differently diluted nanofluids under varied solar intensity (cloudy, solar intensity from about
523
400 W/m2 to 700 W/m2); (b) Experimentally obtained increasing temperature profile of TC1-TC3 located inside the tube,
524
concentration of nanofluids is 5.8 ppm and solar intensity is varied. (c) Comparison of three thermocouple signals for 0.72 ppm
525
gold nanofluid under different solar intensities: constant solar intensity (i.e., about 950 W/m2) and varied solar intensity (i.e.,
526
from 400 W/m2 to 700 W/m2).
527
Fig. 4. Variation of photothermal conversion efficiency (
) and specific absorption rate SAR with volume concentration for528
gold nanofulids under different solar intensities.
529
Fig. 5. (a) ASTM G173-03 Reference Spectra from literature, inset shows the solar energy distribution along with wavelength in
530
percentage (integrating spectral emissive power with wavelength divided by irradiation intensity). (b) Calculation of spectral
531
emissive power for sun (T=5762 K) and nanofluid (T=303 K), where spectral distribution is separated into two bands, A
532
(<3000 nm) and B (3000 nm).
533
Fig.6. (a) Real and imaginary parts of
m
( Eq. (2)) and calculated absorption coefficients for gold nanoparticles (
p), working534
fluid (
f) and total (
) according to Mie scattering theory; (b) Absorbance from Eq. (10) in comparison with results from535
spectrophotometer.
536
Fig. 7. Experimentally obtained increasing temperature profile of TC1-TC3 located inside the tube, compared with numerical
537
results from 3D model concentration of nanofluids is 1.45 ppm and solar intensity is constantly about 950 W/m2.
538
Fig. 8. (a) Schematic for numerical simulation of a 3-D volumetric solar receiver based on gold nanofluid of concentration 1.45
ppm with normal nature solar radiation I=900 W/m2, where the geometry parameters can be seen in (b), solar radiation is in -y
540
direction; (b) Temperature profiles in cross-section for nanofluid after 30 minutes’ illumination (Global Tilt) at x=0 cm.
541
Fig. 9. (a) Spectral efficiency which is defined as below in this paper:
542
0 0
0.2 m 0.2 m
= c 1 L / c
c E e d E d
; (b) Absorption efficiency (ABE) as a function of optical length L for 5543
different volume concentrations (inset: DI water); (c) ABE as a function of volume concentration fv for 5 different optical lengths.
544
Fig. 10. (a) Comparison of the experimentally obtained photothermal conversion efficiency, efficiency calculated from 3D model
545
and predicted absorption efficiency, result based on only one thermocouple; (b) Maximum efficiency uncertainty caused by
546
non-uniform temperature distribution in nanofluids.
547
Table 1 Different cases of gold nanoparticles dispersions
549
Case No. Reagents Reaction time Color Peak size
1
HAuCl4:
100ml
2.4 10 mol/L
-6Sodium Citrate:
10ml
0.034mol/L
30 min Wine red 9nm
2
HAuCl4:
100ml
2.4 10 mol/L
-6Sodium Citrate:
5ml
0.034mol/L
30 min Orange 15nm
3
HAuCl4:
100ml
-6
2.4 10 mol/L
Sodium Citrate:
2ml
0.034mol/L
40 min Pink 25nm
4
HAuCl4:
100ml
2.4 10 mol/L
-6Sodium Citrate:
0.7ml
0.034mol/L
60 min Crystal violet 65nm
5
HAuCl4:
100ml
-6
2.4 10 mol/L
Sodium Citrate:
0.3ml
0.034mol/L
90 min Ash black 120nm
6
HAuCl4:
50ml
5 10 mol/L
-6Sodium Citrate:
50ml
1 10 mol/L
-520 min Amaranth 19nm
551
552
400
500
600
700
800
900
0.0
0.5
1.0
1.5
2.0
Abs
orba
nc
e
Wavelength (nm)
DI water 0.36ppm 0.72ppm 1.45ppm 5.8ppm % (6)
A
0.00 1 2 3 4 5 60.5 1.0 1.5 2.0
Peak
Concentration (ppm)
B
[image:30.595.190.422.80.311.2]553
Fig. 1. Nanoparticle characterization: (a) TEM image of gold nanoparticles (CASE 6); (b) A: spectral-dependent absorbance of
554
gold nanofluid under different volume fractions; B: peak absorbance variation with nanoparticle concentrations.
555
556
2
3
4
5
TC2 TC3 TC4
TC5
TC1
6
1.Thermocouples 2.Nanofluid 3.
4.Data acquisition 5.
6.Vacuum interlayer
7.Solar radiative inensity sensor
7
1
[image:31.595.187.424.62.238.2]557
Fig. 2. Experimental setup: (a) Soar thermal illumination experiment under natural sunlight conditions (location 39° 59' 5.49"
558
North, 116° 21' 18.70" East.) and (b) A schematic illustration of the experimental setup.
559
(a)
0
20
40
60
80
100
120
30
35
40
45
50
55
60
Te
mpe
rature (
)
Time (min)
DI water 0.36 ppm 0.72 ppm 1.45 ppm 5.80 ppm0
200
400
600
800
1000
Solar intensityIll
umin
ation inten
sity (W/m
2)
0 20 40 60 80 100 120 30 35 40 45 50 Air_5.80 ppm Air_0.72 ppm Air_1.45 ppm Air_DI water Air_0.36 ppm Ambient 560
0
20
40
60
80
100
120
0
20
40
60
80
100
120
30
35
40
45
50
55
60
Variable solar intensity
Te
mpe
rature (
o
C)
Time (min)
TC1 TC2 TC3
Constant solar intensity
0 20 40 60 80 100 120 200
400 600 800 1000
Int
en
sity (W/m
2 )
Time (min)
562
563
Fig. 3. (a) Example temperature profile of differentnanofluids under a cloudy day (solar intensity varied from about 400 W/m2 to
564
700 W/m2); (b) Temperature profile of TC1-TC3 located inside the fluid for 5.8 ppm nanofluids in the cloudy day. (c)
565
Comparison of three thermocouple profiles for 0.72 ppm gold nanofluid under different solar intensities: constant solar
566
intensity (i.e., about 950 W/m2) and varied solar intensity (i.e., from 400 W/m2 to 700 W/m2).
567
[image:33.595.125.443.84.330.2]0 1 2 3 4 5 6
0
20
40
60
80
100
(%)
Volume concentration (ppm)
I=600w/m2
I=950w/m20.0
0.7
1.4
2.1
2.8
3.5
SARI=600W/m2
SARI=950W/m2
SAR
(kW/g)
[image:34.595.133.479.74.339.2]568
Fig. 4. Variation of photothermal conversion efficiency (
) and specific absorption rate SAR with volume concentration of569
gold nanofulids under different solar intensities.
570
572
500 1000 1500 2000 2500 3000 0.0 0.5 1.0 1.5 2.0 2.5 Spectr al e missive p ower of sun (W/( m 2 nm ))
ASTM G173-03 Reference Spectra Derived from SMARTS (nm) ETR
Global tilt
Direct+circumsolar
500 1000 1500 2000 2500 3000 0 20 40 60 80 100 Percentag e Wavelength(nm) 573
0 3000 6000 9000 12000
0 2x10⁴ 4x10⁴ 6x10⁴ 8x10⁴ 1x10⁵ Solar radiation Spectr al e missive p ower of sun (W/( m 2 nm )) Wavelength (nm)
A
B
0.000 0.025 0.050 0.075 0.100 Nanofluids radiation Spectr al e missive p ower of na no fluid (W/(m 2 nm ))0 600 1200 1800 2400 3000
0.0 2.0x10⁴ 4.0x10⁴ 6.0x10⁴ 8.0x10⁴ 1.0x10⁵
0 8000 16000 24000 32000 40000 0.00 0.01 0.02 0.03 0.04 574
Fig. 5. (a) ASTM G173-03 Reference Spectra from literature, inset shows the solar energy distribution along with wavelength in
575
percentage (integrating spectral emissive power with wavelength divided by irradiation intensity). (b) Calculation of spectral
576
emissive power for sun (T=5762 K) and nanofluid (T=303 K), where spectral distribution is separated into two bands, A
577
(<3000 nm) and B (3000 nm).
578
(a)
[image:35.595.151.451.115.337.2]500
1000
1500
2000
2500
3000
0.0
0.5
1.0
1.5
2.0
Real part
Re
fractive inde
x (Rea
l part)
Wavelength (nm)
0
5
10
15
20
Imaginary part
Re
fractive inde
x (Imagina
ry part)
0
70
140
210
280
f p
Abs
orption c
oe
ff
icien
t
(m
-1
)
579
400
500
600
700
800
900
1000
0.0
0.5
1.0
1.5
2.0
2.5
Abs
orba
nc
e
Wavelength (nm)
Mie scattering Spectrophotometer
580
Fig.6. (a) Real and imaginary parts of m ( Eq. (2)) and calculated absorption coefficients for gold nanoparticles (
p), working581
fluid (
f) and total (
) according to Mie scattering theory; (b) Absorbance from Eq. (10) in comparison with the results from582
the UV spectrophotometer.
583
(a)
0
40
80
120
160
200
30
35
40
45
50
55
60
Experiment TC1 Experiment TC2 Experiment TC3 Model TC1 Model TC2 Model TC3
Temperature (
)
Time (min)
GNPs
DI water
0
200
400
600
800
1000
Illuminatio
n intensity (W/m
2
)
[image:37.595.130.480.73.320.2]584
Fig. 7. Comparions between experimentally obtained increasing temperature profile of TC1-TC3 with numerical results from 3D
585
model (nanofluids concentration is 1.45 ppm and solar intensity is constantly ~ 950 W/m2)
586
587
(a)
-5 -4 -3 -2 -1 0 1 2 3 4 5
0 2 4 6 8 10
Z (cm
)
0 4.375
34 36 38 40 42 44 Temperature
0.52 -0.8 4.375
9.5
-0.8
34 36 38 40 42 44
Av
erage
X=
0.
52
X=
-0.
8
34 36 38 40 42 44 Average
Y=4.375 Y=9.5 Y=-0.8
588
589
Fig. 8. (a) Schematic illustration of numerical simulation of a 3-D volumetric solar receiver where the geometry parameters is
590
shown in (b) and solar radiation is in -y direction; (b) Temperature contour and cross-sectional profiles for nanofluid after 30
591
minutes’ illumination (Global Tilt, x=0 cm, gold nanofluid concentration =1.45 ppm, and solar intensity I=900 W/m2,
592
500 1000 1500 2000 2500 3000 0
25 50 75 100
Wavelength (nm) DI Water
0.36ppm 0.72ppm 1.45ppm 5.8ppm
593
[image:38.595.150.442.491.724.2]0.00 0.05 0.10 0.15 0.20 0
20 40 60 80 100
L (m)
DI water 0.36ppm 0.72ppm 1.45ppm 5.80ppm
0 25 50 75 100 0
20 40 60 80 100
L (m)
594
0 10 20 30 40
20 40 60 80 100
fv (ppm)
L=0.01 L=0.025 L=0.05 L=0.075 L=0.1
595
Fig. 9. (a) Spectral absorption efficiency at different wavelength as below in this paper:
596
0 0
0.2 m 0.2 m
= c 1 L / c
c E e d E d
; (b) Absorption efficiency (ABE) as a function of optical length L for 5597
different volume concentrations (inset: DI water); (c) ABE as a function of volume concentration fv for 5 different optical lengths.
598