Prescribed opioids in primary care:
cross-sectional and longitudinal
analyses of in
fl
uence of patient and
practice characteristics
Robbie Foy,1Ben Leaman,2Carolyn McCrorie,1Duncan Petty,1Allan House,1 Michael Bennett,1Paul Carder,3Simon Faulkner,4Liz Glidewell,1Robert West1
To cite:Foy R, Leaman B, McCrorie C,et al. Prescribed opioids in primary care: cross-sectional and longitudinal analyses of influence of patient and practice characteristics.BMJ Open2016;6:e010276. doi:10.1136/bmjopen-2015-010276
▸ Prepublication history for this paper is available online. To view these files please visit the journal online (http://dx.doi.org/10.1136/ bmjopen-2015-010276).
Received 16 October 2015 Revised 1 March 2016 Accepted 21 March 2016
1Leeds Institute of Health Sciences, University of Leeds, Leeds, UK 2Calderdale Metropolitan Borough Council, Halifax, UK 3Yorkshire & Humber Commissioning Support Unit, Bradford, UK
4Health and Social Care Information Centre, Leeds, UK
Correspondence to Dr Robbie Foy; [email protected]
ABSTRACT
Objectives:To examine trends in opioid prescribing
in primary care, identify patient and general practice characteristics associated with long-term and stronger opioid prescribing, and identify associations with changes in opioid prescribing.
Design:Trend, cross-sectional and longitudinal
analyses of routinely recorded patient data.
Setting:111 primary care practices in Leeds and
Bradford, UK.
Participants:We observed 471 828 patient-years in
which all patients represented had at least 1 opioid prescription between April 2005 and March 2012. A cross-sectional analysis included 99 847 patients prescribed opioids between April 2011 and March 2012. A longitudinal analysis included 49 065 patient-years between April 2008 and March 2012. We excluded patients with cancer or treated for substance misuse.
Main outcome measures:Long-term opioid
prescribing (4 or more prescriptions within 12 months), stronger opioid prescribing and stepping up to or down from stronger opioids.
Results:Opioid prescribing in the adult population
almost doubled for weaker opioids over 2005–2012 and rose over sixfold for stronger opioids. There was marked variation among general practices in the odds of patients stepping up to stronger opioids compared with those not stepping up (range 0.31–3.36), unexplained by practice-level variables. Stepping up to stronger opioids was most strongly associated with being underweight (adjusted OR 3.26, 1.49 to 7.17), increasing polypharmacy (4.15, 3.26 to 5.29 for 10 or more repeat prescriptions), increasing numbers of primary care appointments (3.04, 2.48 to 3.73 for over 12 appointments in the year) and referrals to specialist pain services (5.17, 4.37 to 6.12). Compared with women under 50 years, men under 50 were less likely to step down once prescribed stronger opioids (0.53, 0.37 to 0.75).
Conclusions:While clinicians should be alert to
patients at risk of escalated opioid prescribing, much prescribing variation may be attributable to clinical behaviour. Effective strategies targeting clinicians and patients are needed to curb rising prescribing, especially of stronger opioids.
BACKGROUND
There is international concern over rising trends in opioid prescribing,1–9largely attribu-ted to prescribing for chronic non-cancer pain.10 Despite known short-term efficacy of opioids in neuropathic and musculoskeletal pain, evidence is limited on longer term effects on pain, quality of life, functioning, tolerance and addiction.11–14 The degree of pain relief obtained for chronic pain is often of marginal clinical importance.15 Efficacy decreases with long-term opioid use, although dependence can make treatment withdrawal challenging.16 Prescribed opioids are associated with psycho-social problems, hospitalisation and, even for weaker opioids such as codeine, increased mor-tality.17–20 The ‘opioid epidemic’ in the USA has coincided with sharp increases in prescrip-tion opioid-related deaths and overdoses.21
There is concern that patients with chronic pain are inappropriately being moved up the WHO ‘analgesic ladder’, originally devel-oped for cancer pain, without considering alternatives to medication.22–24 Over a third of one patient cohort eventually more than
Strengths and limitations of this study
▪ Novel use of routine data to identify patient-level and practice-level characteristics associated with individual opioid prescribing trajectories.
▪ Findings based on a large sample of primary care practices and patients from diverse metro-politan populations.
▪ Identified associations cannot be assumed as casual.
▪ Exploratory work involving multiple statistical testing will have increased risk of type 1 errors and hence falsely positive associations.
doubled their original dose of opioids while around 10% were prescribed potentially hazardous high doses.23 Previous research has identified patient characteristics associated with long-term opioid prescribing, which include female gender; increasing age; comorbidities; mental health disorders; and prescribed benzodiaze-pines, anticonvulsants or antidepressants.2 23 25–29 Strong or higher dose long-term opioid prescribing is associated with female gender, middle age, socio-economic deprivation, care home residence, mood dis-orders, neuropathy, low back pain, polypharmacy, prior prescribing of weak opioids and nicotine depend-ence.9 23 30 31 Initiation of opioid prescribing is asso-ciated with higher baseline levels of pain, psychological distress, substance misuse and unhealthy lifestyles.2 32–37 However, most of these studies took place in selected patient groups, for example, trial participants or military veterans;34 37 less is known about factors associated with such trajectories in typical primary care populations.
Long-term prescribing may follow hospitalisation but usually starts in primary care.29 There are well-documented variations in wider prescribing practice and safety in UK general practice.38Structural factors such as practice list size and postgraduate general practitioner (GP) training status only marginally explain variations in high-risk prescribing ( potentially inappropriate prescrib-ing of drugs to patients vulnerable to adverse drug events)39and none in strong opioid prescribing.9
We aimed to improve understanding of patient trajec-tories towards long-term and stronger opioid prescribing in a UK primary care population. We examined trends and analysed routinely recorded primary care popula-tion data to identify patient and general practice characteristics associated with long-term prescribing, stronger opioid prescribing, and stepping up or down between weaker and stronger opioids.
METHODS
Study design and setting
First, we examined trends in opioid prescribing between 1 April 2005 and 31 March 2012 using routinely collected data from general practices in Leeds and Bradford, UK. Second, we conducted a cross-sectional analysis to iden-tify patient and practice characteristics associated with long-term and stronger opioid prescribing (April 2011 to March 2012). Third, we undertook a longitudinal analysis to examine associations with stepping up to or down from stronger opioids (April 2008 to March 2012). Leeds and Bradford have a combined population of almost 1.3 million. Leeds is typical of UK cities in terms of social deprivation indices and demographics. Bradford is more socially deprived and ethnically diverse; one-fifth of the population is of Pakistani ethnic origin.40
Study participants
There were 192 general practices in Leeds and Bradford in May 2012. We invited all 157 practices then using the
SystmOne computerised record system (http://www. tpp-uk.com/products/systmone), which permitted cen-tralised data collection, to participate. We used opt-out recruitment to reduce selection bias by facilitating general practices’ agreement to share anonymised patient data. Practices not wishing to share data could opt out. Where practices had migrated from other record systems, we included only full year data from SystmOne to ensure data completeness for the periods covered.
We collected patient data in 12-month segments span-ning April to March to ensure complete data for each Quality and Outcomes Framework (QOF) reporting
period.41 The QOF is a performance management
system whereby general practices are remunerated according to achievement of targets reflecting quality of care across four domains of clinical, organisational, patient experience and additional services. We extracted data on all patients registered with practices on 1st April who were prescribed an opioid at any point in that year. Within each 12-month segment, we excluded patients under age 18 at the start of each year, patients with a coded cancer diagnosis and patients with coded sub-stance misuse or prescribed opioids normally used
exclu-sively to treat drug addiction (methadone and
sublingual buprenorphine).
Variables
Our dependent variables comprised long-term prescrib-ing of any opioid and at least one prescription of a strong opioid at any time point. We defined long-term use as a record of four or more opioid prescriptions within a given study year, assuming an average duration of 4 weeks supply for each prescription.42–44 We cate-gorised opioid strength according to potency.45 The ‘weaker’ group included weak-to-moderate strength opioids and comprised codeine (with or without para-cetamol or ibuprofen), dihydrocodeine (with or without paracetamol), tramadol, pethidine, meptazinol and tapentadol. The ‘stronger’ opioids comprised diamor-phine, mordiamor-phine, oxycodone, fentanyl, hydromorphone, buprenorphine (excluding preparations used for sub-stance misuse), pentazocine, dipipanone and papavere-tum. We defined stronger opioid use as at least one prescription of the latter group within the year.
per week. We also included those with clinical codes indicating heavy use or referral to alcohol services. We used the most recently recorded BMI in each year and assigned patients accordingly as underweight (BMI under 18.5), normal (18.5–25), overweight (25–30) and obese (over 30).
Illness variables included pain-associated conditions and clinical presentations, mental illness and comorbid-ity. We reviewed diagnostic codes and used an iterative process (involving BL, AH, RF and DP) to categorise codes into three groups which we hypothesised might affect GPs’ prescribing behaviour: definitively diagnosed disease (eg, rheumatoid arthritis), clinical presentations without a definite diagnosis (eg, ‘knee pain’) and pain-associated syndromes with stronger psychosocial features (eg,fibromyalgia).
As a reflection of patient comorbidity and complexity, we assessed polypharmacy using the number of different repeat prescription medicines within a study year (1–4, 5–9 and 10 or more). We excluded prescriptions for dressings, stoma equipment and medically indicated food.
We assessed health service utilisation using general practice consultations, missed appointments and special-ist referrals. We could not dspecial-istinguish which type of healthcare provider patients consulted (eg, GP, practice nurse). We summed general practice consultations and missed appointments separately for each patient per annum and categorised them as low (<5), medium (between 5 and 10) and high (>10).
We categorised referrals by coded groups of destin-ation specialty: diagnostic test (eg, X-ray), medicine, musculoskeletal, neurology, specialist pain management and surgery. We excluded codes used <100 times by all participating general practices over the study period.
General practice-level variables comprised registered patient list size, numbers of partners and salaried GPs, and training status—all recorded as of 1 April 2011. We used practice-level Index of Multiple Deprivation (IMD) scores. The IMD measures area deprivation and is deter-mined for each patient on the list, where available, and then averaged over the practice. We used overall achieve-ment in the QOF clinical domain as a proxy measure for overall quality of care.
One consequence of collecting data coded within each 12-month period is that we only captured clinical codes entered within that year. For example, we could capture whether a patient was coded as having an alcohol or mental health problem within the year but not if either was coded in earlier years. Our analysis was therefore restricted to incident or rerecorded diagnoses but did not include prevalent or previous diagnoses.
Data sources
The West and South Yorkshire and Bassetlaw
Commissioning Support Unit remotely extracted data from participating SystmOne practices. The Unit also supplied information on general practice characteristics.
Analysis
For our cross-sectional study, we analysed only 2011– 2012 data to examine short-term versus long-term and stronger versus weaker opioid prescribing. This was to avoid bias that would arise from studying later samples: when practices changed from one patient record system to another (SystmOne), they only migrated live patient records, so patients that were alive early in our study period but died before the practice changed records system would have been omitted from the study.
For our longitudinal analysis of stepping up or down between weaker and stronger opioids, we assembled a cohort of patients prescribed an opioid during each of 4 years (2008–2012) and prescribed at least one strong opioid during 1 or more but not all 4 years. We excluded patients prescribed stronger opioids throughout all 4 years from the step-up analysis because they had no opportunity to step up. We excluded patients prescribed only weaker opioids from the step-down analysis since they have no opportunity to step down. We did not examine stepping up from none to weaker opioids as we lacked complete records from prior years of patients not prescribed opioids. We used thefinal 4 years of data for the analysis on trajectories for pragmatic reasons as it delivered a sufficiently large data set of patients with complete data.
We initially calculated unadjusted ORs and then adjusted for confounders and clustering of patients within practices. We modelled associations with long-term and stronger opioid prescribing using multilevel logistic regression with a random effect for practice to account for clustering of patients within practices. We found that practices coded ethnicity into 79 different categories, making analysis potentially problematic. We therefore classified ethnicity into four crudely aggre-gated groups for cross-tabulation of ethnicity with opioid strength and duration: British, Pakistani, other and unknown. We included a random term for ethnicity for the logistic regression modelling, permitting use of all of the recorded ethnicity categories. We considered this to be an efficient and appropriate way to handle this vari-able. Thus, we considered patients clustered within prac-tice and within ethnicity.
We sought a parsimonious multivariate model to ensure greater robustness of our findings. We fitted models to show effects adjusted for other covariates and excluded covariates if their effect was negligible and did not reach statistical significance at the 5% level. For adjusted ORs, if a covariate or factor was dropped to achieve a more parsimonious model, then no OR is reported.
Practice characteristics were strongly correlated with one other as expected, with the number of GPs increas-ing with list size. We also included practice IMD score in the model. Partly for simplicity of interpretation, and concerns over non-linearity, we treated all covariates as categorical variables (eg, practice IMD). We judged that
compensated for by greater ease of interpretation. We generally used an ‘unknown’ category for missing vari-ables (eg, BMI). For varivari-ables with very few missing values (eg, age), we excluded patient records as increas-ing the number of parameters would not have been suf-ficiently compensated for by including larger numbers of patient records.
We anticipated an interaction between sex and age and accounted for this in the analysis. We handled age in three categories: 18–49, 50–64 and over 65 years.
All analyses conducted used R statistical software, spe-cifically Revolution R Open V.3.2.0, with the lme4 library V.1.1.7 (R Core Team. R: A language and environment for statistical computing. Secondary R: A language and environment for statistical computing 2015. http://www. R-project.org/).46
Study size
The sample size was originally based on the assumption that we would recruit at least 70% of the then estimated 185 practices using SystmOne (later found to be only 157 practices), that is, 148 practices and around 800 000 regis-tered patients in total. We assumed the prevalence of repeat prescribing of (weaker and stronger) opioids was around 5%, and that a sample size of∼600 000 patients over 18 years of age, even after allowing for clustering within practices, would provide an accuracy within 0.5%. This was based on an estimated design effect of 50 and calculating two SDs. We anticipated that an effective patient sample size of 12 000 would provide scope to robustly estimate patient-level parameters for covariates and factors. With 148 practices, we also anticipated good scope to examine practice-level covariates, so that our models could robustly estimate up to 14 practice-level cov-ariates using the ratio of 10 observations per covariate.
RESULTS Participants
One hundred and eleven (70.7%) practices shared patient data. Participating practices had a higher median number of all registered patients compared with non-participants (7091 vs 5857; p=0.04), a higher mean number of GPs (5 vs 4; p=0.04) and similar median prac-tice IMD (33.7 vs 33.1; p=0.77).
The number of practices with available data rose from 43 in 2005–2006 to 111 in 2011–2012 (table 1). The number of patients prescribed an opioid at least once rose from 26 249 (6.6% of total adult patients) to 99 847 (12.8%) over the same period, and covered a total of 471 828 patient-years. We observed 471 828 patient-years in which all patients included had received at least one opioid prescription over the 7-year period.
For the 2011–2012 cross-sectional analysis, data for almost all patients were complete. Data on gender were unrecorded and treated as missing for three patients. Some practice-level variables were unavailable for one practice with 469 patients registered.
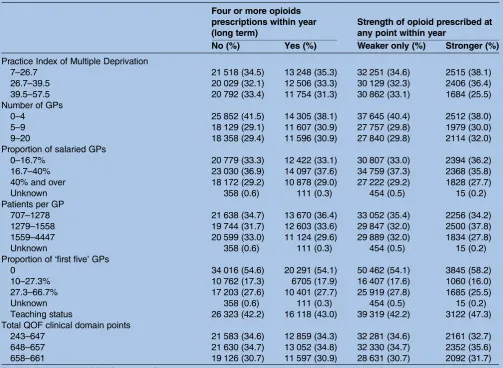
Of the sample, 60 776 (60.9%) were female, 41 016 (41.1%) aged 18–49 years at the start of the year, 26 460 (26.5%) 50–64 years and 32 371 (32.4%) 65 years or over. Most were categorised as British (55 150; 55.2%), while 11 464 (11.5%) were Pakistani, 10 802 (10.8%) other and 22 431 (22.5%) of unknown ethnicity.Table 2 summarises other patient and practice characteristics. Having earlier excluded patients with a code for cancer or treatment for substance misuse, we categorised 37 508 (37.6%) as prescribed long-term opioids, equiva-lent to 4.8% of the adult practice population. A total of 6605 (6.6%) of the sample were prescribed stronger opioids, or 0.85% of adults.
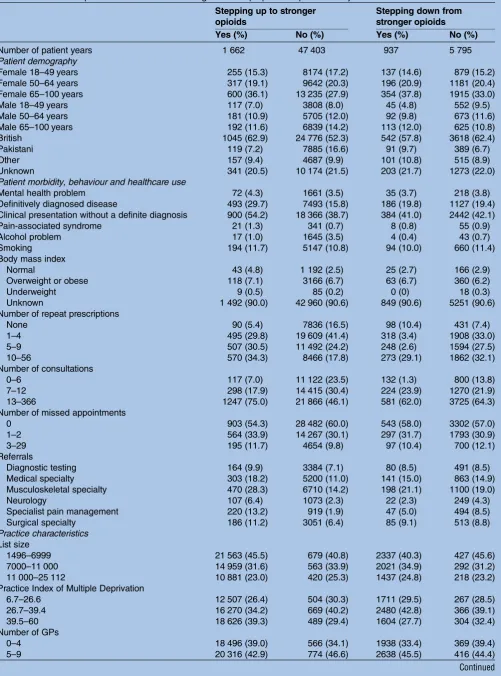
The longitudinal analysis included 17 165 patients pre-scribed any opioid in each of the 4 years considered. For the analysis of stepping up to stronger opioids, we excluded 810 patients prescribed stronger opioids for each of the first 3 years (2008–2011). Thus, there were 16 355 patients with three opportunities each to step up, or 49 065 patient-years. Of these, 32 223 (65.7%) were female, 12 354 (25.2%) aged 18–49 years, 16 343 (33.3%) 50–65 years and 20 866 (42.5%) 65 years or over. Most patient-years were British (25 821; 52.6%), while 8004 (16.3%) were Pakistani, 4844 (9.9%) other and 10 515 (21.4%) of unknown ethnicity.
For the analysis of stepping down to weaker opioids, we excluded those 14 918 patients prescribed weaker opioids in thefirst 3 years. After excluding 3 patients with incom-plete data, there were 2244 patients, or 6732 patient-years, available for the step-down analysis. Of these, 4662
(69.3%) were female, 1583 (23.5%) were aged
18–49 years, 2142 (31.8%) were 50–64 years and 3007 (44.7%) were 65 years or over. Most patient-years were British (4160; 61.8%), while 480 (7.1%) were Pakistani, 4844 (9.9%) other and 1476 (21.9%) were of unknown ethnicity. Table 3 summarises sample characteristics for the longitudinal analyses.
Prescribing trends
The proportion of all patients prescribed a weaker opioid at least once increased over 7 years from 6.5% to 12.4%, while the proportion prescribed a stronger opioid at least once increased from 0.13% to 0.85% (table 1). For patients prescribed any opioids, the pro-portion prescribed stronger opioids increased from 4.0% to 13.7%.
Cross-sectional analyses
of practice residuals and ethnicity residuals were consist-ent with the assumption that the random effects
fol-lowed Gaussian distributions for the long-term
prescribing model. The ORs for stronger against weaker-only opioid prescribing ranged from 0.50 to 2.29, further indicating a strong association between ethnicity and prescribing.
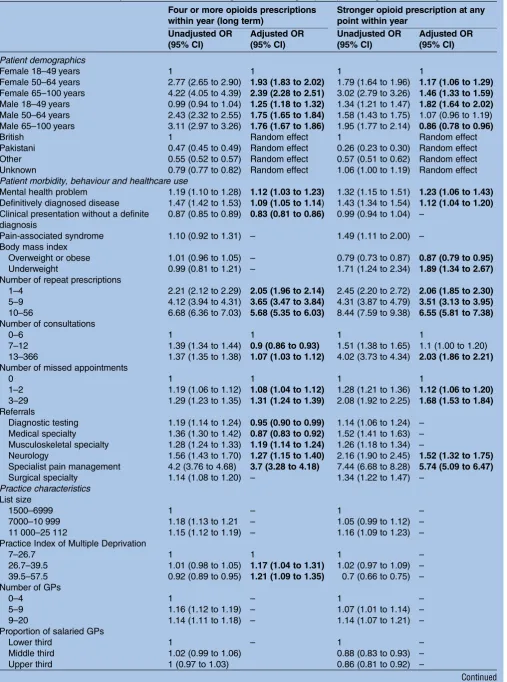
Compared with women aged 18–49 years, long-term opioid prescribing was more likely in women aged 50– 64 years (adjusted OR 1.93, 95% CI 1.83 to 2.02) as was stronger opioid prescribing (1.17, 1.06 to 1.29). These associations were respectively stronger in women 65 and over (2.39, 2.28 to 2.51; 1.46, 1.33 to 1.59).
Men below 50 years were more likely to be prescribed long-term opioids than their corresponding female age group (1.25, 1.18 to 1.32) with greater ORs for 50– 64 years (1.75, 1.65 to 1.84) and 65 and over (1.76, 1.67 to 1.86). Males aged 18–49 were more likely (1.82, 1.64 to 2.02) and those 65 and over less likely to be pre-scribed stronger opioids (0.86, 0.78 to 0.96).
We found weak associations with coded diagnoses and problems. Long-term and stronger prescribing were associated with mental health problems (1.12, 1.03 to 1.23; 1.23, 1.06 to 1.23, respectively). Long-term and stronger prescribing were also associated with defi ni-tively diagnosed disease (1.09, 1.05 to 1.14; 1.04, 1.04 to 1.20, respectively), while long-term prescribing was inversely associated with clinical presentations lacking a definitive diagnosis (0.83, 0.81 to 0.86). Being over-weight or obese was inversely associated (0.87, 0.79 to 0.95) whereas being underweight was associated with stronger opioid prescribing (1.89, 1.34 to 2.67).
Increasing polypharmacy was incrementally associated with long-term and stronger opioid prescribing, with adjusted ORs of 5.68 (5.35 to 6.03) and 6.55 (5.81 to 7.38), respectively, for those having 10 or more repeat prescriptions.
Relative to patients attending up to 6 primary care appointments over the year, those with 7–12 appoint-ments were less likely to be prescribed long-term opioids (0.90, 0.86 to 0.93), while those attending 12 or more appointments were more likely to be prescribed long-term and stronger opioids (1.07, 1.03 to 1.12; 2.03, 1.86 to 2.21, respectively). Long-term and stronger prescrib-ing were also both more likely if patients had missed booked primary care appointments, with the respective ORs rising from 1.08 (1.04 to 1.12) and 1.12 (1.06 to 1.20) for one to two missed appointments to 1.31 (1.24 to 1.39) and 1.68 (1.53 to 1.84) for three or more.
Long-term prescribing was less likely for patients referred for diagnostic tests (0.95, 0.90 to 0.99) and to general medicine (0.87, 0.83 to 0.92) and more likely for those referred to musculoskeletal services (1.19, 1.14 to 1.24). Long-term and stronger opioid prescribing were associated with referrals to neurology (1.27, 1.15 to 1.40; 1.52, 1.32 to 1.75, respectively) and specialist pain management services (3.70, 3.28 to 4.18; 5.74, 5.09 to 6.47, respectively). T able 1 Pr a ctices, pa tients and opi oid pr escribing o v er 2005 – 2012 Y ear
Number of pra
ctices
Number of pa
tients Number of pa tients pr escr ibed any opioid a t leas t once (%) Number of pa tients pr escribed a w eak er opioid a t leas t once (%) Number of pa tients pr escribed a s tr onger opioid a t leas t once (%)
Opioid prescriptions per
pa tient pr escribed opioids W eak er opioid pr escriptions per pa tient pr escribed opioids Str onger opioid pr escriptions per pa tient pr escribed opioids P e rcen tage of s tr onger
opioids prescribed
Table 2 Patient and practice characteristics for cross-sectional analysis of associations with long-term and stronger opioid prescribing
Four or more opioids prescriptions within year (long term)
Strength of opioid prescribed at any point within year
No (%) Yes (%) Weaker only (%) Stronger (%)
Number of patients 62 339 37 508 93 242 6 605
Patient demography
Female 18–49 yreas 19 455 (31.2) 5636 (15.0) 24 113 (25.9) 978 (14.8)
Female 50–64 years 8470 (13.6) 6802 (18.1) 14 239 (15.3) 1033 (15.6)
Female 65–100 years 9189 (14.7) 11 225 (29.9) 18 188 (19.5) 2226 (33.7)
Male 18–49 years 12 373 (19.8) 3549 (9.5) 15 104 (16.2) 818 (12.4)
Male 50–64 years 6561 (10.5) 4627 (12.3) 10 514 (11.3) 674 (10.2)
Male 65–100 years 6288 (10.1) 5669 (15.1) 11 081 (11.9) 876 (13.3)
Missing gender 3 (0) 3 (0)
Ethnicity
British 31 877 (51.1) 23 273 (62.0) 51 021 (54.7) 4129 (62.5)
Pakistani 8525 (13.7) 2939 (7.8) 11 226 (12.0) 238 (3.6)
Other 7718 (12.4) 3084 (8.2) 10 329 (11.1) 473 (7.2)
Unknown 14 219 (22.8) 8212 (21.9) 20 666 (22.2) 1765 (26.7)
Patient morbidity, behaviour and healthcare use
Mental health problem 1626 (2.6) 1156 (3.1) 2546 (2.7) 236 (3.6)
Definitively diagnosed disease 7359 (11.8) 6170 (16.4) 12 346 (13.2) 1183 (17.9) Clinical presentation without a definite diagnosis 23 112 (37.1) 12 714 (33.9) 33 471 (35.9) 2355 (35.6)
Pain-associated syndrome 310 (0.5) 205 (0.5) 466 (0.5) 49 (0.7)
Alcohol problem 672 (1.1) 475 (1.3) 1055 (1.1) 92 (1.4)
Smoking 13 474 (21.6) 7173 (19.1) 19 422 (20.8) 1225 (18.5)
Body mass index
Overweight or obese 6573 (10.5) 3972 (10.6) 9972 (10.7) 573 (8.7)
Normal weight 3232 (5.2) 1510 (4.0) 4484 (4.8) 268 (4.0)
Underweight 251 (0.4) 149 (0.4) 357 (0.4) 43 (0.6)
Unknown 52 273 (83.8) 31 877 (85.0) 78 429 (84.1) 5721 (86.6)
Number of repeat prescriptions
0 15 066 (30.2) 4375 (11.9) 18 999 (23.6) 442 (7.3)
1–4 22 567 (45.2) 14 450 (39.4) 35 023 (43.5) 1994 (32.8)
5–9 8152 (16.3) 9759 (26.6) 16 280 (20.2) 1631 (26.9)
10–56 4150 (8.3) 8054 (22.0) 10 201 (12.7) 2003 (33.0)
Unknown 12 404 (19.9) 870 (2.3) 12 739 (13.7) 535 (8.1)
Number of consultations
0–6 21 530 (35.2) 8350 (22.8) 29 035 (31.7) 845 (14.0)
7–12 19 810 (32.4) 10 647 (29.0) 29 174 (31.8) 1283 (21.2)
13–366 19 689 (32.3) 17 677 (48.2) 33 451 (36.5) 3915 (64.8)
Unknown 1310 (2.1) 834 (2.2) 1582 (1.7) 562 (8.5)
Number of missed appointments
0 39 295 (63.0) 22 556 (60.1) 58 532 (62.7) 3319 (50.2)
1–2 17 197 (27.6) 10 756 (28.7) 26 061 (28.0) 1892 (28.6)
3–29 4537 (7.3) 3362 (9.0) 7067 (7.6) 832 (12.6)
Unknown 1310 (2.1) 834 (2.2) 1582 (1.7) 562 (8.5)
Referrals
Diagnostic testing 6207 (10.0) 4368 (11.6) 9794 (10.5) 781 (11.8)
Medical specialty 5446 (8.7) 4317 (11.5) 8856 (9.5) 907 (13.7)
Musculoskeletal specialty 9370 (15.0) 6926 (18.5) 15 009 (16.1) 1287 (19.5)
Neurology 1126 (1.8) 1046 (2.8) 1890 (2.0) 282 (4.3)
Specialist pain management 460 (0.7) 1135 (3.0) 1070 (1.1) 525 (7.9)
Surgical specialty 3824 (6.1) 2598 (6.9) 5877 (6.3) 545 (8.2)
Practice characteristics List size
1500–6999 22 869 (36.7) 12 461 (33.2) 33 133 (35.5) 2197 (33.3)
7000–10 999 20 127 (32.3) 12 884 (34.4) 30 855 (33.1) 2156 (32.6)
11 000–25 112 19 343 (31.0) 12 163 (32.4) 29 254 (31.4) 2252 (34.1)
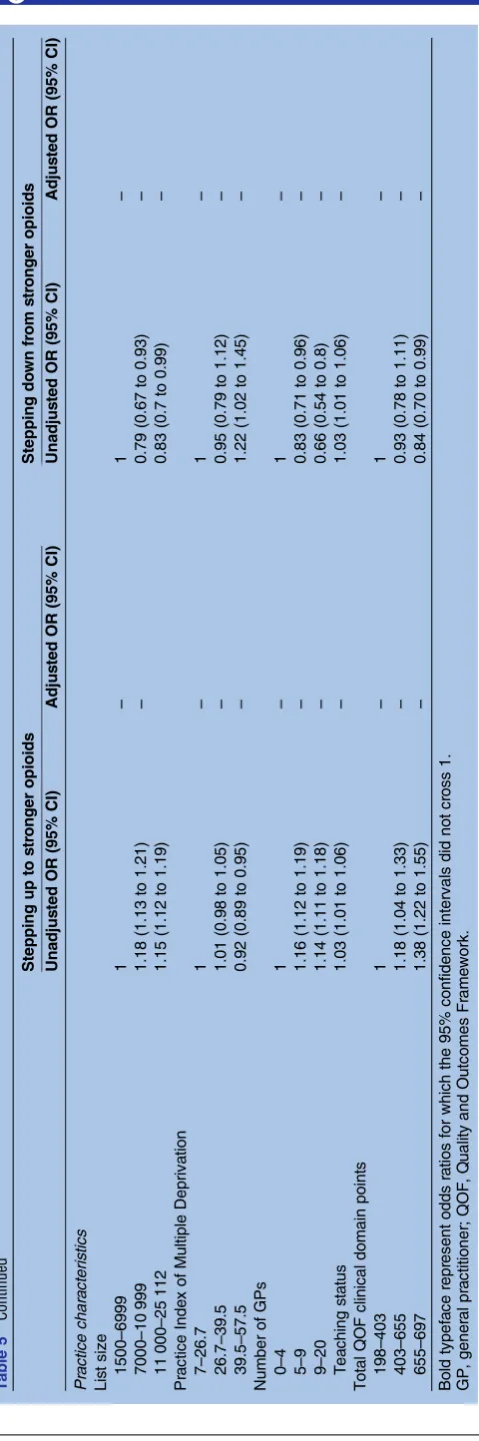
Longitudinal analyses
The odds of stepping up against not stepping up to a stronger opioid varied markedly from 0.31 to 3.36 by practice but less so, from 0.91 to 1.06, for stepping down. Practice-level variables explained none of the vari-ation (table 5). There were varivari-ations by ethnic category, with ORs ranging from 0.55 to 1.40 for stepping up and 0.87 to 1.24 for stepping down. Compared with women aged 18–49 years, men aged 65 and over were less likely to step up to a stronger opioid (0.77, 0.63 to 0.94), while those aged 18–49 years were less likely to step down (0.53, 0.37 to 0.75).
Stepping up was associated with coded definitive diag-noses (1.64, 1.46 to 1.85), clinical presentations lacking a definitive diagnosis (1.60, 1.43 to 1.79) and being underweight (3.26, 1.49 to 7.17). Increasing polyphar-macy (4.15, 3.26 to 5.29 for 10 or more repeat prescrip-tions) was strongly associated with stepping up and inversely associated with stepping down (0.60, 0.46 to 0.77 for those with 10 or more prescriptions). Increasing numbers of primary care appointments were also asso-ciated with stepping up, with the OR reaching 3.04 (2.48 to 3.73) for over 12 appointments in the year.
Referrals to neurology and specialist pain manage-ment services were associated with stepping up (1.77, 1.42 to 2.21; 5.17, 4.37 to 6.12, respectively) and inversely associated with stepping down (0.59, 0.38 to 0.91; 0.61, 0.45 to 0.83, respectively). Referrals to general medicine (1.17, 1.02 to 1.34), musculoskeletal services (1.48, 1.31 to 1.66) and surgery (1.29, 1.09 to 1.52) were also associated with stepping up.
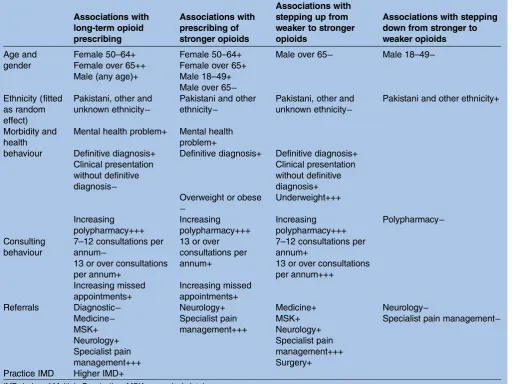
Table 6provides an overall summary of ourfindings.
DISCUSSION
[image:7.595.47.551.62.430.2]Opioid prescribing in primary care has risen markedly, even after excluding patients with a code for cancer or drug dependence. The proportion of all patients pre-scribed a weaker opioid at least once almost doubled over 7 years, while the proportion prescribed a stronger opioid increased over sixfold. Much of this prescribing was to patients with unspecified non-malignant pain rather than to those with recorded diagnoses of a spe-cific disease. We identified substantial, poorly explained variation among general practices in long-term and stronger opioid prescribing, particularly in the Table 2 Continued
Four or more opioids prescriptions within year (long term)
Strength of opioid prescribed at any point within year
No (%) Yes (%) Weaker only (%) Stronger (%)
Practice Index of Multiple Deprivation
7–26.7 21 518 (34.5) 13 248 (35.3) 32 251 (34.6) 2515 (38.1)
26.7–39.5 20 029 (32.1) 12 506 (33.3) 30 129 (32.3) 2406 (36.4)
39.5–57.5 20 792 (33.4) 11 754 (31.3) 30 862 (33.1) 1684 (25.5)
Number of GPs
0–4 25 852 (41.5) 14 305 (38.1) 37 645 (40.4) 2512 (38.0)
5–9 18 129 (29.1) 11 607 (30.9) 27 757 (29.8) 1979 (30.0)
9–20 18 358 (29.4) 11 596 (30.9) 27 840 (29.8) 2114 (32.0)
Proportion of salaried GPs
0–16.7% 20 779 (33.3) 12 422 (33.1) 30 807 (33.0) 2394 (36.2)
16.7–40% 23 030 (36.9) 14 097 (37.6) 34 759 (37.3) 2368 (35.8)
40% and over 18 172 (29.2) 10 878 (29.0) 27 222 (29.2) 1828 (27.7)
Unknown 358 (0.6) 111 (0.3) 454 (0.5) 15 (0.2)
Patients per GP
707–1278 21 638 (34.7) 13 670 (36.4) 33 052 (35.4) 2256 (34.2)
1279–1558 19 744 (31.7) 12 603 (33.6) 29 847 (32.0) 2500 (37.8)
1559–4447 20 599 (33.0) 11 124 (29.6) 29 889 (32.0) 1834 (27.8)
Unknown 358 (0.6) 111 (0.3) 454 (0.5) 15 (0.2)
Proportion of‘first five’GPs
0 34 016 (54.6) 20 291 (54.1) 50 462 (54.1) 3845 (58.2)
10–27.3% 10 762 (17.3) 6705 (17.9) 16 407 (17.6) 1060 (16.0)
27.3–66.7% 17 203 (27.6) 10 401 (27.7) 25 919 (27.8) 1685 (25.5)
Unknown 358 (0.6) 111 (0.3) 454 (0.5) 15 (0.2)
Teaching status 26 323 (42.2) 16 118 (43.0) 39 319 (42.2) 3122 (47.3)
Total QOF clinical domain points
243–647 21 583 (34.6) 12 859 (34.3) 32 281 (34.6) 2161 (32.7)
648–657 21 630 (34.7) 13 052 (34.8) 32 330 (34.7) 2352 (35.6)
658–661 19 126 (30.7) 11 597 (30.9) 28 631 (30.7) 2092 (31.7)
Table 3 Patient and practice characteristics for longitudinal step-up and step-down analyses
Stepping up to stronger opioids
Stepping down from stronger opioids
Yes (%) No (%) Yes (%) No (%)
Number of patient years 1 662 47 403 937 5 795
Patient demography
Female 18–49 years 255 (15.3) 8174 (17.2) 137 (14.6) 879 (15.2)
Female 50–64 years 317 (19.1) 9642 (20.3) 196 (20.9) 1181 (20.4)
Female 65–100 years 600 (36.1) 13 235 (27.9) 354 (37.8) 1915 (33.0)
Male 18–49 years 117 (7.0) 3808 (8.0) 45 (4.8) 552 (9.5)
Male 50–64 years 181 (10.9) 5705 (12.0) 92 (9.8) 673 (11.6)
Male 65–100 years 192 (11.6) 6839 (14.2) 113 (12.0) 625 (10.8)
British 1045 (62.9) 24 776 (52.3) 542 (57.8) 3618 (62.4)
Pakistani 119 (7.2) 7885 (16.6) 91 (9.7) 389 (6.7)
Other 157 (9.4) 4687 (9.9) 101 (10.8) 515 (8.9)
Unknown 341 (20.5) 10 174 (21.5) 203 (21.7) 1273 (22.0)
Patient morbidity, behaviour and healthcare use
Mental health problem 72 (4.3) 1661 (3.5) 35 (3.7) 218 (3.8)
Definitively diagnosed disease 493 (29.7) 7493 (15.8) 186 (19.8) 1127 (19.4)
Clinical presentation without a definite diagnosis 900 (54.2) 18 366 (38.7) 384 (41.0) 2442 (42.1)
Pain-associated syndrome 21 (1.3) 341 (0.7) 8 (0.8) 55 (0.9)
Alcohol problem 17 (1.0) 1645 (3.5) 4 (0.4) 43 (0.7)
Smoking 194 (11.7) 5147 (10.8) 94 (10.0) 660 (11.4)
Body mass index
Normal 43 (4.8) 1 192 (2.5) 25 (2.7) 166 (2.9)
Overweight or obese 118 (7.1) 3166 (6.7) 63 (6.7) 360 (6.2)
Underweight 9 (0.5) 85 (0.2) 0 (0) 18 (0.3)
Unknown 1 492 (90.0) 42 960 (90.6) 849 (90.6) 5251 (90.6)
Number of repeat prescriptions
None 90 (5.4) 7836 (16.5) 98 (10.4) 431 (7.4)
1–4 495 (29.8) 19 609 (41.4) 318 (3.4) 1908 (33.0)
5–9 507 (30.5) 11 492 (24.2) 248 (2.6) 1594 (27.5)
10–56 570 (34.3) 8466 (17.8) 273 (29.1) 1862 (32.1)
Number of consultations
0–6 117 (7.0) 11 122 (23.5) 132 (1.3) 800 (13.8)
7–12 298 (17.9) 14 415 (30.4) 224 (23.9) 1270 (21.9)
13–366 1247 (75.0) 21 866 (46.1) 581 (62.0) 3725 (64.3)
Number of missed appointments
0 903 (54.3) 28 482 (60.0) 543 (58.0) 3302 (57.0)
1–2 564 (33.9) 14 267 (30.1) 297 (31.7) 1793 (30.9)
3–29 195 (11.7) 4654 (9.8) 97 (10.4) 700 (12.1)
Referrals
Diagnostic testing 164 (9.9) 3384 (7.1) 80 (8.5) 491 (8.5)
Medical specialty 303 (18.2) 5200 (11.0) 141 (15.0) 863 (14.9)
Musculoskeletal specialty 470 (28.3) 6710 (14.2) 198 (21.1) 1100 (19.0)
Neurology 107 (6.4) 1073 (2.3) 22 (2.3) 249 (4.3)
Specialist pain management 220 (13.2) 919 (1.9) 47 (5.0) 494 (8.5)
Surgical specialty 186 (11.2) 3051 (6.4) 85 (9.1) 513 (8.8)
Practice characteristics
List size
1496–6999 21 563 (45.5) 679 (40.8) 2337 (40.3) 427 (45.6)
7000–11 000 14 959 (31.6) 563 (33.9) 2021 (34.9) 292 (31.2)
11 000–25 112 10 881 (23.0) 420 (25.3) 1437 (24.8) 218 (23.2)
Practice Index of Multiple Deprivation
6.7–26.6 12 507 (26.4) 504 (30.3) 1711 (29.5) 267 (28.5)
26.7–39.4 16 270 (34.2) 669 (40.2) 2480 (42.8) 366 (39.1)
39.5–60 18 626 (39.3) 489 (29.4) 1604 (27.7) 304 (32.4)
Number of GPs
0–4 18 496 (39.0) 566 (34.1) 1938 (33.4) 369 (39.4)
5–9 20 316 (42.9) 774 (46.6) 2638 (45.5) 416 (44.4)
likelihood of stepping up to stronger opioids. Prescribing patterns varied by age, gender and ethnicity and suggested different risk groups; almost a third of all long-term opioid prescribing and of strong opioid pre-scribing occurred in women 65 and over. Younger men were particularly more likely to experience long-term and stronger opioid prescribing and less likely to step down once prescribed stronger opioids.
Our findings are based on a large sample of relatively unselected primary care patients from diverse UK metro-politan populations. While there is now a sizeable litera-ture on risk factors for long-term or stronger opioid prescribing,2 9 23 25–27 29–31 less is known about patient trajectories. We found that stepping up from weaker to stronger opioids was most strongly associated with poly-pharmacy, more frequent primary care attendances, being underweight and pain service referrals. Patients were likely to step up regardless of whether or not painful conditions were definitively diagnosed, but those with no definitive physical diagnosis were less likely to be prescribed longer term opioids.
Our study has several limitations. First, we cannot imply causation from association. For example, patients with a coded mental health problem could be more likely to be prescribed an opioid or they could have developed a mental health problem as a result of chronic pain for which they were prescribed an opioid. Second, our exploratory work involved multiple statis-tical testing, increasing the risk of type 1 errors and hence falsely positive associations. Third, we recognised the potential for misclassification bias from our use of routinely recorded and coded data. For example, although musculoskeletal presentations to GPs are recorded in patient notes in 85% of such encounters, they are only clinically coded 32% of the time.47 Under-recording may have been more likely for diagno-ses and clinical findings associated with stigmatisation (eg, mental illness, alcohol misuse). We anticipated that such imperfectly and incompletely coded data would reduce the identification and strength of any true asso-ciations. However, we sought typically recorded data in a typical sample of practices to enhance generalisability to other UK general practices and the utility of our fi nd-ings. Any subsequent intervention to change prescribing
practice based on searches of patient records would need to work in ‘real-world’ practices rather than those selected for better quality coding. Further imprecision was caused by our use of practice-level rather than patient-level deprivation. Fourth, we used data from only one practice computerised record system. Practice use of SystmOne is associated with higher QOF achievement; it is not known whether particular system characteristics facilitate higher quality of care, better data recording or both.48 This may be of limited relevance to our study as our dependent variables were not directly related to QOF targets. Fifth, the detection and magnitude of asso-ciations concerning diagnostic codes was reduced by ascertainment bias because we could only capture diag-noses and events recorded within each 12-month period. Subsequently, the strengths of associations related to mental health problems, alcohol problems and pain-related diagnoses were less than those found in other studies.2 27 30 33 35 37 Conversely, including ‘ ever-coded’problems would have overestimated current diag-noses. Sixth, our models excluded patients with missing covariates; patients with missing data may systematically differ from those with complete data. Seventh, model selection was achieved through backwards stepwise selec-tion, with careful attention paid to collinearity. This may have led to a model with optimistic goodness-of-fit characteristics (the R2 value will be too high) and for exaggerated coefficients that would be improved by shrinkage. These issues are unlikely to substantially alter the conclusions of our exploratory work. Eighth, partici-pating practices were likely to be larger and have more primary care physicians than non-participating practices. Although smaller practice list size is associated with higher levels of high-risk prescribing,39our adjusted ana-lyses did not find a relationship between practice size and opioid prescribing. Ninth, the smaller sample size limited the precision of the step-down analysis and ability to detect associations of modest magnitude.
The prescribing patterns we found reflect varying interactions between population need and one or more of patient, clinician and health system behaviour. In women, long-term and stronger opioid prescribing increased with age, probably reflecting increasing popu-lation burden and impact of musculoskeletal disorders. Table 3 Continued
Stepping up to stronger opioids
Stepping down from stronger opioids
Yes (%) No (%) Yes (%) No (%)
10–20 8591 (18.1) 322 (19.4) 1219 (21.0) 152 (16.2)
Teaching status 18 803 (39.7) 763 (45.9) 2629 (45.4) 371 (39.6)
Total QOF clinical domain points within each year
404–654 16 245 (34.3) 482 (29.0) 1550 (26.7) 275 (29.4)
655–677 15 569 (32.8) 544 (32.7) 1914 (33.0) 316 (33.7)
678–697 15 589 (32.9) 636 (38.3) 2331 (40.2) 346 (36.9)
Table 4 Cross-sectional analysis of associations with long-term and stronger opioid prescribing
Four or more opioids prescriptions within year (long term)
Stronger opioid prescription at any point within year
Unadjusted OR (95% CI)
Adjusted OR (95% CI)
Unadjusted OR (95% CI)
Adjusted OR (95% CI)
Patient demographics
Female 18–49 years 1 1 1 1
Female 50–64 years 2.77 (2.65 to 2.90) 1.93 (1.83 to 2.02) 1.79 (1.64 to 1.96) 1.17 (1.06 to 1.29)
Female 65–100 years 4.22 (4.05 to 4.39) 2.39 (2.28 to 2.51) 3.02 (2.79 to 3.26) 1.46 (1.33 to 1.59)
Male 18–49 years 0.99 (0.94 to 1.04) 1.25 (1.18 to 1.32) 1.34 (1.21 to 1.47) 1.82 (1.64 to 2.02)
Male 50–64 years 2.43 (2.32 to 2.55) 1.75 (1.65 to 1.84) 1.58 (1.43 to 1.75) 1.07 (0.96 to 1.19) Male 65–100 years 3.11 (2.97 to 3.26) 1.76 (1.67 to 1.86) 1.95 (1.77 to 2.14) 0.86 (0.78 to 0.96)
British 1 Random effect 1 Random effect
Pakistani 0.47 (0.45 to 0.49) Random effect 0.26 (0.23 to 0.30) Random effect
Other 0.55 (0.52 to 0.57) Random effect 0.57 (0.51 to 0.62) Random effect
Unknown 0.79 (0.77 to 0.82) Random effect 1.06 (1.00 to 1.19) Random effect
Patient morbidity, behaviour and healthcare use
Mental health problem 1.19 (1.10 to 1.28) 1.12 (1.03 to 1.23) 1.32 (1.15 to 1.51) 1.23 (1.06 to 1.43)
Definitively diagnosed disease 1.47 (1.42 to 1.53) 1.09 (1.05 to 1.14) 1.43 (1.34 to 1.54) 1.12 (1.04 to 1.20)
Clinical presentation without a definite diagnosis
0.87 (0.85 to 0.89) 0.83 (0.81 to 0.86) 0.99 (0.94 to 1.04) –
Pain-associated syndrome 1.10 (0.92 to 1.31) – 1.49 (1.11 to 2.00) –
Body mass index
Overweight or obese 1.01 (0.96 to 1.05) – 0.79 (0.73 to 0.87) 0.87 (0.79 to 0.95)
Underweight 0.99 (0.81 to 1.21) – 1.71 (1.24 to 2.34) 1.89 (1.34 to 2.67)
Number of repeat prescriptions
1–4 2.21 (2.12 to 2.29) 2.05 (1.96 to 2.14) 2.45 (2.20 to 2.72) 2.06 (1.85 to 2.30)
5–9 4.12 (3.94 to 4.31) 3.65 (3.47 to 3.84) 4.31 (3.87 to 4.79) 3.51 (3.13 to 3.95)
10–56 6.68 (6.36 to 7.03) 5.68 (5.35 to 6.03) 8.44 (7.59 to 9.38) 6.55 (5.81 to 7.38)
Number of consultations
0–6 1 1 1 1
7–12 1.39 (1.34 to 1.44) 0.9 (0.86 to 0.93) 1.51 (1.38 to 1.65) 1.1 (1.00 to 1.20) 13–366 1.37 (1.35 to 1.38) 1.07 (1.03 to 1.12) 4.02 (3.73 to 4.34) 2.03 (1.86 to 2.21)
Number of missed appointments
0 1 1 1 1
1–2 1.19 (1.06 to 1.12) 1.08 (1.04 to 1.12) 1.28 (1.21 to 1.36) 1.12 (1.06 to 1.20)
3–29 1.29 (1.23 to 1.35) 1.31 (1.24 to 1.39) 2.08 (1.92 to 2.25) 1.68 (1.53 to 1.84)
Referrals
Diagnostic testing 1.19 (1.14 to 1.24) 0.95 (0.90 to 0.99) 1.14 (1.06 to 1.24) – Medical specialty 1.36 (1.30 to 1.42) 0.87 (0.83 to 0.92) 1.52 (1.41 to 1.63) – Musculoskeletal specialty 1.28 (1.24 to 1.33) 1.19 (1.14 to 1.24) 1.26 (1.18 to 1.34) –
Neurology 1.56 (1.43 to 1.70) 1.27 (1.15 to 1.40) 2.16 (1.90 to 2.45) 1.52 (1.32 to 1.75)
Specialist pain management 4.2 (3.76 to 4.68) 3.7 (3.28 to 4.18) 7.44 (6.68 to 8.28) 5.74 (5.09 to 6.47)
Surgical specialty 1.14 (1.08 to 1.20) – 1.34 (1.22 to 1.47) –
Practice characteristics
List size
1500–6999 1 – 1 –
7000–10 999 1.18 (1.13 to 1.21 – 1.05 (0.99 to 1.12) –
11 000–25 112 1.15 (1.12 to 1.19) – 1.16 (1.09 to 1.23) –
Practice Index of Multiple Deprivation
7–26.7 1 1 1 –
26.7–39.5 1.01 (0.98 to 1.05) 1.17 (1.04 to 1.31) 1.02 (0.97 to 1.09) – 39.5–57.5 0.92 (0.89 to 0.95) 1.21 (1.09 to 1.35) 0.7 (0.66 to 0.75) – Number of GPs
0–4 1 – 1 –
5–9 1.16 (1.12 to 1.19) – 1.07 (1.01 to 1.14) –
9–20 1.14 (1.11 to 1.18) – 1.14 (1.07 to 1.21) –
Proportion of salaried GPs
Lower third 1 – 1 –
Middle third 1.02 (0.99 to 1.06) 0.88 (0.83 to 0.93) –
Upper third 1 (0.97 to 1.03) 0.86 (0.81 to 0.92) –
The relative risk of stronger opioid prescribing was highest in younger men whereas older men were less likely to step up to and be prescribed stronger opioids. Younger men are prone to riskier and more severe acci-dental injuries.49 However, our finding that they were less likely to step down from stronger to weaker opioids is also compatible with an explanation of under-recognised or under-recorded opioid dependence.
There were consistent and large variations in prescrib-ing by ethnicity. Patients coded as Pakistani or other eth-nicities were particularly less likely than those coded as British to be prescribed long-term and stronger opioids, less likely to step up and more likely to step down. This is harder to explain according to population need and suggests a range of patient and clinician influences, including patient–clinician interactions.
We examined different ways of coding painful condi-tions to explore the influence of clinician certainty about diagnosis. Many musculoskeletal presentations are self-limiting but those of longer durations eventually acquire a diagnostic label. This is reflected in our finding that long-term and stronger opioid prescribing and stepping up were all associated with definitively diagnosed conditions (eg, osteoarthritis). Long-term prescribing was less likely for clinical presentations without a definitive diagnosis (eg, knee pain); the associ-ation with stepping up in this group may partly reflect additional symptomatic coding for exacerbations of definitively diagnosed conditions. However, we found no such associations for the smaller group of patients cate-gorised as having pain associated syndromes with stron-ger psychosocial features (eg, fibromyalgia). The wider CIs suggest type 2 error but thisfinding may also reflect clinician reluctance to prescribe opioids without an obvious physical explanation. We could not determine how much opioid prescribing occurred before or as a
consequence of specialist referrals; however, the associ-ation with referrals to neurology suggest that patients and GPs may struggle to find explanations for pain symptoms.
The association with coded mental health problems is consistent with an explanation that opioid prescribing occurs in response to psychological distress while also causing further dysphoria.
Some findings can only invite more speculative expla-nations. Being underweight was associated with stepping up to stronger opioids. This may reflect deterioration of long-term conditions, anorexia associated with taking stronger opioids or omitted codes for end-of-life care or drug dependence.
We found strong associations between increasing poly-pharmacy, which reflects multimorbidity, and all of long-term, stronger and stepping up opioid prescribing. Multimorbidity affects over a fifth of patients in primary care;50 osteoarthritis and cardiometabolic conditions (eg, hypertension, diabetes) are the mostly commonly paired.51This complicates clinical management, such as prescribing decisions,52 and presents challenges for planning care, especially given that an average consult-ation covers 2.5 problems in 11.9 min.47 While patterns of opioid prescribing may partly reflect perceived clin-ical need, decisions to prescribe stronger opioids are often made reactively without explicitly assessing addic-tion risk or clear acaddic-tion planning.53
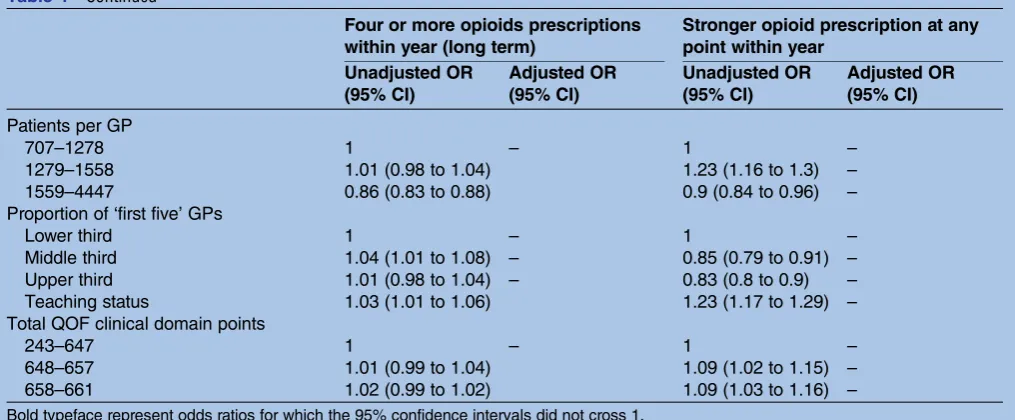
[image:11.595.45.553.59.269.2]Only practice-level deprivation partly accounted for marked variation in prescribing patterns between general practices. Differences among practices in approaches to prescribing cannot be attributed to rou-tinely recorded organisational characteristics such as the number of GPs in each practice or QOF achievement. Practice team and individual clinician behaviours, which appear poorly represented by routinely available Table 4 Continued
Four or more opioids prescriptions within year (long term)
Stronger opioid prescription at any point within year
Unadjusted OR (95% CI)
Adjusted OR (95% CI)
Unadjusted OR (95% CI)
Adjusted OR (95% CI)
Patients per GP
707–1278 1 – 1 –
1279–1558 1.01 (0.98 to 1.04) 1.23 (1.16 to 1.3) –
1559–4447 0.86 (0.83 to 0.88) 0.9 (0.84 to 0.96) –
Proportion of‘first five’GPs
Lower third 1 – 1 –
Middle third 1.04 (1.01 to 1.08) – 0.85 (0.79 to 0.91) –
Upper third 1.01 (0.98 to 1.04) – 0.83 (0.8 to 0.9) –
Teaching status 1.03 (1.01 to 1.06) 1.23 (1.17 to 1.29) –
Total QOF clinical domain points
243–647 1 – 1 –
648–657 1.01 (0.99 to 1.04) 1.09 (1.02 to 1.15) –
658–661 1.02 (0.99 to 1.02) 1.09 (1.03 to 1.16) –
Table 5 Longitudinal step-up and step-down analyses
Stepping up to stronger opioids Stepping down from stronger opioids
Unadjusted OR (95% CI) Adjusted OR (95% CI) Unadjusted OR (95% CI) Adjusted OR (95% CI)
Patient demography
Female 18–49 years 1 1 1 1
Female 50–64 years 1.05 (0.89 to 1.25) 0.94 (0.79 to 1.12) 1.07 (0.84 to 1.35) 1.07 (0.84 to 1.35)
Female 65–100 years 1.45 (1.25 to 1.69) 1.17 (1.00 to 1.38) 1.19 (0.96 to 1.47) 1.21 (0.97 to 1.50)
Male 18–49 years 0.99 (0.79 to 1.23) 1.21 (0.96 to 1.52) 0.55 (0.39 to 0.79) 0.53(0.37 to 0.75)
Male 50–64 years 1.02 (0.84 to 1.23) 0.97 (0.79 to 1.19) 0.88 (0.66 to 1.16) 0.90 (0.68 to 1.20)
Male 65–100 years 0.9 (0.74 to 1.09) 0.77(0.63 to 0.94) 1.16 (0.89 to 1.52) 1.20 (0.91 to 1.58)
British 1 Random effect Random effect
Pakistani 0.36 (0.30 to 0.44) Random effect 1.56 (1.22 to 2.00) Random effect
Other 0.79 (0.67 to 0.94) Random effect 1.31 (1.04 to 1.65) Random effect
Unknown 0.8 (0.70 to 0.90) Random effect 1.06 (0.90 to 1.27) Random effect
Patient morbidity, behaviour and healthcare use
Mental health problem 1.25 (0.98 to 1.59) – 0.99 (0.69 to 1.43) –
Definitively diagnosed disease 2.25 (2.02 to 2.50) 1.64(1.46 to 1.85) 1.03 (0.86 to 1.22) –
Clinical presentation without a definite diagnosis 1.87 (1.69 to 2.06) 1.60(1.43 to 1.79) 0.95 (0.83 to 1.10) –
Pain-associated syndrome 1.76 (1.13 to 2.74) – 0.90 (0.43 to 1.89) –
Alcohol problem 1.13 (0.69 to 1.84) – 0.57 (0.21 to 1.60) –
Smoking 1.09 (0.93 to 1.26) – 0.87 (0.69 to 1.09) –
Body mass index
Normal 1 1 1 –
Overweight 0.93 (0.62 to 1.40) 0.95 (0.62 to 1.45) 1.05 (0.60 to 1.84) –
Obese 1.13 (0.77 to 1.67) 1.08 (0.72 to 1.62) 1.31 (0.74 to 2.32) –
Underweight 2.94 (1.39 to 6.22) 3.26(1.49 to 7.17) – –
Weight unrecorded 0.96 (0.71 to 1.31) 0.91 (0.66 to 1.25) 1.07 (0.70 to 1.65) –
Number of repeat prescriptions
None 1 1 1 1
1–4 2.2 (1.75 to 2.76) 1.66(1.32 to 2.09) 0.73 (0.57 to 0.94) 0.71(0.55 to 0.91)
5–9 3.84 (3.06 to 4.82) 2.8(2.21 to 3.54) 0.68 (0.53 to 0.89) 0.66(0.51 to 0.86)
10–56 5.86 (4.68 to 7.34) 4.15(3.26 to 5.29) 0.65 (0.50 to 0.83) 0.60(0.46 to 0.77)
Number of consultations
0–6 1 1 1 –
7–12 1.97 (1.59 to 2.44) 1.52(1.22 to 1.88) 1.07 (0.85 to 1.35) –
13–366 5.42 (4.48 to 6.56) 3.04(2.48 to 3.73) 0.95 (0.77 to 1.16) –
Number of missed appointments
0 1 1 1 1
1–2 1.25 (1.12 to 1.39) – 1.01 (0.87 to 1.17) –
3–29 1.32 (1.13 to 1.55) – 0.84 (0.67 to 1.06) –
Referrals
Medical specialty 1.81 (1.59 to 2.06) 1.17(1.02 to 1.34) 1.01 (0.84 to 1.23) –
Musculoskeletal specialty 2.39. 2.14 to 2.67) 1.48(1.31 to 1.66) 1.14 (0.97 to 1.36) –
Neurology 2.97 (2.42 to 3.65) 1.77(1.42 to 2.21) 0.54 (0.34 to 0.83) 0.59(0.38 to 0.91)
Specialist pain management 7.72 (6.60 to 9.02) 5.17(4.37 to 6.12) 0.57 (0.42 to 0.77) 0.61(0.45 to 0.83)
Surgical specialty 1.83 (1.57 to 2.14) 1.29(1.09 to 1.52) 1.03 (0.81 to 1.31) –
Continued
Fo
y
R
,
et
al
.
BMJ
Open
2016;
6
:e010276.
doi:10.1136/
bmjopen-20
15-010276
n
Ac
indicators, are likely to account for substantial levels of variations in opioid prescribing. These may include established norms and procedures for reviewing pre-scribing, policies promoting continuity of care and adherence to best practice guidance on opioid prescrib-ing.54We further recognise the likely influence of wider system and social factors on prescribing, such as local prescribing formularies, legislation on controlled sub-stances and media coverage.
Current prescribing trends signal a need for a con-certed response to what is likely to be ineffective and harmful treatment for a large proportion of primary care patients. Once patients with coded cancer or sub-stance dependence are accounted for, around 1 in 20 of the adult practice population is prescribed long-term opioids, a mean of 338 patients per practice. Nearly 1 in 100, or 59 adults per practice, are prescribed stronger opioids. Healthcare systems need to respond to two related problems: how to improve care for patients with chronic non-cancer pain; and how best to curb and reverse current trends in opioid prescribing, especially of stronger opioids.
One response is to recognise and manage chronic pain as a long-term condition which requires coordinated care including the formulation of care plans agreed between professionals and patients, effective non-pharmacological and self-management strategies, and ongoing active mon-itoring. We have demonstrated that it is feasible to iden-tify patients within primary care based on prescribing records, potentially stratifying those at highest risk of step-ping up to stronger opioid treatment as a priority group. These patient groups may extend beyond those with recognised and more severe chronic non-cancer pain. Patients with multimorbidity and polypharmacy represent the most obvious and pressing target for ‘ deprescrib-ing’.55 While we would not advocate non-negotiated reductions of regular modest prescriptions of weaker opioids, patients should be alerted to potential risks of continuing treatment at medication reviews.
Another response is to reduce initiation of opioid pre-scribing. Given the accumulating evidence about their harms, reversing the current trend in opioid prescribing is likely to benefit a substantial at-risk population. There are at least two evidence-based approaches to address this at practice level. First, audit and feedback is effective at changing professional practices.56 Its effects may be relatively modest but audit and feedback can be con-ducted efficiently using routinely recollected data and its effects may be enhanced by targeting higher baseline non-compliance with standards (eg, higher prescribing practices) and incorporating action plans for practices. Second, computerised prompts triggered by combina-tions of patient characteristics associated with stepping up to stronger opioids could alert clinicians to
recon-sider opioid prescribing at the point of care.
Computerised clinical decision support is more likely to be effective if clinicians are required to supply a reason for over-riding advice.57
[image:13.595.46.286.36.758.2]There is a growing consensus on best practice when considering or initiating opioids.58–60 This includes recognising and dealing with psychosocial aspects of pain, managing patient expectations about the degree of pain relief likely to be achievable, starting with a thera-peutic trial and an agreement to stop or reduce opioids when they do not work, and recording care plans agreed with patients to guide all subsequent prescribers in main-taining the plan. GPs should avoid escalation above 120 mg morphine-equivalent daily equivalent and refer to pain management services if this seems likely.60
Strategies to bring about large-scale change in health-care are unlikely to succeed if they fail to address mul-tiple barriers and enablers across different levels of healthcare systems.61 Therefore, these types of above responses need to be coupled with educational cam-paigns to challenge or change professional and patient beliefs and expectations about opioid prescribing, drawing on lessons learned so far from strategies to reduce inappropriate prescribing of medicines such as antibiotics and minor hypnotics.62
Future research efforts should address strategies to reduce opioid prescribing which target patients and clin-icians. There is little evidence on the effectiveness of interventions to reduce opioid prescribing in patients with chronic non-cancer pain.63 Non-pharmacological alternatives to pain management may be modestly bene-ficial but require further development and evaluation.64 There are parallel needs to further understand practice-level variation and evaluate interventions primarily aimed at clinicians to discourage initiation or continu-ation of opioid prescribing.
Acknowledgements The authors thank the practices which participated in
this study. They are also grateful for support provided to the study by Emma Yeomans and Sandra Holliday, Leeds Institute of Health Sciences, and to Paul Lord for the analysis of participating versus non-participating practices.
Contributors AH, RF, LG, DP and CM conceived the original idea for the
[image:14.595.45.560.78.462.2]study. All authors contributed to further design and conduct. SF and PC collected data and RW conducted the analyses. All authors contributed to the interpretation of the analyses. RF, BL and RW drafted the manuscript, and all authors read and approved the final manuscript.
Table 6 Overall summary of associations with long-term and stronger opioid prescribing (+=adjusted OR of 1–2; ++=OR of 2–3; +++=OR over 3; italics=OR <1)
Associations with long-term opioid prescribing
Associations with prescribing of stronger opioids
Associations with stepping up from weaker to stronger opioids
Associations with stepping down from stronger to weaker opioids
Age and gender
Female 50–64+ Female over 65++ Male (any age)+
Female 50–64+ Female over 65+ Male 18–49+ Male over 65−
Male over 65− Male 18–49−
Ethnicity (fitted as random effect)
Pakistani, other and unknown ethnicity−
Pakistani and other ethnicity−
Pakistani, other and unknown ethnicity−
Pakistani and other ethnicity+
Morbidity and health behaviour
Mental health problem+ Mental health problem+
Definitive diagnosis+ Definitive diagnosis+ Definitive diagnosis+ Clinical presentation
without definitive diagnosis−
Clinical presentation without definitive diagnosis+ Overweight or obese
− Underweight+++
Increasing polypharmacy+++
Increasing polypharmacy+++
Increasing polypharmacy+++
Polypharmacy−
Consulting behaviour
7–12 consultations per annum−
13 or over consultations per annum+
13 or over consultations per annum+
7–12 consultations per annum+
13 or over consultations per annum+++
Increasing missed appointments+
Increasing missed appointments+ Referrals Diagnostic−
Medicine− MSK+ Neurology+ Specialist pain management+++
Neurology+ Specialist pain management+++
Medicine+ MSK+ Neurology+ Specialist pain management+++ Surgery+
Neurology−
Specialist pain management−
Practice IMD Higher IMD+
Funding This paper summarises independent research funded by the National Institute for Health Research (NIHR) under its Research for Patient Benefit Programme (Grant Reference Number PB-PG- 1010-23041).
Disclaimer The views expressed are those of the authors and not necessarily
those of the NHS, the NIHR or the Department of Health.
Competing interests None declared.
Ethics approval The study was approved by Yorkshire and the Humber
(Humber Bridge) NRES Committee 12/YH/0109.
Provenance and peer review Not commissioned; externally peer reviewed.
Data sharing statement No additional data are available.
Open Access This is an Open Access article distributed in accordance with
the terms of the Creative Commons Attribution (CC BY 4.0) license, which permits others to distribute, remix, adapt and build upon this work, for commercial use, provided the original work is properly cited. See: http:// creativecommons.org/licenses/by/4.0/
REFERENCES
1. Daubresse M, Chang HY, Yu Y,et al. Ambulatory diagnosis and
treatment of nonmalignant pain in the United States, 2000–2010.
Med Care2013;51:870–8.
2. Boudreau D, Von Korff M, Rutter CM,et al. Trends in long-term
opioid therapy for chronic non-cancer pain.Pharmacoepidemiol Drug
Saf2009;18:1166–75.
3. Shvartzman P, Freud T, Singer Y,et al. Opioid use in an Israeli
health maintenance organization: 2000–2006.Pain Med
2009;10:702–7.
4. Leong M, Murnion B, Haber PS. Examination of opioid prescribing in
Australia from 1992 to 2007.Intern Med J2009;39:676–81.
5. Hamunen K, Paakkari P, Kalso E. Trends in opioid consumption in
the Nordic countries 2002–2006.Eur J Pain2009;13:954–62.
6. Schubert I, Ihle P, Sabatowski R. Increase in opiate prescription in
Germany between 2000 and 2010: a study based on insurance data. Dtsch Arztebl Int2013;110:45–51.
7. Fischer B, Jones W, Rehm J. Trends and changes in prescription
opioid analgesic dispensing in Canada 2005–2012: an update with a
focus on recent interventions.BMC Health Serv Res2014;14:90.
8. Bedson J, Belcher J, Martino OI,et al. The effectiveness of national
guidance in changing analgesic prescribing in primary care from
2002 to 2009: an observational database study.Eur J Pain
2013;17:434–43.
9. Ruscitto A, Smith BH, Guthrie B. Changes in opioid and other
analgesic use 1995–2010: repeated cross-sectional analysis of
dispensed prescribing for a large geographical population in
Scotland.Eur J Pain2015;19:59–66.
10. Stannard C. Opioids in the UK: what’s the problem?BMJ2013;347:
f5108.
11. Noble M, Treadwell JR, Tregear SJ,et al. Long-term opioid
management for chronic noncancer pain.Cochrane Database Syst
Rev2010;(1):Cd006605.
12. McNicol ED, Midbari A, Eisenberg E. Opioids for neuropathic pain.
Cochrane Database Syst Rev2013;(8):Cd006146.
13. Manchikanti L, Vallejo R, Manchikanti KN,et al. Effectiveness of
long-term opioid therapy for chronic non-cancer pain.Pain Physician
2011;14:E133–56.
14. Chou R, Turner JA, Devine EB,et al. The effectiveness and risks of
long-term opioid therapy for chronic pain: a systematic review for a National Institutes of Health Pathways to Prevention Workshop. Ann Intern Med2015;162:276–86.
15. Stein C, Reinecke H, Sorgatz H. Opioid use in chronic noncancer
pain: guidelines revisited.Curr Opin Anaesthesiol2010;23:598–601.
16. Ballantyne JC, Shin NS. Efficacy of opioids for chronic pain: a
review of the evidence.Clin J Pain2008;24:469–78.
17. Banta-Green CJ, Von Korff M, Sullivan MD,et al. The prescribed
opioids difficulties scale: a patient-centered assessment of problems
and concerns.Clin J Pain2010;26:489–97.
18. Reid MC, Henderson CR Jr, Papaleontiou M,et al. Characteristics of
older adults receiving opioids in primary care: treatment duration and
outcomes.Pain Med2010;11:1063–71.
19. Solomon DH, Rassen JA, Glynn RJ,et al. The comparative safety of
opioids for nonmalignant pain in older adults.Arch Intern Med
2010;170:1979–86.
20. Solomon DH, Rassen JA, Glynn RJ,et al. The comparative safety of
analgesics in older adults with arthritis.Arch Intern Med
2010;170:1968–76.
21. Manchikanti L, Helm S II, Fellows B,et al. Opioid epidemic in the
United States.Pain Physician2012;15(3 Suppl):Es9–38.
22. Heit HA, Gourlay DL. Tackling the difficult problem of prescription
opioid misuse.Ann Intern Med2010;152:747–8.
23. Fredheim OM, Mahic M, Skurtveit S,et al. Chronic pain and use of
opioids: a population-based pharmacoepidemiological study from the Norwegian prescription database and the Nord-Trondelag health
study.Pain2014;155:1213–21.
24. Spence D. Bad medicine: co-codamol.BMJ2013;346:f1821.
25. Campbell CI, Weisner C, Leresche L,et al. Age and gender trends
in long-term opioid analgesic use for noncancer pain.Am J Public
Health2010;100:2541–7.
26. Thielke SM, Simoni-Wastila L, Edlund MJ,et al. Age and sex trends
in long-term opioid use in two large American health systems
between 2000 and 2005.Pain Med2010;11:248–56.
27. Campbell G, Nielsen S, Larance B,et al. Pharmaceutical opioid use
and dependence among people living with chronic pain: associations observed within the pain and opioids in treatment
(POINT) cohort.Pain Med2015;16:1745–58.
28. Dobscha SK, Morasco BJ, Duckart JP,et al. Correlates of
prescription opioid initiation and long-term opioid use in veterans with persistent pain.Clin J Pain2013;29:102–8.
29. Clarke H, Soneji N, Ko DT,et al. Rates and risk factors for prolonged opioid use after major surgery: population based cohort
study.BMJ2014;348:g1251.
30. Morasco BJ, Duckart JP, Carr TP,et al. Clinical characteristics of
veterans prescribed high doses of opioid medications for chronic
non-cancer pain.Pain2010;151:625–32.
31. Green DJ, Bedson J, Blagojevic-Burwell M,et al. Factors associated
with primary care prescription of opioids for joint pain.Eur J Pain 2013;17:234–44.
32. Sullivan MD, Edlund MJ, Zhang L,et al. Association between mental
health disorders, problem drug use, and regular prescription opioid use.Arch Intern Med2006;166:2087–93.
33. Breckenridge J, Clark JD. Patient characteristics associated with
opioid versus nonsteroidal anti-inflammatory drug management of
chronic low back pain.J Pain2003;4:344–50.
34. Krebs EE, Lurie JD, Fanciullo G,et al. Predictors of long-term opioid
use among patients with painful lumbar spine conditions.J Pain
2010;11:44–52.
35. Hudson TJ, Edlund MJ, Steffick DE,et al. Epidemiology of regular
prescribed opioid use: results from a national, population-based
survey.J Pain Symptom Manage2008;36:280–8.
36. Deyo RA, Smith DH, Johnson ES,et al. Opioids for back pain
patients: primary care prescribing patterns and use of services. J Am Board Fam Med2011;24:717–27.
37. Macey TA, Morasco BJ, Duckart JP,et al. Patterns and correlates of
prescription opioid use in OEF/OIF veterans with chronic noncancer
pain.Pain Med2011;12:1502–9.
38. Goodwin N, Dixon A, Poole T,et al. Improving the Quality of Care in
General Practice. The King’s Fund: London, 2011.
39. Guthrie B, McCowan C, Davey P,et al. High risk prescribing in
primary care patients particularly vulnerable to adverse drug events: cross sectional population database analysis in Scottish general
practice.BMJ2011;342:d3514.
40. Association of Public Health Observatories. Secondary 2015. http://
www.apho.org.uk/resource/item.aspx?RID=50147
41. Doran T, Fullwood C, Gravelle H,et al. Pay-for-performance
programs in family practices in the United Kingdom.N Engl J Med
2006;355:375–84.
42. Edlund MJ, Steffick D, Hudson T,et al. Risk factors for clinically recognized opioid abuse and dependence among veterans using
opioids for chronic non-cancer pain.Pain2007;129:355–62.
43. Weisner CM, Campbell CI, Ray GT,et al. Trends in prescribed
opioid therapy for non-cancer pain for individuals with prior
substance use disorders.Pain2009;145:287–93.
44. Braden JB, Sullivan MD, Ray GT,et al. Trends in long-term opioid
therapy for noncancer pain among persons with a history of
depression.Gen Hosp Psychiatry2009;31:564–70.
45. Leppert W. Pain management in patients with cancer: focus on
opioid analgesics.Curr Pain Headache Rep2011;15:271–9.
46. Bates D, Maechler M, Bolker B,et al. Fitting linear mixed-effects
models using lme4.J Stat Software2015;1:1–48.
47. Salisbury C, Procter S, Stewart K,et al. The content of general
practice consultations: cross-sectional study based on video
recordings.Br J Gen Pract2013;63:e751–9.
48. Kontopantelis E, Buchan I, Reeves D,et al. Relationship between
analysis of family practice performance under the UK’s quality and
outcomes framework.BMJ Open2013;3:pii: e003190.
49. Thomas J, Kavanagh J, Tucker H,et al.Accidental injury, risk-taking
behaviour and the social circumstances in which young people (aged 12–24) live: a systematic review. London: EPPI-Centre, Social Science Research Unit, Institute of Education, University of London, 2007.
50. Barnett K, Mercer SW, Norbury M,et al. Epidemiology of
multimorbidity and implications for health care, research,
and medical education: a cross-sectional study.Lancet
2012;380:37–43.
51. Violan C, Foguet-Boreu Q, Flores-Mateo G,et al.
Prevalence, determinants and patterns of multimorbidity in primary
care: a systematic review of observational studies.PLoS ONE
2014;9:e102149.
52. Wallace E, Salisbury C, Guthrie B,et al. Managing patients with
multimorbidity in primary care.BMJ2015;350:h176.
53. McCrorie C, Closs SJ, House A,et al. Understanding long-term
opioid prescribing for non-cancer pain in primary care: a qualitative
study.BMC Fam Pract2015;16:121.
54. Lange A, Lasser KE, Xuan Z,et al. Variability in opioid
prescription monitoring and evidence of aberrant medication taking
behaviors in urban safety-net clinics.Pain2015;156:
335–40.
55. Duerden M, Avery T, Payne R.Polypharmacy and medicines
optimisation. The King’s Fund, 2013.
56. Ivers N, Jamtvedt G, Flottorp S,et al. Audit and feedback: effects on
professional practice and healthcare outcomes.Cochrane Database
Syst Rev2012;(6):Cd000259.
57. Roshanov PS, Fernandes N, Wilczynski JM,et al. Features of
effective computerised clinical decision support systems:
meta-regression of 162 randomised trials.BMJ2013;346:f657.
58. Freynhagen R, Geisslinger G, Schug SA. Opioids for chronic
non-cancer pain.BMJ2013;346:f2937.
59. Manchikanti L, Abdi S, Atluri S,et al. American Society of
Interventional Pain Physicians (ASIPP) guidelines for responsible opioid prescribing in chronic non-cancer pain: part 2—guidance.
Pain Physician2012;15(3 Suppl):S67–116.
60. Opioids for persistent pain: Summary of guidance on good practice
from the British Pain Society.Br J Pain2012;6:9–10.
61. Ferlie EB, Shortell SM. Improving the quality of health care in the
United Kingdom and the United States: a framework for change. Milbank Q2001;79:281–315.
62. Tan T, Little P, Stokes T. Antibiotic prescribing for self limiting respiratory tract infections in primary care: summary of NICE
guidance.BMJ2008;337:a437.
63. Windmill J, Fisher E, Eccleston C,et al. Interventions for the reduction of prescribed opioid use in chronic non-cancer pain. Cochrane Database Syst Rev2013;(9):Cd010323.
64. Bawa FL, Mercer SW, Atherton RJ,et al. Does mindfulness improve
outcomes in patients with chronic pain? Systematic review and