RESEARCH
Exercise in claudicants increase or
decrease walking ability and the response
relates to mitochondrial function
Michel van Schaardenburgh
1*, Martin Wohlwend
1, Øivind Rognmo
1and Erney J. R. Mattsson
1,2Abstract
Background: Exercise of patients with intermittent claudication improves walking performance. Exercise does not usually increase blood flow, but seems to increase muscle mitochondrial enzyme activities. Although exercise is beneficial in most patients, it might be harmful in some. The mitochondrial response to exercise might therefore differ between patients. Our hypothesis was that changes in walking performance relate to changes in mitochondrial function after 8 weeks of exercise. At a subgroup level, negative responders decrease and positive responders increase mitochondrial capacity.
Methods: Two types of exercise were studied, calf raising and walking (n = 28). We wanted to see whether there were negative and positive responders, independent of type of exercise. Measurements of walking performance, peripheral hemodynamics, mitochondrial respiration and content (citrate synthase activity) were obtained on each patient before and after the intervention period. Multiple linear regression was used to test whether changes in peak walking time relate to mitochondrial function. Subgroups of negative (n = 8) and positive responders (n = 8) were defined as those that either decreased or increased peak walking time following exercise. Paired t test and analysis of covariance was used to test changes within and between subgroups.
Results: Changes in peak walking time were related to changes in mitochondrial respiration supported by elec-tron transferring flavoprotein (ETF + CI)P (p = 0.004), complex I (CI + ETF)P (p = 0.003), complex I + complex II (CI + CII + ETF)P (p = 0.037) and OXPHOS coupling efficiency (p = 0.046) in the whole group. Negative responders had more advanced peripheral arterial disease. Mitochondrial respiration supported by electron transferring flavopro-tein (ETF + CI)P (p = 0.0013), complex I (CI + ETF)P (p = 0.0005), complex I + complex II (CI + CII + ETF)P (p = 0.011) and electron transfer system capacity (CI + CII + ETF)E (p = 0.021) and OXPHOS coupling efficiency decreased in negative responders (p = 0.0007) after exercise. Positive responders increased citrate synthase activity (p = 0.010). Conclusions: Changes in walking performance seem to relate to changes in mitochondrial function after exercise. Negative responders have more advanced peripheral arterial disease and decrease, while positive responders increase mitochondrial capacity.
Trial registration ClinicalTrials.gov ID: NCT023110256
Keywords: Intermittent claudication, Exercise, Mitochondria, Preconditioning, Ischemia reperfusion injury
© The Author(s) 2017. This article is distributed under the terms of the Creative Commons Attribution 4.0 International License (http://creativecommons.org/licenses/by/4.0/), which permits unrestricted use, distribution, and reproduction in any medium, provided you give appropriate credit to the original author(s) and the source, provide a link to the Creative Commons license, and indicate if changes were made. The Creative Commons Public Domain Dedication waiver (http://creativecommons.org/ publicdomain/zero/1.0/) applies to the data made available in this article, unless otherwise stated.
Open Access
*Correspondence: [email protected]
1 Department of Circulation and Medical Imaging, Norwegian University
Background
Mitochondria play a central role in the muscular response to exercise and are depended on oxygen for the energy production. Patients with intermittent claudi-cation (IC) have a reduced blood flow to their extremi-ties and thereby reduced oxygen supply to the muscles. Patients with IC have in addition been shown to have mitochondrial dysfunction [1, 2]. This indicates that the oxygen still delivered will not be optimally utilized. Exercise of patients with IC seems to increase walk-ing ability, without changwalk-ing blood flow [3], but rather increase mitochondrial enzyme activity [4]. Exercise induces ischemia and reperfusion starts at rest. It has been imposed that repetitive cycles of exercise followed by rest may be important for increased walking ability [5–7]. This is equal to induce a state of preconditioning that stimulates the mitochondria [8, 9]. There is simulta-neously a possibility that exercise might damage muscle mitochondria [10, 11].
A number of patients with IC do not seem to respond to exercise [12]. It seems as if there are both responders and non-responders or even negative responders among these patients.
The aim of this investigation was to explore whether changes in walking performance could be explained by changes in mitochondrial function. Furthermore, we wanted to identify patients with IC being negative or pos-itive responders after exercise and to clarify potential dif-ferences in the mitochondrial physiology between these patients.
Our hypothesis was that a change in walking perfor-mance has a relationship to changes in mitochondrial function and negative responders decrease while positive responders increase mitochondrial capacity.
Methods
Patient screening
A total of 28 patients limited by intermittent claudication were enrolled into this study. The patients were recruited between February 2015 and January 2016 at the Depart-ment of Vascular Surgery, St Olavs University Hospital, Trondheim, Norway. All experimental protocols and procedures were approved by the regional committee of medical and health research ethics, central Norway (nr. 2011/2533) and conformed to the Declaration of Hel-sinki. Written informed consent was obtained from all participants. The study was registered in ClinicalTrials. gov (ID: NCT 023110256).
The patients were physically examined and interviewed during a baseline visit. They were included by the fol-lowing criteria: (1) a history of intermittent claudication, (2) walking ability limited by intermittent claudication during a screening treadmill test, (3) an ankle brachial
index (ABI) at rest between 0.4 and 0.9. No age restric-tions were applied. Patients with vascular intervenrestric-tions more than 3 months ago independent of indication and still having intermittent claudication, were eligible for inclusion.
Patients were excluded when having (1) absence of peripheral arterial disease (PAD), (2) asymptomatic PAD, (3) critical limb ischemia; defined as those with ABI below 0.4 combined with rest pain or ischemic ulcer, (4) exercise tolerance limited by factors other than claudica-tion (e.g., coronary artery disease, dyspnea), (5) vascular interventions in the last 3 months, (6) usage of antiplate-let drugs other than acetylsalicylic acid (e.g., Plavix, Per-santine), (7) usage of anticoagulants (e.g., Warfarin), (8) diabetes mellitus, (9) active cancer and (10) renal- or liver disease which needed treatment or follow up.
Procedures
Patients were evaluated at baseline and after 8 weeks of the exercise intervention. During each visit, patients completed tests in the following order: (1) physical examination including a review of current medication (2) collection of muscle biopsies (3) 6-min walk test (4) treadmill testing (5) peripheral hemodynamics tests.
At the end of the baseline visit participants were rand-omized between a calf raise exercise group (n = 14) or a walking exercise group (n = 14). An internet-based ran-domization database using a 1:1 allocation, offered by the Unit for Applied Clinical Research at our Medical Fac-ulty was used. Assessors were blinded to the allocation of each participant. We randomized between two exercise programs in order to assure similar clinical characteris-tics in the groups.
Our intention was to see whether different types of responders in walking performance and mitochondrial capacity exist, independent of type of exercise. Thereby focusing on the individual response and not the group to which an individual belongs to.
Exercise interventions
A calf raise exercise group was instructed to perform calf raise exercise three times a day. Calf raise exercise con-sisted of the subject standing in front of a wall, which was used for support of the balance. The body was lifted using the calf muscles to the maximal height that the subject could achieve. This was repeated until pain was felt in the calf musculature. Following initiation of pain, the subject was instructed to perform five extra calf raises. The five extra calf raises after pain secured ischemia followed by reperfusion of the muscle at rest. Thereby establishing a preconditioning situation.
training regimens were home-based and without super-vision for 8 weeks. No instructions were given on risk factor management or lifestyle modification to any of the groups.
Measurements
Walking performance and oxygen uptake
Six‑minute walk test A standardised protocol was fol-lowed [13]. The self-paced 6-min walk test assessed the pain free walking distance as the distance at which partici-pants first reported pain and the distance covered during 6 min.
Maximal walking distance was the distance at which participants stopped because of claudication pain.
Treadmill testing A treadmill (Woodway, USA) together with the device METAMAX II and the METASOFT soft-ware (Cortex, Germany) was used for cardio pulmonary treadmill testing. A graded Gardner-Skinner protocol [14] was applied; the treadmill was at a constant speed of 3.2 km/ h, starting at 0% inclination. The inclination increased by 2% every second minute until the end of the test. Peak oxygen uptake (VO2peak = ml/kg/min) was determined as being the highest value obtained.
Claudication onset time was the onset of claudication pain and peak walking time was the time at which partic-ipants stopped the test, during the tests on the treadmill.
Subgroups of negative and positive responders
Peak walking time on the treadmill measures maxi-mal walking performance and was used to differentiate between subgroups of negative and positive responders. Negative responders (n = 8) and positive responders (n = 8) were defined as those that decreased or increased peak walking time the most, independent of exercise regiments.
Peripheral hemodynamics
Ankle brachial index Ankle brachial index, an evalua-tion of blood pressures in the arm and the ankle was per-formed at rest [15]. The systolic pressure of the posterior tibial artery was first measured and thereafter in the dor-salis pedis artery in all patients. We first measured in the most healthy leg and then in the most sick leg, accord-ing to the patients complaints. The highest pressure at the ankle was divided by the highest brachial systolic pressure of two measurements to form the ankle-brachial index (ABI) for each leg.
Plethysmography Plethysmograph assessments were conducted as previously described [16]. The blood flow in the lower extremity was assessed with a strain-gauge
plethysmography (Hokanson A16 Inc, Bellevue). A strain gauge was placed around the widest girth of the calf. A thigh cuff was inflated to 220 mmHg for 5 min, to induce ischemia followed by hyperemic reperfusion to the leg. During the last minute of arterial occlusion, an ankle cuff was inflated to 250 mmHg, to exclude the blood circula-tion to and from the foot. The thigh cuff was deflated but during ten measurements the thigh cuff was again inflated for each measurement at 40 mmHg to block the venous reflux. Thereby the arterial inflow to the calves was meas-ured as a maximal hyperemic response (ml/min/100 ml of calf volume).
Muscle biopsy Biopsies were collected at baseline and after 8 weeks from the lateral part of the gastrocnemius muscle. A micro biopsy technique was conducted to obtain muscle tissue [17]. The sampling site was shaved and the skin was sterilized with chlorhexidine 5% and anesthetized by subcutaneous injection of xylocain with adrenalin (Astra Zeneca, Oslo, Norway). The local anes-thetic was strictly injected in the subcutaneous tissue, to avoid influence of the muscle mitochondria. A 14-gauge insertion cannula (BioPince, Medical device technologies Inc., Gainesville, Florida USA) punctured the skin per-pendicular until the fascia was pierced. A sterile 16-gauge biopsy needle was introduced through the cannula and muscle biopsy samples were obtained from the gastroc-nemius muscle.
Mitochondrial respirometry The muscle fibers were transferred into a 2 ml glass chamber containing MiR05 for high-resolution respirometry measurements (Oxy-graph-2 k; Oroboros Instruments, Innsbruck, Austria). The oxygen concentration and oxygen consumption were continuously recorded in the chamber. Oxygen consump-tion per second, per milligram of wet weight of muscle fibers was addressed as mitochondrial respiration (pmol O2/s/mg wet weight of muscle fibers). Measurements were performed at 37 °C. All experiments were carried out in hyper-oxygenated chambers (250–500 μM oxygen) to prevent any potential oxygen limitations. The Substrate, Uncoupler and Inhibitor Titration (SUIT) protocol was used to examine different branches of the electron transfer system as previously described [18–20]. This was achieved by adding inductive or blocking substrates to the cham-ber. All respirometric analyses were made in duplicates. The LEAK state (presented with subscript L) represents the resting mitochondrial respiration of an unaltered and intact electron transport system in the absence of ADP. The LEAK state is measured from the electron flow through complex I (CI) and electron transferring flavoprotein (ETF). ETF linked transfer of electrons was induced with the addition of octanoylcarnitine (0.2 mM) and malate (2 mM). Malate was added because the ETF linked trans-fer of electrons requires the metabolism of acetyl-CoA to facilitate convergent electron flow into the Q-junction from both complex I (CI) and ETF (ETF + CI)L.
OXPHOS state (presented with subscript P) represents maximal electron flow through the electron transfer sys-tem in the presence of ADP. Electron transferring-flavo-protein capacity (ETF + CI)P was determined following the addition of ADP (5 mM). Mitochondrial respiration specific to complex I (CI + ETF)P was induced by the addition of glutamate (10 mM). Respiration supported by complex I and complex II (CI + CII + ETF)P, was then induced with the addition of succinate (10 mM). (CI + CII + ETF)P demonstrates a naturally intact elec-tron transport system’s capacity to catalyze a sequential set of redox reactions that are partially coupled to the production of ATP at complex V [18].
Electron transfer system (presented with subscript E) state represents the electron transport through the electron trans-fer system, when it is uncoupled from ATPase (complex V). Electron transfer system capacity (CI + CII + ETF)E was assessed through titration of the proton ionophore, carbonyl cyanide p-(trifluoromethoxy) phenylhydrazone (FCCP: 0.5 μM stepwise titration to optimum concentrations rang-ing from 1.5 to 3 μM). Rotenone (0.5 μM) was added to inhibit complex I, thereby electron flow specific to complex II (CII)E can be measured. Finally, malonic acid (5 mM) and antimycin A (2.5 μM) were added, to terminate respiration by inhibiting complex II and complex III respectively.
Mitochondrial quality and control
The OXPHOS coupling efficiency, the excess electron transfer system-phosphorylation factor capacity and complex II control factor were calculated as measures of mitochondrial quality and control. OXPHOS coupling efficiency, calculated with the formula (1 − (ETF + CI)L/ (ETF + CI)P), reflects the coupling of respiration sup-ported by electron transferring flavoprotein (ETF) with octanoylcarnitin and malate as substrates before (ETF + CI)L and after addition of ADP (ETF + CI)P. The OXPHOS coupling efficiency (OCE) can be compared with the respiratory control ratio (RCR). The formula of OCE could be rewritten as; OCE =
1− 1 RCR
. The OCE is noted between 0 and 1, while the RCR could be from 0 to infinite. A lower value of OCE means lesser coupling of the oxidation and phosphorylation after addition of ADP. As the OCE decreases it is therefore less coupled.
The excess electron transfer system-phospho-rylation factor capacity (1 − (CI + CII + ETF)P/ (CI + CII + ETF)E) is an expression of the relative limita-tion of OXPHOS capacity (CI + CII + ETF)P by the elec-tron transport system capacity (CI + CII + ETF)E of the phosphorylation system.
The complex II control factor (1 − (CI + ETF)P/ (CI + CII + ETFP)) reflects the fractional change of mito-chondrial respiration when succinate (CI + CII + ETF)P is added to respiration supported by complex I (CI + ETF)P.
Mitochondrial content
Citrate synthase activity was used as a biomarker mito-chondrial content [21]. Citrate synthase activity (μmol/ min/mg of protein) was assayed in homogenates of the permeabilized fibers used in the respiration measure-ments [19]. The content of the chambers was removed after each respiration experiment and washed with 0.2 ml MiR05 for 10 min at 4°. The fluid was frozen at minus 80°. Citrate synthase activity was measured later with a spec-tro-photometer at 412 nm and 25 °C (Citrate Synthase Assay Kit, Sigma-Aldrich), according to the manufactur-er’s instructions.
Statistical analyses
capacity between subgroups. Paired-t-test and analysis of covariance (ANCOVA) were used to compare changes in mitochondrial capacity within each group, and in comparison between subgroups. Statistical significance was considered at a value of p < 0.05.
Results
Participants
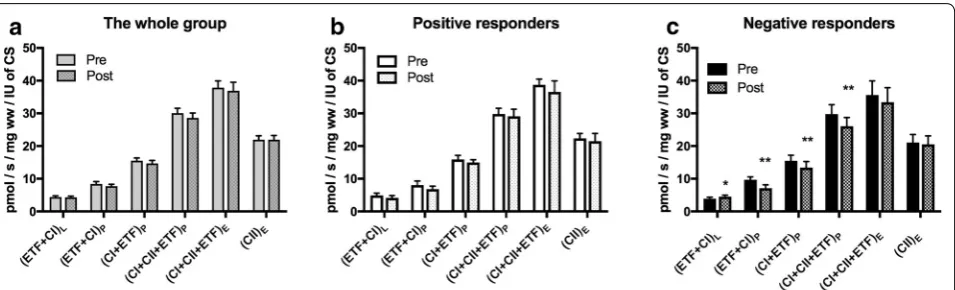
Among the positive responders 3 and in the negative responders 5 out of 8 originated from the walking group. The subgroups differed; negative responders had more
Table 1 Baseline clinical data
p values are calculated by t test for continuous variables and Chi square test for categorical variables between sub-group of negative and positive responders. Data are mean ± standard error of the mean (SE) for continuous variables, and numbers (proportions; %) for categorical variables
Whole group
(n = 28) Positive responders (n = 8) Negative responders (n = 8) Comparison between subgroups
Mean ± SE Mean ± SE Mean ± SE p value
Sex (female) 13 (44) 4 (50) 4 (50) 1.00
Age 69.2 ± 1.7 67.3 ± 3.45 69.3 ± 3.35 0.95 BMI 26.2 ± 0.7 26.6 ± 1.3 26.7 ± 0.9 0.95 Anamnestic walking distance (m) 348 ± 54 333 ± 120 194 ± 33 0.15 Pain free walking distance (m) 240 ± 33 178 ± 34 310 ± 100 0.12 Six minutes walking distance (m) 460 ± 10 448 ± 24 456 ± 21 0.33 Maximal walking distance (m) 591 ± 42 511 ± 46 561 ± 82 0.39 Claudication onset time (s) 270 ± 28 217 ± 50 294 ± 49 0.15 Peak walking time (s) 648 ± 61 667 ± 161 620 ± 81 0.40 VO2 peak (ml/kg/min) 18 ± 0.7 18 ± 2 18 ± 1 0.99 Maximal blood flow (ml/100 ml/min) 10.9 ± 0.9 10 ± 0.5 9.96 ± 2.4 0.96 Ankle brachial index 0.57 ± .0.03 0.54 ± 0.05 0.52 ± 0.04 0.76
Smoking 7 (25) 1 (13) 4 (50) 0.05
Aspirin 20 (71) 6 (75) 4 (50) 0.15
Statin 17 (60) 5 (62) 3 (38) 0.16
Previous vascular surgery 8 (29) 0 (0) 5 (62) 0.03 Systolic pressure 144 ± 4 134 ± 7 156 ± 10 0.04 Diastolic pressure 82 ± 2 77 ± 4 89 ± 3 0.01
[image:5.595.59.539.191.449.2] [image:5.595.62.539.501.681.2]often previous vascular surgery and higher blood pres-sure at baseline. This might indicate a more severe ath-erosclerotic disease (Table 1).
Changes in walking performance after exercise
Claudication onset time and peak walking time increased in the whole group (p = 0.0058, p = 0.0144), in the posi-tive responders (p = 0.0273, p < 0.00001) and decreased in the negative responders (p = 0.049, p = 0.0005) (Fig. 1).
Peripheral hemodynamics
Ankle brachial index (ABI) and maximal hyperemic response to ischemia did not change within groups and did not differ between groups.
Relationship between peak walking time and mitochondrial function
Multiple linear regression of the whole group (n = 28) showed a relationship between changes in peak walking time and changes in mitochondrial respiration supported
Table 2 Relationship between peak walking time and mitochondrial respiration, quality, control and content after exer-cise in the whole group (n = 28)
p values are calculated by multiple linear regression using change in peak walking time as dependent variable and changes in mitochondrial values as the independent values. Baseline ankle brachial index, acetylsalicylic acid usage, smoking, hypertension and previous vascular surgery were used as covariates Mitochondrial respiration (pmol O2/s/mg wet weight of muscle fibers) variables: (ETF + CI)L is the LEAK state electron transfer through electron transferring
flavoprotein (ETF) and complex I after addition of the substrates octanoylcarnitin (0.2 mM) + malate (2 mM), in the absence of ADP; (ETF + CI)P is fatty acid
OXPHOS capacity after addition of ADP (5 mM); (CI + ETF)P is electron transfer through complex I and ETF reaching complex I OXPHOS capacity after addition
of glutamate (10 mM); (CI + II + ETF)P is electron transfer through complex I, II and ETF reaching complex I and II OXPHOS capacity after addition of succinate
(10 mM); (CI + II + ETF)E is electron transfer through complex I, II and ETF reaching ETS capacity after FCCP titrations (0.5 M max. 3 M) to uncouple oxidation from
phosphorylation; (CII)E is ETS capacity supported by complex II after addition of rotenone (0.5 M), which inhibits complex I. The subscripts L, P, E indicate the LEAK
state, OXPHOS and ETS capacity
Variables of mitochondria quality, control and content: OXPHOS coupling efficiency (1 − (ETF + CI)L/(ETF + CI)P). excess electron transfer system-phosphorylation
(E-P) capacity factor (1 − (CI + CII + ETF)P/(CI + CII + ETF)E). Complex II control factor (1 − (CI + ETF)P/(CI + CII + ETF)P). Citrate synthase activity (umol/min/mg of
protein)
β-Coefficient SE 95% confidence interval p value
(ETF + CI)L −10.02 5.08 −20.74 0.70 0.065
(ETF + CI)P 10.54 3.14 3.92 17.15 0.004
(CI + ETF)P 12.30 3.57 4.77 19.84 0.003
(CI + CII + ETF)P 4.77 2.10 0.33 9.20 0.037
(CI + CII + ETF)E 2.41 1.45 −0.66 5.47 0.116
(CII)E 3.49 2.10 −0.94 7.92 0.115
OXPHOS coupling efficiency 149 60 20 278 0.046
Excess E-P capacity factor −127 372 −912 657 0.736 Complex II control factor −290 365 −1061 480 0.438 Citrate synthase activity −132 428. −1065 800 0.762
[image:6.595.58.539.260.402.2] [image:6.595.63.536.545.684.2]by electron transferring flavoprotein ((ETF + CI)P, p = 0.004), complex I ((CI + ETF)P, p = 0.003), complex I and II ((CI + CII + ETF)P, p = 0.037) and OXPHOS cou-pling efficiency (p = 0.046) (Table 2).
Mitochondrial respiration
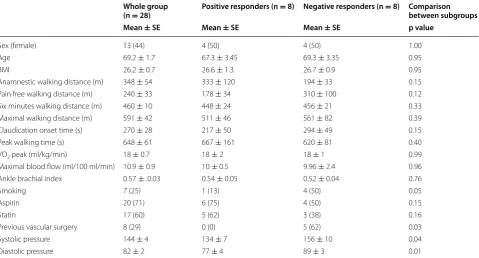
Mitochondrial respiration was similar at baseline in the whole group and subgroups.
Mitochondrial respiration did not change in the whole group and the subgroup of positive responders (Fig. 2a, b). Negative responders decreased mitochondrial res-piration supported by electron transferring flavopro-tein (ETF + CI)P (p = 0.0013), complex I (CI + ETF)P (p = 0.0005), complex I + complex II (CI + CII + ETF)P
(p = 0.011) and electron transfer capacity
(CI + CII + ETF)E (p = 0.021). Furthermore they
increased mitochondrial respiration supported by elec-tron transferring flavoprotein (ETF + CI)L (p = 0.0058) before addition of ADP (Fig. 2c). The latter indicating a pathological dyscoupling in mitochondrial respiration.
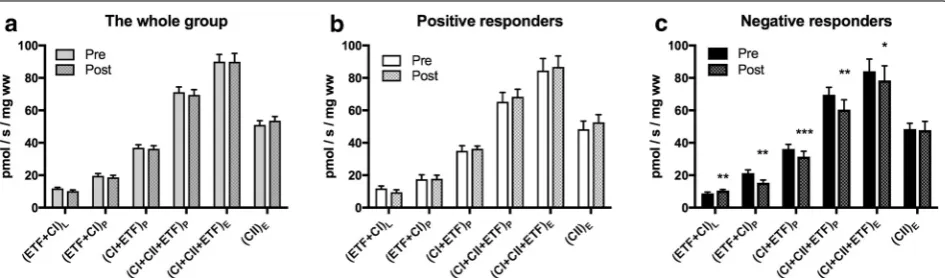
Mitochondrial quality, control and mitochondrial content
Measures of mitochondrial quality, control and mito-chondrial content were similar at baseline in the whole group and subgroups. OXPHOS coupling efficiency decreased in positive (p = 0.045) and negative respond-ers (p = 0.0007) (Fig. 3a). Meaning a decreased cou-pling of oxidation to phosphorylation, possibly leading to less ATP production, if not compensated for with increased mitochondrial content. Excess electron phos-phorylation capacity factor increased in the negative responders (p = 0.03), indicating increased limitation of
Fig. 3 Mitochondrial quality, control and mitochondrial content. Treadmill walking performance in the whole group (n = 28, grey) and sub-groups of positive (n = 8, white) and negative responders (n = 8, black). a OXPHOS coupling efficiency (1 − (ETF + CI)L/(ETF + CI)P). b Excess
electron transfer system-phosphorylation (E-P) capacity factor (1 − (CI + CII + ETF)P/(CI + CII + ETF)E). c Complex II control factor (1 − (CI + ETF)P/
(CI + CII + ETF)P). d Citrate synthase activity (umol/min/mg of protein); Values are mean and standard error of the mean. p values are calculated by
[image:7.595.60.539.289.663.2]mitochondrial capacity (CI + CII + ETF)P by the elec-tron transport capacity (CI + CII + ETF)L (Fig. 3b). Citrate synthase activity, a biomarker of mitochondrial content, increased in the whole group (p = 0.008) and the positive responders (p = 0.010), while it did not change in the negative responders (p = 0.90) (Fig. 3d).
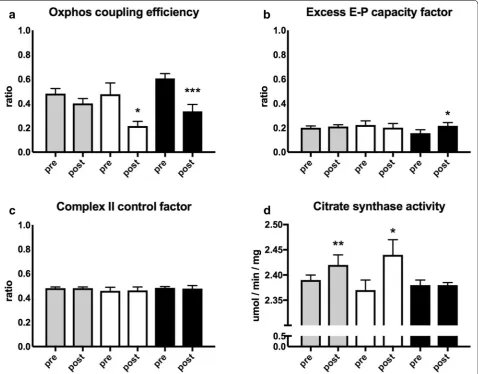
Mitochondrial respiration corrected for mitochondrial content
Mitochondrial respiration was corrected for mitochon-drial content by dividing mitochonmitochon-drial respiration val-ues with citrate synthase activity.
After this calculation, corrected mitochondrial res-piration did not change in the whole group and the subgroup of positive responders (Fig. 4a, b). While the negative responders decreased corrected mito-chondrial respiration supported by electron transfer-ring flavoprotein (ETF + CI)P (p = 0.0017), complex I (CI + ETF)P (p = 0.0044), complex I + complex II (CI + CII + ETF)P (p = 0.0046) and electron transfer capacity (CI + CII + ETF)E (p = 0.0005) (Fig. 4c).
Discussion
This study shows that changes in walking performance after exercise relate to changes in mitochondrial capac-ity. We also demonstrate that exercise induces mitochon-drial changes that seem to be different in subgroups of negative and positive responders. Negative responders decreased mitochondrial respiration after 8 weeks of exercise, while positive responders increased citrate syn-thase activity. Surprisingly no increase in mitochondrial respiration was found in the positive responders.
The variable peak walking time was used to differenti-ate between negative and positive responders. Peak walk-ing time is achieved at maximal effort of patients with IC during a standardized treadmill test. Extensive expe-rience in multicentre studies with treadmill testing has
been acquired over several decades and is therefore pre-ferred over other tests of walking performance [22].
Previous research supports that exercise, independent of type and intensity, is beneficial for walking performance in patients with IC [23]. In our study exercise induced improvements in walking performance in certain patients and reduced or had no effect in others. Even if previous group analyses demonstrate the benefit of exercise, this might not be the case for each individual. The present paper is an example of an approach, which tries to estab-lish personalised medicine. We try to define what is good for a single patient and not based on what is good for the patient according to the group he or she belongs to.
Several exercise studies on patients with IC have shown that mitochondrial enzyme activities increase after exer-cise. Relationship between increases in mitochondrial enzymes cytochrome C oxidase (complex IV) [4] and succinic oxidase (complex II) [24] and improvements in walking performance seem to exist. Lundgren et al. observed that an increase in cytochrome C oxidase was related to increased walking performance after exercise [4]. We used mitochondrial respirometry, which is an assay of complexes collectively functioning during oxida-tive phosphorylation in acoxida-tively respiring muscle mito-chondria. The mitochondrial enzyme activities, as used by Lundgren et al., are assays of one complex isolated from the other complexes, which does not reflect the whole mitochondrial physiology. Based on our data we also show that a relationship between changes in walking performance and changes in mitochondrial respiration supported by electron transferring flavoprotein and com-plex I seem to exist.
[image:8.595.61.539.87.232.2]time after exercise were related to cardiac morbidity [25]. Both the data of Dörenkamp et al. and ours indi-cate that the response to exercise is dependent on degree of arteriosclerosis. Dörenkamp et al. also showed that age, gender, BMI and current smoking influenced walk-ing performance after exercise. These variables were not different in our subgroups. This could be a result of the small number in our study. Some clinical variables con-nected to atherosclerosis might therefore predict the out-come following exercise but according to our data not the state of the mitochondria at baseline.
Similar levels of mitochondrial respiration and citrate synthase activity were found in the subgroups at base-line. The response to exercise could thereby be compared based on the change within and between each subgroup. After 8 weeks, the negative responders decreased mito-chondrial respiration mainly supported by electron transferring protein (ETF) and complex I. Furthermore, a decreased OXPHOS coupling efficiency (OCE) was found in negative responders suggesting a less coupled electron transfer system. The formula for calculating OCE is (1 − (ETF + CI)L/(ETF + CI)P) which represents the ratio of oxygen consumption (supported by ETF and CI) from ADP to ATP. Therefore, the formula could be rewritten as OCE = (1 − before ADP/after ADP). OCE is an indirect measurement of the ADP/ATP ratio. The direct measurement of the ADP/ATP ratio is generally used as a marker of the energy state of the cell and apop-tosis. Low ADP/ATP ratios indicate a low energy state of the cell and is expected in an electron transfer system when OCE is low. A poor efficiency of the electron trans-fer system to produce ATP from ADP might cause a low ADP/ATP ratio.
The excess electron transfer system-phosphorylation factor capacity was increased and thereby the mitochon-drial capacity is limited by the electron transfer system capacity. Altogether we demonstrate reduced mitochon-drial capacity and increased mitochonmitochon-drial dysfunction in negative responders after exercise.
Increased mitochondrial DNA injury has been shown in peripheral arterial disease [26–28]. Respiration sup-ported by ETF and complex I decreased in the negative responders, while complex II did not change. ETF and complex I are encoded by both nuclear and mitochon-drial DNA, while complex II is encoded only by nuclear DNA. This supports the notion that damage to mito-chondrial DNA might partly be the cause of decreased mitochondrial respiration in the negative responders.
Interestingly mitochondrial respiration was similar in positive responders at baseline and after the exercise intervention indicating that mitochondrial DNA might be preserved. Positive responders only increased citrate synthase activity. Positive responders seem to improve
mitochondrial capacity through increased quantity pos-sibly compensating for the reduced OXPHOS coupling efficiency. Thereby being able to utilize more ATP for a given amount of oxygen, which results in a longer peak walking time.
Mitochondrial respiration has been shown to be pre-served after ischemic preconditioning [9, 29]. While reduced mitochondrial respiration has been shown with increased degree of peripheral arterial disease [1]. Probably both nuclear and mitochondrial DNA play a central role in the response to ischemia and reperfu-sion. ROS and mapping of nuclear and mitochondrial genome of patients with IC might be the next approach to personalized medicine for these patients. The goal being to predict whether improvements after exercise are likely to occur in each patient individually. Future research in our group will elucidate whether exercise of patients with intermittent claudication increase mito-chondrial ROS production and whether this results in damage to mitochondrial DNA, dependent on the level of disease.
Conclusions
Negative responders to exercise, measured as decreased peak walking time, have a more advanced degree of peripheral arterial disease compared to those that respond positively. The negative responders reduce their mitochondrial respiration capacity, whereas positive responders improve mitochondrial capacity after exer-cise, through increased mitochondrial content. Further-more, relationships between changes in peak walking time and mitochondrial respiration seem to exist.
Limitation
The training regimens were home-based and without supervision, which could be a leading factor to variability. It is normal practice at the vascular clinic that instruction in exercise is only provided once to patients, and it was the intent of the current study to reproduce this prac-tice. We were mainly interest in the effects after one sin-gle instruction of exercise and not the effect of different types of exercise. The latter would have needed supervi-sion to guarantee adherence.
Abbreviations
ABI: ankle brachial index; ETF: electron transferring flavoprotein; ETS: electron transfer system; IC: intermittent claudication; OXPHOS: oxidative phosphoryla-tion; PAD: peripheral arterial disease; ROS: radical oxygen species; SE: standard error of the mean.
Authors’ contributions
Author details
1 Department of Circulation and Medical Imaging, Norwegian University
of Science and Technology, PO box 8905, 7491 Trondheim, Norway. 2
Depart-ment of Vascular Surgery, St. Olavs Hospital, Trondheim, Norway.
Acknowledgements
Treadmill testing was provided by NeXt Move, Norwegian University of Sci-ence and Technology (NTNU). The randomization procedure was provided by the Unit for Applied Clinical Research, Norwegian University of Science and Technology (NTNU).
We thank Thomas Fremo, Ragnhild Røsbjørgen and Berit Marianne Bjelkåsen for excellent technical support and conducting randomization of the study.
Competing interests
The authors declare that they have no competing interests.
Availability of the data and materials
The datasets used and/or analysed during the current study are available from the corresponding author.
Ethics approval and consent to participate
All experimental protocols and procedures were approved by the regional committee of medical and health research ethics, central Norway (nr. 2011/2533) and conformed to the Declaration of Helsinki. Written informed consent was obtained from all participants.
Funding
The work was financed by the Liaison Committee between the Central Nor-way Regional Health Authority (RHA) and the Norwegian University of Science and Technology (NTNU), Norway. The funding bodies had no role in the study.
Publisher’s Note
Springer Nature remains neutral with regard to jurisdictional claims in pub-lished maps and institutional affiliations.
Received: 21 December 2016 Accepted: 31 May 2017
References
1. Pipinos II, Sharov VG, Shepard AD, Anagnostopoulos PV, Katsamouris A, Todor A, et al. Abnormal mitochondrial respiration in skeletal muscle in patients with peripheral arterial disease. J Vasc Surg. 2003;38:827–32. 2. Brass EP, Hiatt WR. Acquired skeletal muscle metabolic myopathy in
atherosclerotic peripheral arterial disease. Vasc Med. 2000;5:55–9. 3. Parmenter BJ, Raymond J, Dinnen P, Singh MAF. A systematic review
of randomized controlled trials: walking versus alternative exercise prescription as treatment for intermittent claudication. Atherosclerosis. 2011;218:1–12.
4. Lundgren F, Dahllöf AG, Scherstén T, Bylund-Fellenius AC. Muscle enzyme adaptation in patients with peripheral arterial insufficiency: spontaneous adaptation, effect of different treatments and consequences on walking performance. Clin Sci. 1989;77:485–93.
5. Gardner AW, Poehlman ET. Exercise rehabilitation programs for the treat-ment of claudication pain. A meta-analysis. JAMA. 1995;274:975–80. 6. Norgren L, Hiatt WR, Dormandy JA, Nehler MR, Harris KA, Fowkes FGR.
Inter-society consensus for the management of peripheral arterial dis-ease (TASC II). Eur J Vasc Endovasc Surg. 2007;33:S1–75.
7. Kooijman HM, Hopman MT, Colier WN, van der Vliet JA, Oeseburg B. Near infrared spectroscopy for noninvasive assessment of claudication. J Surg Res. 1997;72:1–7.
8. Slagsvold KH, Johnsen AB, Rognmo O, Høydal MA, Wisløff U, Wahba A. Mitochondrial respiration and microRNA expression in right and left atrium of patients with atrial fibrillation. Physiol Genom. 2014;46:505–11. 9. Thaveau F, Zoll J, Rouyer O, Chafke N, Kretz JG, Piquard F, et al. Ischemic
preconditioning specifically restores complexes I and II activities of the
mitochondrial respiratory chain in ischemic skeletal muscle. J Vasc Surg. 2007;46:541–7.
10. Tisi PV, Hulse M, Chulakadabba A, Gosling P, Shearman CP. Exercise training for intermittent claudication: does it adversely affect biochemi-cal markers of the exercise-induced inflammatory response? Eur J Vasc Endovasc Surg. 1997;14:344–50.
11. Tisi PV, Shearman CP. The evidence for exercise-induced inflammation in intermittent claudication: should we encourage patients to stop walking? Eur J Vasc Endovasc Surg. 1998;15:7–17.
12. Larsen OA, Lassen NA. Effect of daily muscular exercise in patients with intermittent claudication. Lancet. 1966;2:1093–6.
13. ATS Committee on Proficiency Standards for Clinical Pulmonary Function Laboratories. ATS statement: guidelines for the 6-min walk test. Am J Respir Crit Care Med. 2002;166:111–7.
14. Hiatt WR, Regensteiner JG, Hargarten ME, Wolfel EE, Brass EP. Benefit of exercise conditioning for patients with peripheral arterial disease. Circula-tion. 1990;81:602–9.
15. McDermott MM, Liu K, Guralnik JM, Mehta S, Criqui MH, Martin GJ, et al. The ankle brachial index independently predicts walking velocity and walking endurance in peripheral arterial disease. J Am Geriatr Soc. 1998;46:1355–62.
16. Alomari MA, Solomito A, Reyes R, Khalil SM, Wood RH, Welsch MA. Measurements of vascular function using strain-gauge plethysmography: technical considerations, standardization, and physiological findings. Am J Physiol Heart Circ Physiol. 2004;286:H99–107.
17. Hayot M, Michaud A, Koechlin C, Caron M-A, LeBlanc P, Prefaut C, et al. Skeletal muscle microbiopsy: a validation study of a minimally invasive technique. Eur Respir J. 2005;25:431–40.
18. Pesta D, Gnaiger E. High-resolution respirometry: OXPHOS protocols for human cells and permeabilized fibers from small biopsies of human muscle. In: Moreno AJ, Palmeira CM, editors. Totowa: Humana Press; 2012. p. 25–58.
19. Jacobs RA, Lundby C. Mitochondria express enhanced quality as well as quantity in association with aerobic fitness across recreationally active individuals up to elite athletes. J Appl Physiol. 2013;114:344–50. 20. van Schaardenburgh M, Wohlwend M, Rognmo O, Mattsson EJR.
Mito-chondrial respiration after one session of calf raise exercise in patients with peripheral vascular disease and healthy older adults. PLoS ONE. 2016;11:e0165038.
21. Larsen S, Nielsen J, Hansen CN, Nielsen LB, Wibrand F, Stride N, et al. Biomarkers of mitochondrial content in skeletal muscle of healthy young human subjects. J Physiol. 2012;590:3349–60.
22. Hiatt WR, Rogers RK, Brass EP. The treadmill is a better functional test than the 6-minute walk test in therapeutic trials of patients with peripheral artery disease. Circulation. 2014;130:69–78.
23. Lane R, Ellis B, Watson L, Leng GC. Exercise for intermittent claudication. Cochrane Database Syst Rev. 2014;7:CD000990.
24. Holm J, Dahllöf AG, Björntorp P, Scherstén T. Enzyme studies in muscles of patients with intermittent claudication. Effect of training. Scand J Clin Lab Invest. 1973;128:201–5.
25. Dörenkamp S, Mesters I, de Bie R, Teijink J, van Breukelen G. Patient char-acteristics and comorbidities influence walking distances in symptomatic peripheral arterial disease: a large 1-year physiotherapy cohort study. PLoS ONE. 2016;11:e0146828.
26. Wang H, Hiatt WR, Barstow TJ, Brass EP. Relationships between muscle mitochondrial DNA content, mitochondrial enzyme activity and oxida-tive capacity in man: alterations with disease. Eur J Appl Physiol Occup Physiol. 1999;80:22–7.
27. Brass EP, Wang H, Hiatt WR. Multiple skeletal muscle mitochondrial DNA deletions in patients with unilateral peripheral arterial disease. Vasc Med. 2000;5:225–30.
28. Bhat HK, Hiatt WR, Hoppel CL, Brass EP. Skeletal muscle mitochondrial DNA injury in patients with unilateral peripheral arterial disease. Circula-tion. 1999;99:807–12.