Spatial distribution of Galactic Wolf–Rayet stars and implications for the
global population
C. K. Rosslowe
‹and P. A. Crowther
Department of Physics and Astronomy, University of Sheffield, Hicks Building, Hounsfield Road, S3 7RH, UK
Accepted 2014 November 26. Received 2014 November 26; in original form 2014 September 5
A B S T R A C T
We construct revised near-infrared absolute magnitude calibrations for 126 Galactic Wolf– Rayet (WR) stars at known distances, based in part upon recent large-scale spectroscopic surveys. Application to 246 WR stars located in the field permits us to map their Galactic distribution. As anticipated, WR stars generally lie in the thin disc (∼40 pc width at half-maximum) between Galactocentric radii 3.5–10 kpc, in accordance with other star formation tracers. We highlight 12 WR stars located at vertical distances of≥300 pc from the mid-plane. Analysis of the radial variation in WR subtypes exposes a ubiquitously higherNWC/NWNratio than predicted by stellar evolutionary models accounting for stellar rotation. Models for non-rotating stars or accounting for close binary evolution are more consistent with observations. We consolidate information acquired about the known WR content of the Milky Way to build a simple model of the complete population. We derive observable quantities over a range of wavelengths, allowing us to estimate a total number of 1900 ± 250 Galactic WR stars, implying an average duration of∼0.4 Myr for the WR phase at the current Milky Way star formation rate. Of relevance to future spectroscopic surveys, we use this model WR population to predict follow-up spectroscopy toKS 17.5 mag will be necessary to identify 95 per cent
of Galactic WR stars. We anticipate that ESA’s Gaia mission will make few additional WR star discoveries via low-resolution spectroscopy, though will significantly refine existing distance determinations. Appendix A provides a complete inventory of 322 Galactic WR stars discovered since the VIIth catalogue (313 including Annex), including a revised nomenclature scheme.
Key words: stars: distances – stars: evolution – stars: massive – stars: Wolf–Rayet – Galaxy: disc – infrared: stars.
1 I N T R O D U C T I O N
Massive stars exert a major influence on their immediate surround-ings, and play a dominant role in the evolution of their host galaxies. Wolf–Rayet (WR) stars represent the ultimate, short-lived (<1Myr) evolutionary phase of only the most massive (Mi>25 M) O stars (see Crowther 2007). They possess dense and fast stellar winds, giving them characteristic strong and broad emission line spectra. Their distinctive spectral appearance befits them as effective tracers of high-mass star formation both in the Galaxy (e.g. Kurtev et al. 2007; Davies et al.2012a) and at extragalactic distances (Schaerer & Vacca 1998). Through their powerful winds and likely fate as Type Ib/c supernovae (SNe), they are important sources of nuclear processed material to the interstellar medium (Esteban & Peim-bert1995; Dray et al.2003), and are capable of influencing fur-ther episodes of star formation on local (Shetty & Ostriker2008;
E-mail:[email protected]
Kendrew et al.2012) and galactic (Hopkins, Quataert & Murray 2011) scales. However, the postulated link between WR stars and H-free Type Ib/c SN remains unestablished (Eldridge et al.2013), hence it is crucial that we better our knowledge of the uniquely resolvable population in the Milky Way.
Strong mass-loss in WR stars proceeds to unveil successive lay-ers of nuclear processed material, such that examples are seen with spectra dominated by nitrogen (WN), carbon (WC), and oxygen (WO). WC and WO stars are universally H free and He rich, whereas the surface H mass fraction of WN stars varies from zero toXH 50 per cent. A subset of H-rich WN stars display weak
hy-drogen emission andintrinsichydrogen absorption lines, referred to here as WNha stars (see Crowther & Walborn 2011). These stars are almost uniquely found in young clusters, suggesting cur-rent masses>65 Mfrom cluster turn-offs and higher luminosities than their core He-burning counterparts (Crowther et al.1995a), and hence are very rare. They differ from ‘classical’ He core-burning WR stars in that they represent an extension of the upper main sequence (MS), and are thought to be H burning. We treat these
C
objects separately from other WN stars when calibrating absolute magnitudes.
Our knowledge of the Galaxy’s WR content rests on the succes-sive achievements of tailored imaging surveys. The use of narrow-band selection techniques was pioneered by Massey & Conti (1983) and Moffat & Shara (1983) to identify extragalactic WR stars, tak-ing advantage of strong WR star emission lines at optical wave-lengths. Shara et al. (1991,1999) applied similar methods to push the extent of the known Galactic population beyond 5 kpc from the Sun, and extension to near-infrared (IR) wavelengths has fa-cilitated yet deeper investigation of the Galactic disc (Shara et al. 2009,2012). Another distinctive feature of WR stars – the near-IR excess caused by free–free emission in their winds – has been ex-ploited to yield further discoveries (Homeier et al.2003; Hadfield et al.2007; Mauerhan, Van Dyk & Morris2011). These efforts, alongside several serendipitous discoveries (e.g. Clark et al.2005; Mauerhan et al.2010a), have brought the recognized Galactic WR star population to∼635 as of 2014 March.1
Several attempts have been made to determine the total number of WR stars in the Galaxy. Maeder & Lequeux (1982) used the then-known 157 WR stars to arrive at a total of∼1200 by assuming the surface density of WR stars to vary with Galactocentric radius (RG) in the same way as giant HIIregions, including a dearth at RG 3 kpc. To emphasize the need for IR investigation, Shara
et al. (1999) created a model WR star population featuring a stellar disc of exponentially increasing density towardsRG =0. From this
they inferred a total of 2500 Galactic WR stars, or 1500 if few WR stars inhabit the regionRG 3 kpc, as the decline in gas density
suggests (barring the inner 500 pc). van der Hucht (2001) arrived at a much higher 6500 WR stars by extrapolating the surface density of local WR stars (7<RG<12 kpc) across the entire disc, neglecting
the decrease in star formation rate (SFR) interior toRG ∼ 3 kpc.
Most recently, in the light of numerous WR star discoveries in IR surveys, Shara et al. (2009) presented an updated population model – still featuring an exponential disc of stars – yielding a total of 6400. The same work also suggested that observations of WR stars as faint asK 15.5 mag are necessary to achieve a completeness of 95 per cent.
The Galaxy provides a range of environments over which to test various predictions of massive star evolution, which has long been expected to depend on metallicity (Z). As the winds of hot stars are driven by the transfer of photon momentum to metal lines (see Puls, Vink & Najarro2008for a recent review), and mass-loss dominates the evolutionary fate of the most massive stars, we expect to observe differences between the population of evolved massive stars in the metal-rich Galactic Centre (GC) regions, and that of the metal-poor outer Galaxy. Smith (1968) first observationally demonstrated ev-idence for differences in WR populations between the Milky Way and Magellanic Clouds. Crowther et al. (2002) showed that WC subtype variations are primarily a consequence of denser stellar winds at higher metallicity, while WN stars have long been known to be a more heterogeneous group. Increased mass-loss is predicted to have two main effects of WR surface properties; more efficient removal of outer (hydrogen-rich) layers will lead to quicker pro-gression through post-MS evolutionary phases, i.e. from WN to WC stages, and the accelerated spin-down of a star due to loss of angular momentum will inhibit various internal mixing processes, with implications for the lifetimes of evolutionary phases (Maeder & Meynet2000). Systematic testing of such predictions requires
1http://pacrowther.staff.shef.ac.uk/WRcat/
statistically significant, unbiased samples of evolved massive stars, currently only available through IR investigation of the Galactic disc.
An improved set of IR tools is necessary to reveal and characterize the full Galactic WR population, allowing accurate distances and classifications to be obtained. In Section 2, we introduce improved near-IR absolute magnitude–spectral type calibrations for WR stars. In Section 3, these calibrations are applied to estimate distances to the majority of the known WR population, from which the radial variation of WR subtypes is obtained, allowing a comparison with evolutionary model predictions. In Section 4, we develop a toy model to estimate the global WR population of the Milky Way. Finally, we make predictions about the detectability of WR stars, which may be of interest to those planning future surveys. Our findings are summarized in Section 5. Appendix A lists all 322 Galactic WR stars discovered since the VIIth catalogue of van der Hucht (2001) and its Annex (van der Hucht2006).
2 C A L I B R AT I O N O F I R A B S O L U T E M AG N I T U D E S F O R W R S TA R S
van der Hucht (2001) reviewed and updated thev-band absolute magnitude for Galactic WR stars. However, the accuracy and use-fulness of this relation is limited by the relatively small number of WR stars observable at optical wavelengths. Recent discoveries of visibly obscured WR stars provide a much larger sample, from which broad-band calibrations in the near-IR may be obtained. In this section, we present a calibration of absolute magnitudes over the wavelength range 1-8μm for each WR spectral type, extending earlier results by Crowther et al. (2006a) via additional WR stars located within star clusters that have been identified within the past decade.
2.1 Calibration sample
Adopted distances and spectral types for the WR stars used for our IR absolute magnitude calibration are shown in Tables1–3for WC/WO stars, WN stars, and WR stars in binary systems with OB companions, respectively. This sample is drawn from an up-dated online catalogue of Galactic WR stars1and totals 126, with
91 inhabiting clusters, 26 in OB associations and nine appearing ‘isolated’. By subtype, 85 of these are nitrogen (WN) type, 40 car-bon (WC) type, and 1 oxygen (WO) type. For OB associations that have been historically well studied at optical wavelengths, mem-bership is taken from Lundstr¨om & Stenholm (1984). For WR stars in visually obscured clusters we generally accept the membership conclusions of the discovering author(s), except where noted.
For most star clusters and associations considered, there is typ-ically more than one distance measurement to be found in the lit-erature. Where these measurements are in general agreement we favour methods of OB-star spectrophotometry over MS fitting. A small number of WR stars, in relative isolation, have kinematic dis-tances derived from velocity measurements of an associated nebula; we accept these distances but remain wary of kinematic distance estimates in general because of their sensitivity to the assumed Galactic rotation curve.
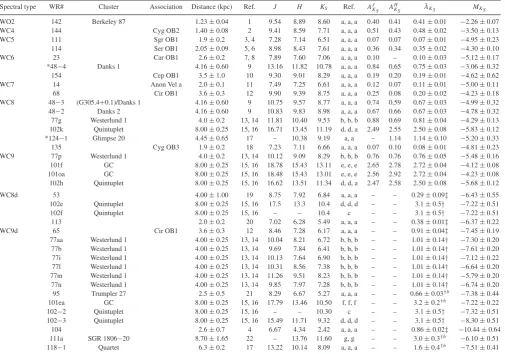
Table 1. Apparently single dust-free WO and WC stars, and dust-producing WC stars of known distance used to calibrate near-IR absolute magnitudes by spectral type. New nomenclature is explained in Appendix A.
Spectral type WR# Cluster Association Distance (kpc) Ref. J H KS Ref. AJKS AHKS A¯KS MKS
WO2 142 Berkeley 87 1.23±0.04 1 9.54 8.89 8.60 a, a, a 0.40 0.41 0.41±0.01 −2.26±0.07 WC4 144 Cyg OB2 1.40±0.08 2 9.41 8.59 7.71 a, a, a 0.51 0.43 0.48±0.02 −3.50±0.13 WC5 111 Sgr OB1 1.9±0.2 3, 4 7.28 7.14 6.51 a, a, a 0.07 0.07 0.07±0.01 −4.95±0.23 114 Ser OB1 2.05±0.09 5, 6 8.98 8.43 7.61 a, a, a 0.36 0.34 0.35±0.02 −4.30±0.10 WC6 23 Car OB1 2.6±0.2 7, 8 7.89 7.60 7.06 a, a, a 0.10 – 0.10±0.03 −5.12±0.17 *48−4 Danks 1 4.16±0.60 9 13.16 11.82 10.78 a, a, a 0.84 0.65 0.75±0.03 −3.06±0.32 154 Cep OB1 3.5±1.0 10 9.30 9.01 8.29 a, a, a 0.19 0.20 0.19±0.01 −4.62±0.62 WC7 14 Anon Vel a 2.0±0.1 11 7.49 7.25 6.61 a, a, a 0.12 0.07 0.11±0.01 −5.00±0.11 68 Cir OB1 3.6±0.3 12 9.90 9.39 8.75 a, a, a 0.25 0.08 0.20±0.02 −4.23±0.18 WC8 48−3 (G305.4+0.1)/Danks 1 4.16±0.60 9 10.75 9.57 8.77 a, a, a 0.74 0.59 0.67±0.03 −4.99±0.32 48−2 Danks 2 4.16±0.60 9 10.83 9.83 8.98 a, a, a 0.67 0.66 0.67±0.03 −4.78±0.32 77g Westerlund 1 4.0±0.2 13, 14 11.81 10.40 9.53 b, b, b 0.88 0.69 0.81±0.04 −4.29±0.13 102k Quintuplet 8.00±0.25 15, 16 16.71 13.45 11.19 d, d, a 2.49 2.55 2.50±0.08 −5.83±0.12 *124−1 Glimpse 20 4.45±0.65 17 – 10.38 9.19 a, a – 1.14 1.14±0.10 −5.20±0.33 135 Cyg OB3 1.9±0.2 18 7.23 7.11 6.66 a, a, a 0.07 0.10 0.08±0.01 −4.81±0.23 WC9 77p Westerlund 1 4.0±0.2 13, 14 10.12 9.09 8.29 b, b, b 0.76 0.76 0.76±0.05 −5.48±0.16 101f GC 8.00±0.25 15, 16 18.78 15.43 13.11 e, e, e 2.65 2.78 2.72±0.04 −4.12±0.08 101oa GC 8.00±0.25 15, 16 18.48 15.43 13.01 e, e, e 2.56 2.92 2.72±0.04 −4.23±0.08 102h Quintuplet 8.00±0.25 15, 16 16.62 13.51 11.34 d, d, a 2.47 2.58 2.50±0.08 −5.68±0.12
WC8d 53 4.00±1.00 19 8.75 7.92 6.84 a, a, a – – 0.29±0.09‡ −6.43±0.55
102e Quintuplet 8.00±0.25 15, 16 17.5 13.3 10.4 d, d, d – – 3.1±0.5† −7.22±0.51
102f Quintuplet 8.00±0.25 15, 16 – – 10.4 c – – 3.1±0.5† −7.22±0.51
113 2.0±0.2 20 7.02 6.28 5.49 a, a, a – – 0.38±0.01‡ −6.37±0.22
WC9d 65 Cir OB1 3.6±0.3 12 8.46 7.28 6.17 a, a, a – – 0.91±0.04‡ −7.45±0.19
77aa Westerlund 1 4.00±0.25 13, 14 10.04 8.21 6.72 b, b, b – – 1.01±0.14† −7.30±0.20 77b Westerlund 1 4.00±0.25 13, 14 9.69 7.84 6.41 b, b, b – – 1.01±0.14† −7.61±0.20 77i Westerlund 1 4.00±0.25 13, 14 10.13 7.64 6.90 b, b, b – – 1.01±0.14† −7.12±0.22 77l Westerlund 1 4.00±0.25 13, 14 10.31 8.56 7.38 b, b, b – – 1.01±0.14† −6.64±0.20 77m Westerlund 1 4.00±0.25 13, 14 11.26 9.51 8.23 b, b, b – – 1.01±0.14† −5.79±0.20 77n Westerlund 1 4.00±0.25 13, 14 9.85 7.97 7.28 b, b, b – – 1.01±0.14† −6.74±0.20 95 Trumpler 27 2.5±0.5 21 8.29 6.67 5.27 a, a, a – – 0.66±0.03†b −7.38±0.44
101ea GC 8.00±0.25 15, 16 17.79 13.46 10.50 f, f, f – – 3.2±0.2†b −7.22±0.22
102−2 Quintuplet 8.00±0.25 15, 16 – – 10.30 c – – 3.1±0.5† −7.32±0.51 102−3 Quintuplet 8.00±0.25 15, 16 15.49 11.71 9.32 d, d, d – – 3.1±0.5† −8.30±0.51
104 2.6±0.7 4 6.67 4.34 2.42 a, a, a – – 0.86±0.02‡ −10.44±0.64
111a SGR 1806−20 8.70±1.65 22 – 13.76 11.60 g, g – – 3.0±0.3†b −6.10±0.51
118−1 Quartet 6.3±0.2 17 13.22 10.14 8.09 a, a, a – – 1.6±0.4†b −7.51±0.41
∗Indicates updated spectral types based on an improved near-IR classification scheme.
Distance references: (1) Turner et al. (2006), (2) Rygl et al. (2012), (3) Mel’Nik & Dambis (2009), (4) Tuthill et al. (2008), (5) Hillenbrand et al. (1993), (6) Djuraˇsevi´c et al. (2001), (7) Smith (2006), (8) Hur, Sung & Bessell (2012), (9) Davies et al. (2012b), (10) Cappa et al. (2010), (11) Lundstr¨om & Stenholm (1984), (12) Vazquez et al. (1995), (13) Kothes & Dougherty (2007), (14) Koumpia & Bonanos (2012), (15) Reid et al. (2009), (16) Gillessen et al. (2013), (17) Messineo et al. (2009), (18) Reid et al. (2011), (19) Mart´ın, Cappa & Testori (2007), (20) Esteban & Rosado (1995), (21) Crowther et al. (2006a), and (22) Bibby et al. (2008).
Photometry references: (a) 2MASS, (b) Crowther et al. (2006a), (c) Liermann, Hamann & Oskinova (2009), (d) Figer, McLean & Morris (1999), (e) Dong, Wang & Morris (2012), (f) Eikenberry et al. (2004), and (g) Bibby et al. (2008).
Extinction:†Average of parent cluster,‡Avtaken from van der Hucht (2001) and converted using AK =0.12Av.
2.2 Classification of WR stars from near-infrared spectra
Spectral types of approximately 50 per cent of our calibration sam-ple have been obtained from optical spectroscopy following Smith, Shara & Moffat (1996) for WN subtypes and Crowther, De Marco & Barlow (1998) for WC and WO subtypes. For the remaining objects, we reassess published spectral types based upon their near-IR (1−5μm) spectra, using an updated version of the scheme from Crowther et al. (2006a). Updated spectral types are shown in Tables 1–3. Diagnostics involve emission line equivalent width ratios drawn from adjacent ionization stages of the same atomic species. Full details will be presented elsewhere, but we shall briefly discuss the methodology here.
2.2.1 WN diagnostics
For WN stars, ratios of HeII/HeIlines provide the primary
classi-fication diagnostics; particularly HeII1.012μm/HeI1.083μm in
theJband and HeII+Brγ2.165μm/HeII2.189μm in theKband.
Degeneracies in these primary line ratios between spectral types are lifted by considering various weaker lines. For example, we find WN7–9 types can be distinguished by considering the strength of SiIV1.190μm relative to HeII 1.163μm, while an inspection
of spectral morphology in theKband permits WN4–6 stars to be distinguished using NV2.100μm and NIII2.116μm.
2.2.2 WC diagnostics
For WC stars, ratios of CII–IVprovide the primary classification
diagnostics, with CIV1.191μm/CIII0.972μm in theJband
permit-ting a consistent classification to optical lines. HeII1.012μm/HeI
1.083μm also prove useful for classification, although theHband contains little diagnostic information. However, we find the very strong CIV 1.736μm line to be useful for recognizing the
Table 2. Apparently single WN stars (and those with an insignificant companion contribution at IR wavelengths) of known distance used to calibrate near-IR absolute magnitudes by spectral type. New nomenclature is explained in Appendix A.
Spectal type WR# Cluster Association Distance (kpc) Ref. J H KS Ref. AJK
S A
H KS
¯
AKS MKS
WN2b 2 Cas OB1 2.4± 0.8 23 10.04 9.78 9.45 a, a, a 0.33 0.52 0.40±0.02 −2.86±0.72
WN3b 46 Cru OB4 4.00± 0.85 24, 25 10.20 10.08 9.83 a, a, a 0.23 0.39 0.27±0.01 −3.45±0.46
WN4b 1 Cas OB7 2.3± 0.5 3 8.21 7.86 7.48 a, a, a 0.17 0.15 0.17±0.01 −4.49±0.47
6 1.80± 0.27 26 6.35 6.23 5.89 a, a, a 0.04 0.09 0.05±0.01 −5.44±0.33
7 5.5± 0.5 27 9.97 9.67 9.27 a, a, a 0.16 0.19 0.17±0.01 −4.60±0.20
18 Car OB1 2.6± 0.2 7, 8 8.57 8.21 7.68 a, a, a 0.25 0.36 0.27±0.02 −4.67±0.17 35b Sher 1 10.0± 1.4 28 10.95 10.35 9.76 a, a, a 0.39 0.46 0.41±0.03 −5.65±0.31 WN6b *102c Quintuplet 8.00± 0.25 15, 16 – 13.12 11.53 d, d – 1.78 1.78±0.38 −4.77±0.44 111c SGR 1806-20 8.70± 1.65 22 – 14.03 12.16 f, f – 2.25 2.25±0.15 −4.79±0.44 134 Cyg OB3 1.9± 0.2 18 6.72 6.52 6.13 a, a, a 0.10 0.17 0.12±0.01 −5.39±0.23 136 Cyg OB1 1.3± 0.2 29 6.13 5.90 5.56 a, a, a 0.09 0.10 0.09±0.01 −5.10±0.33 WN7b 77sc Westerlund 1 4.0± 0.2 13, 14 10.34 9.11 8.37 b, b, b 0.76 0.66 0.74±0.05 −5.38±0.16 111−2 Cl 1813−178 3.6± 0.7 30 9.62 8.60 7.94 a, a, a 0.62 0.55 0.59±0.03 −5.44±0.42 WN3 152 Cep OB1 3.5± 1.0 10 10.49 10.32 10.04 a, a, a 0.26 0.43 0.31±0.02 −2.99±0.62 WN5 77e Westerlund 1 4.0± 0.2 13, 14 11.70 10.30 9.70 b, b, b 0.87 0.62 0.79±0.06 −4.10±0.16 77q Westerlund 1 4.0± 0.2 13, 14 11.92 10.84 10.26 b, b, b 0.70 0.59 0.67±0.04 −3.42±0.13 77sd Westerlund 1 4.0± 0.2 13, 14 12.36 11.08 10.25 b, b, b 0.92 0.94 0.93±0.04 −3.69±0.13 WN6 67 Pismis 20 Cir OB1 3.6± 0.3 12 9.28 8.86 8.45 a, a, a 0.31 0.35 0.32±0.02 −4.65±0.18 77sb Westerlund 1 4.0± 0.2 13, 14 11.00 9.98 9.45 b, b, b 0.65 0.52 0.61±0.04 −4.17±0.12 77a Westerlund 1 4.0± 0.2 13, 14 11.72 10.67 10.00 b, b, b 0.73 0.72 0.73±0.04 −3.74±0.13 77s Westerlund 1 4.0± 0.2 13, 14 10.77 9.72 9.20 b, b, b 0.66 0.51 0.61±0.04 −4.42±0.12
85 2.8± 1.1 31 – 7.94 7.48 a, a – 0.43 0.43±0.16 −5.19±0.87
*101o GC 8.00± 0.25 15, 16 17.94 14.13 11.60 e, e, e 3.00 3.20 3.11±0.04 −6.02±0.08 115 Ser OB1 2.05± 0.09 5, 6 7.99 7.42 6.95 a, a, a 0.41 0.44 0.42±0.02 −5.03±0.10
WN7 75ba 4.1± 0.4 32 10.22 9.29 8.91 a, a, a 0.56 0.39 0.51±0.04 −4.67±0.23
77r Westerlund 1 4.0± 0.2 13, 14 11.63 10.31 9.61 b, b, b 0.90 0.83 0.87±0.04 −4.27±0.13 77j Westerlund 1 4.0± 0.2 13, 14 11.36 9.97 9.28 b, b, b 0.93 0.82 0.89±0.04 −4.62±0.13 77d Westerlund 1 4.0± 0.2 13, 14 11.06 9.83 9.26 b, b, b 0.80 0.65 0.74±0.04 −4.49±0.13 *77sa Westerlund 1 4.0± 0.2 13, 14 12.11 10.75 10.04 b, b, b 0.92 0.85 0.89±0.04 −3.86±0.13 78 NGC 6231 Sco OB1 1.64± 0.03 33 5.44 5.27 4.98 a, a, a 0.16 0.25 0.18±0.01 −6.27±0.05 87 Halven–Moffat 1 3.3± 0.3 34 8.00 7.45 7.09 a, a, a 0.37 0.36 0.37±0.02 −5.88±0.20 *101ai GC 8.00± 0.25 15, 16 – 14.33 12.12 e, e – 2.84 2.84±0.07 −5.23±0.10 *111−4 Cl 1813−178 3.6± 0.7 30 10.31 9.27 8.66 a, a, a 0.72 0.70 0.71±0.03 −4.84±0.42 WN8 12• Bochum 7 4.2± 2.1 35 8.62 8.26 7.87 a, a, a 0.29 0.40 0.32±0.02 −5.57±1.09 *48−7 Danks 1 4.16± 0.60 9 9.81 8.48 7.65 a, a, a 0.97 1.01 0.99±0.04 −6.43±0.32 66 Cir OB1 3.6± 0.3 12 8.93 8.48 8.15 a, a, a 0.31 0.31 0.31±0.02 −4.94±0.18 77c Westerlund 1 4.0± 0.2 13, 14 10.89 9.57 8.86 b, b, b 0.90 0.85 0.88±0.04 −5.03±0.13 77h Westerlund 1 4.0± 0.2 13, 14 10.75 9.42 8.76 b, b, b 0.89 0.77 0.84±0.04 −5.09±0.13 89 Halven–Moffat 2 3.3± 0.3 34 7.39 6.96 6.58 a, a, a 0.32 0.39 0.34±0.02 −6.36±0.20
101b GC 8.00± 0.25 15, 16 – 13.53 11.43 e, e – 2.69 2.69±0.06 −5.77±0.09
101nc GC 8.00± 0.25 15, 16 17.38 14.23 11.91 e, e, e 2.60 2.99 2.79±0.04 −5.40±0.08 *101oc GC 8.00± 0.25 15, 16 18.66 14.93 12.61 e, e, e 2.89 2.99 2.94±0.04 −4.85±0.08 *101dd GC 8.00± 0.25 15, 16 18.96 15.43 13.01 e, e, e 2.84 3.12 2.98±0.04 −4.49±0.08 102a Arches 8.00± 0.25 15, 16 17.17 13.26 11.02 h, a, a 2.94 2.88 2.91±0.05 −6.40±0.10 *102ae Arches 8.00± 0.25 15, 16 15.43 12.40 10.62 i, i, i 2.28 2.25 2.27±0.02 −6.16±0.07 *102af Arches 8.00± 0.25 15, 16 15.97 12.81 10.88 i, i, i 2.42 2.46 2.44±0.03 −6.08±0.07 *102ah Arches 8.00± 0.25 15, 16 15.23 12.03 10.07 i, i, i 2.45 2.50 2.48±0.03 −6.92±0.07 *102al Arches 8.00± 0.25 15, 16 15.11 12.09 10.24 i, i, i 2.31 2.34 2.33±0.02 −6.60±0.07
124 3.35± 0.67 36 8.58 8.18 7.73 a, a, a 0.34 0.47 0.39±0.02 −5.28±0.44
WN9 *48−6 (G305.4+0.1)/Danks 1 4.16± 0.60 9 10.21 8.57 7.58 a, a, a 1.19 1.24 1.21±0.05 −6.73±0.32 *48−10 Danks 1 4.16± 0.60 9 9.42 8.15 7.48 a, a, a 0.86 0.79 0.83±0.04 −6.45±0.32 48-9 Danks 1 4.16± 0.60 9 8.26 7.27 6.61 a, a, a 0.72 0.77 0.74±0.03 −7.22±0.32 77k Westerlund 1 4.0± 0.2 13, 14 9.08 7.72 7.19 b, b, b 0.84 0.59 0.75±0.04 −6.57±0.13 *101m GC 8.00± 0.25 15, 16 16.58 13.53 11.32 e, e, e 2.50 2.84 2.67±0.03 −5.86±0.08 *101e GC 8.00± 0.25 15, 16 15.87 12.73 10.41 e, e, e 2.60 2.99 2.79±0.04 −6.90±0.08
*102aa Arches 8.00± 0.25 15, 16 – – 11.18 j – – 2.48±0.37† −5.82±0.39
Table 2 – continued
Spectal type WR# Cluster Association Distance (kpc) Ref. J H KS Ref. AJK
S A
H
KS A¯KS MKS 102hb Quintuplet 8.00±0.25 15, 16 14.19 10.90 9.60 d, d, c 2.18 1.61 2.01±0.09 −6.93±0.15
102i Quintuplet 8.00±0.25 15, 16 14.77 11.67 10.22 d, a, a 2.16 1.81 1.98±0.05 −6.27±0.10 102j Quintuplet 8.00±0.25 15, 16 14.66 11.77 10.23 a, a, a 2.10 1.94 2.03±0.03 −6.32±0.08 105 Sgr OB1 1.9±0.2 3, 4 7.04 6.25 5.73 a, a, a 0.56 0.58 0.57±0.02 −6.24±0.23
WN6ha 20a1 8.0±1.0 37 9.61 8.84 8.34 a, a, a 0.61 0.65 0.63±0.03 −6.80±0.38
20a2 8.0±1.0 37 9.61 8.84 8.34 a, a, a 0.61 0.65 0.63±0.03 −6.80±0.38
24 Coll 228 Car OB1 2.6±0.2 7, 8 6.10 6.01 5.82 a, a, a 0.14 0.23 0.16±0.01 −6.42±0.17 25• Trumpler 16 Car OB1 2.6±0.2 7, 8 6.26 5.97 5.72 a, a, a 0.26 0.31 0.28±0.02 −6.63±0.17 43A1 NGC 3603 7.6±0.4 38 8.57 8.36 7.78 k, k, k 0.38 0.77 0.49±0.05 −7.11±0.16 43A2 NGC 3603 7.6±0.4 38 8.98 8.77 8.19 k, k, k 0.38 0.77 0.49±0.04 −6.70±0.14 43B NGC 3603 7.6±0.4 38 7.78 7.70 7.08 k, k, k 0.34 0.83 0.47±0.03 −7.80±0.13 43C• NGC 3603 7.6±0.4 38 8.49 8.13 7.81 k, k, k 0.33 0.41 0.35±0.03 −6.95±0.13
WN7ha 22 Car 2.6±0.2 7, 8 5.71 5.58 5.39 a, a, a 0.17 0.26 0.20±0.03 −6.81±0.17
*125−3 Mercer 23 6.5±0.3 39 8.65 7.84 7.33 l, l, l 0.64 0.70 0.67±0.02 −7.40±0.10 WN9ha 79a NGC 6231 Sco OB1 1.64±0.03 33 5.15 5.09 4.90 a, a, a 0.14 0.25 0.17±0.02 −6.34±0.05 79b KQ Sco 3.5±0.5 40 6.76 6.62 6.48 a, a, a 0.16 0.19 0.17±0.01 −6.41±0.31
∗Indicates updated spectral types based on an improved near-IR classification scheme.
Spectroscopic binary systems with a dominant WR component at IR wavelengths (FWR/Fsys>2/3). Binary detections: (WR 12) Fahed & Moffat (2012), (WR 25) Gamen et al. (2006), (WR 43C) Schnurr et al. (2008), and (WR 22) Schweickhardt et al. (1999).
Distance references (1–22 as in Table1): (23) Arnal et al. (1999), (24) Crowther, Smith & Hillier (1995b), (25) Tovmassian, Navarro & Cardona (1996), (26) Howarth & Schmutz (1995), (27) Cappa et al. (1999), (28) Moffat, Shara & Potter (1991), (29) Garmany & Stencel (1992), (30) Messineo et al. (2011), (31) V´azquez et al. (2005), (32) Cohen, Parker & Green (2005), (33) Sana et al. (2006), (34) V´azquez & Baume (2001), (35) Corti, Bosch & Niemela (2007), (36) Marchenko, Moffat & Crowther (2010), (37) Rauw et al. (2007), (38) Melena et al. (2008), (39) Hanson et al. (2010), and (40) Bohannan & Crowther (1999). Photometry references (a–g as in Table1): (h) Cotera et al. (1999), (i) Espinoza, Selman & Melnick (2009), (j) Martins et al. (2008), (k) Harayama, Eisenhauer & Martins (2008), and (l) Hanson et al. (2010).
Extinction:†Average of parent cluster.
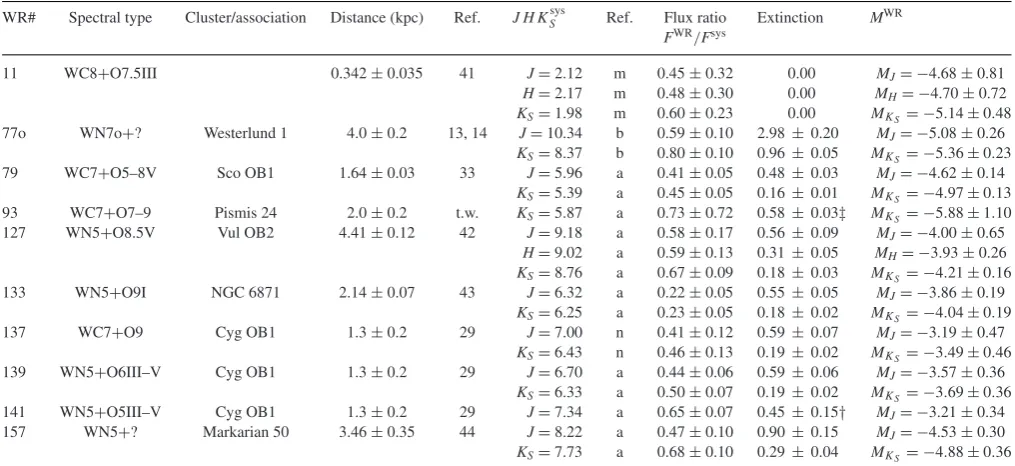
Table 3. WR stars in confirmed binary systems (WR+non-WR) used for absolute magnitude–spectral type calibrations.
WR# Spectral type Cluster/association Distance (kpc) Ref. J H KSsys Ref. Flux ratio Extinction MWR
FWR
/Fsys
11 WC8+O7.5III 0.342±0.035 41 J=2.12 m 0.45±0.32 0.00 MJ= −4.68±0.81
H=2.17 m 0.48±0.30 0.00 MH= −4.70±0.72
KS=1.98 m 0.60±0.23 0.00 MKS= −5.14±0.48 77o WN7o+? Westerlund 1 4.0±0.2 13, 14 J=10.34 b 0.59±0.10 2.98±0.20 MJ= −5.08±0.26
KS=8.37 b 0.80±0.10 0.96±0.05 MKS= −5.36±0.23 79 WC7+O5–8V Sco OB1 1.64±0.03 33 J=5.96 a 0.41±0.05 0.48±0.03 MJ= −4.62±0.14
KS=5.39 a 0.45±0.05 0.16±0.01 MKS= −4.97±0.13 93 WC7+O7–9 Pismis 24 2.0±0.2 t.w. KS=5.87 a 0.73±0.72 0.58±0.03‡ MKS= −5.88±1.10 127 WN5+O8.5V Vul OB2 4.41±0.12 42 J=9.18 a 0.58±0.17 0.56±0.09 MJ= −4.00±0.65
H=9.02 a 0.59±0.13 0.31±0.05 MH= −3.93±0.26
KS=8.76 a 0.67±0.09 0.18±0.03 MKS= −4.21±0.16 133 WN5+O9I NGC 6871 2.14±0.07 43 J=6.32 a 0.22±0.05 0.55±0.05 MJ= −3.86±0.19
KS=6.25 a 0.23±0.05 0.18±0.02 MKS= −4.04±0.19
137 WC7+O9 Cyg OB1 1.3±0.2 29 J=7.00 n 0.41±0.12 0.59±0.07 MJ= −3.19±0.47
KS=6.43 n 0.46±0.13 0.19±0.02 MKS= −3.49±0.46 139 WN5+O6III–V Cyg OB1 1.3±0.2 29 J=6.70 a 0.44±0.06 0.59±0.06 MJ= −3.57±0.36
KS=6.33 a 0.50±0.07 0.19±0.02 MKS= −3.69±0.36 141 WN5+O5III–V Cyg OB1 1.3±0.2 29 J=7.34 a 0.65±0.07 0.45±0.15† MJ= −3.21±0.34
157 WN5+? Markarian 50 3.46±0.35 44 J=8.22 a 0.47±0.10 0.90±0.15 MJ= −4.53±0.30
KS=7.73 a 0.68±0.10 0.29±0.04 MKS= −4.88±0.36 Distance references (1–40 as in Tables1and2): (41) van Leeuwen (2007), (42) Turner (1980), (43) Malchenko & Tarasov (2009), (44) Baume, V´azquez & Carraro (2004), (t.w.) this work (Appendix B).
Photometry references (a–l as in Tables1and2): (m) Williams et al. (1990b), (n) Williams et al. (2001).
Spectral types: (WR 11) De Marco & Schmutz (1999), (WR 77o) Crowther et al. (2006a), (WR 79) Smith, Shara & Moffat (1990), (WR 93) Lortet, Testor & Niemela (1984), (WR 127) de La Chevroti`ere, Moffat & Chen´e (2011), (WR 133) Underhill & Hill (1994), (WR 137) Williams et al. (2001), (WR 139) Marchenko, Moffat & Koenigsberger (1994), (WR 141) Marchenko, Moffat & Eenens (1998), and (WR 157) Smith et al. (1996).
Extinction:‡Avtaken from van der Hucht (2001) and converted using AK=0.12Av.†Average extinction taken from WR 136 and WR 139, also members of
[image:5.595.41.549.404.637.2]band, the ratio of CIV2.070-2.084μm to CIII+HeI2.112-2.114μm
serves as a good ionization diagnostic, but is incapable of discrimi-nating between WC4–6 stars.
2.2.3 Accuracy of near-IR spectral types
To gain an insight into the reliability of our revised near-IR classifi-cation scheme, we have carried out blind tests using WR stars with optically derived spectral types, and findJ- andK-band diagnostics provide the highest level of consistency.
For WN stars, an exact 3D spectral type (Smith et al.1996) can be achieved from low-resolutionJthroughKspectra, with solely theJband proving criteria for identifying the presence of hydrogen. We find spectra inJor K alone yield spectral types with an accuracy of±1, andH-band diagnostics are accurate to±2.
For WC stars, we find that an exact spectral type can be assigned solely from aJ-band spectrum. OurK-band diagnostics are capable of±1 spectral type amongst early (WC4–6) types, and exact clas-sification for late (WC7–9). We only find it possible to distinguish between WCE/WCL using spectra fromH,LorMbands. For both WN and WC stars, ionization types at either extreme (WN9, 3, 2; WC9) are conspicuous in spectral appearance, and can be identified with a higher degree of certainty, usually by inspection of the spec-tral morphology alone. Stars are only included in our calibration sample if we are confident within±1 of their spectral types.
2.3 Photometry and extinction
In general we takeJHKSphotometry for each WR star from the Two Micron All-Sky Survey (2MASS) point source catalogue (Skrutskie et al.2006), plus [3.6]-[8.0](μm) photometry from the GLIMPSE survey (Benjamin et al.2003) for sufficiently isolated sources in the surveyed field.
We require a minimum quality flag of C where 2MASS photom-etry is used. Many cluster and association members are located in fields too crowded for 2MASS to be useful. In such cases, we turn to dedicated observations with higher spatial resolution of the stellar groupings in question (Tables1–3).
We have attempted to ensure consistency in the near-IR photom-etry used. For example, observations of WR stars in the GC region are assembled by Dong et al. (2012), consisting ofHubble Space Telescopesnapshot imaging plus multiple ground-based observa-tions. In this case, to maintain consistency with other assembled photometry, we construct and apply a simple algorithm to convert the Dong et al.JHKSvalues into the 2MASS photometric system (following their equations 7–9). However, in general we regard the slight differences between ground-based filter systems as insignif-icant, as they have a much smaller effect on calculated absolute magnitudes than that of distance uncertainties.
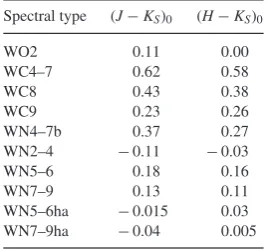
We calculate an extinction towards each calibration star by eval-uating the colour excessesEJ−KS and EH−KS, utilizing intrinsic
JHKS WR colours given by Crowther et al. (2006a), updated in Table4. Two values ofKS-band extinction follow:
AJKs=EJ−Ks×
AJ
AKS
−1
−1
(1)
and
AHKs=EH−Ks×
AH
AKS
−1
−1
. (2)
The second terms in equations (1) and (2) require knowledge of the near-IR extinction law.
Table 4. Intrinsic colours adopted for each type of WR star, primarily from Crowther et al. (2006a), supplemented with unpublished stellar atmospheric model results for additional types consid-ered here (e.g. WO).
Spectral type (J−KS)0 (H−KS)0
WO2 0.11 0.00
WC4–7 0.62 0.58
WC8 0.43 0.38
WC9 0.23 0.26
WN4–7b 0.37 0.27
WN2–4 −0.11 −0.03
WN5–6 0.18 0.16
WN7–9 0.13 0.11
WN5–6ha −0.015 0.03
WN7–9ha −0.04 0.005
Due to the growing body of evidence suggesting a ence in dust properties towards the GC, we employ two differ-ent Galactic near-IR extinction laws. For stars in the GC region (358◦<l<2◦,|b|<1◦) we use the line-derived extinction law of Fritz et al. (2011) (AJ/AKS=3.05±0.07, AH/AKS=1.74±0.03).
For all other Galactic sight lines we use the law of Stead & Hoare (2009) (AJ/AKS=3.1±0.2, AH/AKS=1.71±0.09) – an updated
form of that provided by Indebetouw et al. (2005). For the purpose of calculating the absolute magnitude of each calibration star, we take an average, ¯AKS, from equations (1) and (2). Since extinction
in the IRAC bands is lower, we opt for a more straightforward approach and use the relations given by Indebetouw et al. (2005), independent of sight line.
A minority of stars in our calibration sample only have single-band photometry available, preventing an extinction calculation by colour excess. For these objects, we resort to one of two alternatives; we adopt the averageAKS calculated for other O or WR stars in
the cluster/association if sufficient numbers are available, or we takeAv as listed in van der Hucht (2001) and convert this using AKS0.11AV0.12Av (Rieke & Lebofsky 1985). If neither is
possible we exclude the star from our sample.
2.3.1 Correction for binary companions
For cluster/OB association WR stars in spectroscopically confirmed binary systems, we attempt to correct for the contribution of com-panion(s) to systemic magnitudes, allowing an absolute magnitude calculation for the WR component. Depending on the information available about the companion star(s), we follow one of two meth-ods to apply these corrections.
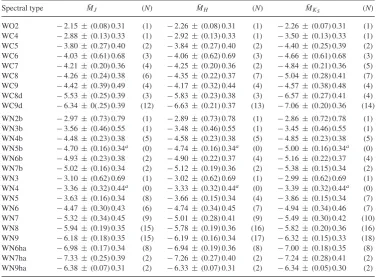
[image:6.595.362.496.123.248.2]Table 5. Calibrated near-IR absolute magnitudes for Galactic WR stars. The number of objects used to arrive at each value is indicated in adjacent parentheses. Two uncertainties are shown with each value; formal errors (parenthesized, equation 5) do not account for the intrinsic spread in magnitude within a WR spectral type – estimated to be∼0.3 mag – which is incorporated into the final (non-parenthesized) uncertainty.
Spectral type M¯J (N) M¯H (N) M¯KS (N)
WO2 −2.15±(0.08) 0.31 (1) −2.26± (0.08) 0.31 (1) −2.26± (0.07) 0.31 (1) WC4 −2.88±(0.13) 0.33 (1) −2.92± (0.13) 0.33 (1) −3.50± (0.13) 0.33 (1) WC5 −3.80±(0.27) 0.40 (2) −3.84± (0.27) 0.40 (2) −4.40± (0.25) 0.39 (2) WC6 −4.03±(0.61) 0.68 (3) −4.06± (0.62) 0.69 (3) −4.66± (0.61) 0.68 (3) WC7 −4.21±(0.20) 0.36 (4) −4.25± (0.20) 0.36 (2) −4.84± (0.21) 0.36 (5) WC8 −4.26±(0.24) 0.38 (6) −4.35± (0.22) 0.37 (7) −5.04± (0.28) 0.41 (7) WC9 −4.42±(0.39) 0.49 (4) −4.17± (0.32) 0.44 (4) −4.57± (0.38) 0.48 (4) WC8d −5.53±(0.25) 0.39 (3) −5.83± (0.23) 0.38 (3) −6.57± (0.27) 0.41 (4) WC9d −6.34±0(.25) 0.39 (12) −6.63± (0.21) 0.37 (13) −7.06± (0.20) 0.36 (14) WN2b −2.97±(0.73) 0.79 (1) −2.89± (0.73) 0.78 (1) −2.86± (0.72) 0.78 (1) WN3b −3.56±(0.46) 0.55 (1) −3.48± (0.46) 0.55 (1) −3.45± (0.46) 0.55 (1) WN4b −4.48±(0.23) 0.38 (5) −4.58± (0.23) 0.38 (5) −4.85± (0.23) 0.38 (5) WN5b −4.70±(0.16) 0.34a (0) −4.74± (0.16) 0.34a (0) −5.00± (0.16) 0.34a (0) WN6b −4.93±(0.23) 0.38 (2) −4.90± (0.22) 0.37 (4) −5.16± (0.22) 0.37 (4) WN7b −5.02±(0.16) 0.34 (2) −5.12± (0.19) 0.36 (2) −5.38± (0.15) 0.34 (2) WN3 −3.10±(0.62) 0.69 (1) −3.02± (0.62) 0.69 (1) −2.99± (0.62) 0.69 (1) WN4 −3.36±(0.32) 0.44a (0) −3.33± (0.32) 0.44a (0) −3.39± (0.32) 0.44a (0)
WN5 −3.63±(0.16) 0.34 (8) −3.66± (0.15) 0.34 (4) −3.86± (0.15) 0.34 (7) WN6 −4.47±(0.30) 0.43 (6) −4.74± (0.34) 0.45 (7) −4.94± (0.34) 0.46 (7) WN7 −5.32±(0.34) 0.45 (9) −5.01± (0.28) 0.41 (9) −5.49± (0.30) 0.42 (10) WN8 −5.94±(0.19) 0.35 (15) −5.78± (0.19) 0.36 (16) −5.82± (0.20) 0.36 (16) WN9 −6.18±(0.18) 0.35 (15) −6.19± (0.16) 0.34 (17) −6.32± (0.15) 0.33 (18) WN6ha −6.98±(0.17) 0.34 (8) −6.94± (0.19) 0.36 (8) −7.00± (0.18) 0.35 (8) WN7ha −7.33±(0.25) 0.39 (2) −7.26± (0.27) 0.40 (2) −7.24± (0.28) 0.41 (2) WN9ha −6.38±(0.07) 0.31 (2) −6.33± (0.07) 0.31 (2) −6.34± (0.05) 0.30 (2)
aAverage of adjacent types since no stars of this type are available for calibration. Two systems in our calibration sample are WNha+WNha
bina-ries. There are no known ‘classical’ WR+WR binaries, highlighting the sensitivity of post-MS evolution to initial mass. The fact that WNha+WNha binariesareobserved emphasizes their similarity to massive O stars. We separate the light contributions of individual stars to each system by considering mass ratios derived by spec-troscopic monitoring of their orbits. The stars making up WR 20a are of identical spectral type and have very similar masses (Rauw et al.2005), hence we assume an equal light contribution from each star in theJ, HandKSbands, and alter the systemic photometry accordingly. Similarly, WR 43A in the NGC 3603 cluster is com-prised of two stars with very high measured masses, 116± 31 and 89± 16 M(q= 0.8± 0.2; Schnurr et al.2008). Using the mass– luminosity relationship for very massive stars (M> 80 M) pro-vided by Yusof et al. (2013), we arrive at a light ratio of 1.46±0.47 for this system in all bands, assuming identical spectral energy dis-tributions (SEDs). We include the stars of WR 20a and WR 43A under the WN6ha spectral type in Table2.
2.3.2 Treatment of dust-forming WC stars
The majority of WC9, and a diminishing fraction of earlier WC stars, show evidence of periodic or persistent circumstellar dust produc-tion (e.g. WR 140; Williams et al. 1990a). Episodes of dust for-mation occur at perihelion passage in eccentric WC+OB systems, whereas circular orbits allow persistent dust production, enhancing the near-IR flux of the system dramatically. For completeness, we perform near- to mid-IR absolute magnitude calibrations for WC8d and WC9d spectral types based on the 18 stars at known distances. However, we do not make any attempt to remove the light
contri-bution of potential companion stars, firstly because theirKS-band flux is usually insignificant compared to that of the hot circumstellar dust, and secondly because dust production seems to be inextricably linked to the presence of these companions (Crowther2003).
Thermal emission from hot circumstellar dust dominates the IR colours of dusty WC systems, prohibiting extinction determination via near-IR colour excess. For the dusty systems in our calibra-tion sample we either adopt an averageAKS for the relevant
clus-ter/association, or itsAvfrom van der Hucht (2001) and convert this to theKSband according toAKS0.12Av.
We make an exception of WR 137 – a member of the Cyg OB1 association comprising WC7 and O9(±0.5) type stars – which dis-plays periodic dust formation episodes concurrent with its 13 yr orbit. Williams et al. (2001) presentJHKSphotometry for this sys-tem during a quiescent phase (1992–4), allowing us to derive a
KS-band flux ratio (FWR/Fsys = 0.46 ± 0.13) using line strengths
measured from spectra taken during quiescence (Vacca, private communication), and remove the O-star light. The WC7 compo-nent is included in Table3.
2.4 Calibration method and uncertainties
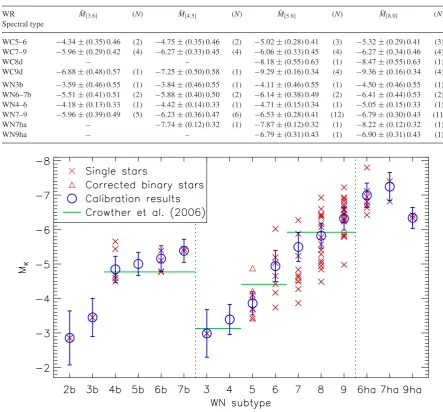
The results of our near-IR absolute magnitude calibrations are pre-sented in Table5, with mid-IR calibrations shown in Table6. Figs1 and2present theKS-band absolute magnitudes for WN and WC stars, respectively. We use a weighted mean method to arrive at an average absolute magnitude for each WR spectral type, computed by
¯ M=
n
i=1
piMi
Table 6. Calibrated mid-IR (SpitzerIRAC filters) absolute magnitudes for Galactic WR stars. The number of objects used to arrive at each value is indicated in adjacent parentheses. Two uncertainties are shown with each value; formal errors (parenthesized, equation 5) do not account for the intrinsic spread in magnitude within a WR spectral type – estimated to be∼0.3 mag – which is incorporated into the final (non-parenthesized) uncertainty.
WR M¯[3.6] (N) M¯[4.5] (N) M¯[5.8] (N) M¯[8.0] (N)
Spectral type
WC5–6 −4.34±(0.35) 0.46 (2) −4.75±(0.35) 0.46 (2) −5.02±(0.28) 0.41 (3) −5.32±(0.29) 0.41 (3) WC7–9 −5.96±(0.29) 0.42 (4) −6.27±(0.33) 0.45 (4) −6.06±(0.33) 0.45 (4) −6.27±(0.34) 0.46 (4)
WC8d – – −8.18±(0.55) 0.63 (1) −8.47±(0.55) 0.63 (1)
WC9d −6.88±(0.48) 0.57 (1) −7.25±(0.50) 0.58 (1) −9.29±(0.16) 0.34 (4) −9.36±(0.16) 0.34 (4) WN3b −3.59±(0.46) 0.55 (1) −3.84±(0.46) 0.55 (1) −4.11±(0.46) 0.55 (1) −4.50±(0.46) 0.55 (1) WN6–7b −5.51±(0.41) 0.51 (2) −5.88±(0.40) 0.50 (2) −6.14±(0.38) 0.49 (2) −6.41±(0.44) 0.53 (2) WN4–6 −4.18±(0.13) 0.33 (1) −4.42±(0.14) 0.33 (1) −4.71±(0.15) 0.34 (1) −5.05±(0.15) 0.33 (1) WN7–9 −5.96±(0.39) 0.49 (5) −6.23±(0.36) 0.47 (6) −6.53±(0.28) 0.41 (12) −6.79±(0.30) 0.43 (11) WN7ha – −7.74±(0.12) 0.32 (1) −7.87±(0.12) 0.32 (1) −8.22±(0.12) 0.32 (1)
WN9ha – – −6.79±(0.31) 0.43 (1) −6.90±(0.31) 0.43 (1)
Figure 1. Calibration ofMKS for WN spectral types. Broad-line stars are on the left, weak-line (including ‘WN#o’ and ‘WN#h’ stars) in the centre, and ‘WN#ha’ stars to the right. Individual single stars are represented by small (red) crosses, and stars that have been corrected for a companion(s) by (red) triangles. Larger (blue) symbols show the weighted average for each type with a combination of statistical error (equations 5, 6 and 7) and the estimated intrinsic spread (0.3 mag) inMKSwithin a WR spectral type. The horizontal lines represent the previous calibrations of Crowther et al. (2006a).
using weights
pi=
1 s2 i
, p=
n
i=1
pi, (4)
wheresiis the error in absolute magnitude (Mi) – invariably dom-inated by distance uncertainty – calculated for each of thenWR stars of that type. We calculate a formal error (σ) on each calibrated absolute magnitude value by combining two uncertainty estimates for weighted data:
σ=
σ2 1+σ
2
2, (5)
where
σ1=
1 √
p, (6)
and
σ2= n
i=1pi(Mi−M¯)2
p(n−1) . (7)
This combination is chosen becauseσ1depends only onsiand does not consider the spread inMi, which is taken into consideration by
σ2.
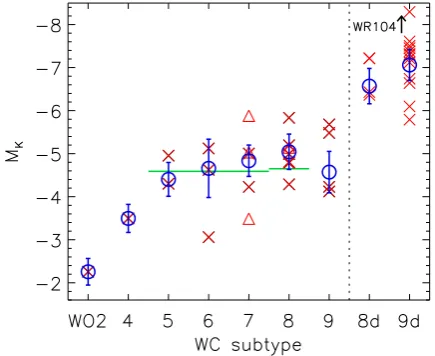
Figure 2. Calibration ofMKSfor WO and WC subtypes. To the right of the vertical dotted line are subtypes associated with circumstellar dust. WR 104 (WC9d+B) hasMKS= −10.4, outside the range displayed here. Symbols same as Fig.1.
Table 7. Intrinsic scatter in absolute magnitude within a WR spectral type.
Cluster Stars (WR#) MKSrange σMK
WN7
Westerlund 1 77d, 77j, 77r, 77sa 0.76 0.33 WN8
Arches 102a, 102ae, 102af, 102ah, 102al 0.84 0.34 GC Cluster 101b, 101dd, 101nc, 101oc 1.28 0.57 WN9
Arches 102ad, 102ag, 102ai, 102aj, 102bb, 102bc 1.85 0.72 Westerlund 1, the Arches and the GC cluster individually con-tain enough stars of a single spectral type to evaluate some basic measures of spread, effectively eliminating the scatter introduced by distance uncertainties when considering one type across multi-ple clusters. In Table7, we show the range and standard deviation in MKS within a WR spectral type. Ranges are typically<1,
al-though WN9 stars in the Arches cluster show a larger range due to the anomalously faint WR 102aj; we classify this star based on a
K-band spectrum published by Martins et al. (2008) and thus can only claim a±1 accuracy on the WN9 spectral type. Typical stan-dard deviations of 0.3–0.6 mag inMKS suggest that WR absolute
magnitudes intrinsically vary by at least ±0.3 within a spectral type. Following this result, we add an uncertainty of 0.3 mag in quadrature to the result of equation (5) (see Tables5and6), and recommend the adoption of this combined uncertainty when apply-ing these calibrated absolute magnitudes to WR stars in the field.
Throughout the rest of this paper we favour discussion and appli-cation of theMKScalibration as these results are affected by lower
(and more accurately determined) extinctions than those inJandH
bands, and are derived using the largest sample. For completeness, in the cases of WN4 and WN5b stars (unrepresented in our calibra-tion sample), we take average values in each band from the adjacent ionization types.
2.5 Results of near- to mid-IR absolute magnitude calibrations
Both strong- and weak-line WN stars show a monotonic in-crease in intrinsic near-IR brightness with ionization type. This is largely due to cooler, late-type WN stars having smaller bolometric
corrections. WN stars displaying intrinsic absorption features (the ‘ha’ stars) are the most luminous at these wavelengths, as a conse-quence of their high masses. Our results show good agreement with the calibrations of Crowther et al. (2006a) for weak-line WN stars, but suggest slightly higher IR luminosities for strong-line WN4– 7b. We note that for ionization types 6 and 7, strong- and weak-line stars have similarMKS. One would expect an enhanced
contribu-tion from free–free excess in the denser winds of ‘b’ stars to make them brighter at IR wavelengths than weak-line stars. However, the strong-line stars of these ionization types have higher effective tem-peratures (Hamann, Gr¨afener & Liermann2006), so the enhanced IR emission from free–free excess is counteracted by larger bolo-metric corrections at these subtypes.
The lower number of WC stars available reveal a less obvious variation inMKS with ionization type, yet a monotonic increase
in near-IR luminosity does appear to be present for WC4–8. As expected, dusty WC stars display a large range inMKS due to
varying quantities of dust and the range of orbital phases sampled amongst periodic dust-forming systems.
The limited area and resolution of the GLIMPSE survey results in far fewer stars available for absolute magnitude calibration at 3.6-8.0μm. Hence, in some cases spectral types showing only small differences inMKS are grouped together to provide more robust
estimates. For all WR types with GLIMPSE coverage, we observe a brightening across [3.6]–[8.0], gradual in most cases except dusty WC stars which exhibit a dramaticM ∼ 2 between [4.5] and [5.8], owing to hot circumstellar dust emission.
2.5.1 The effects of a different Galactic Centre extinction law
The results presented in this paper are produced by applying the line-derived Fritz et al. (2011) 1−19μm law – with A∝λ−α,
α = 2.13± 0.08 over the JHKSrange – to WR stars residing in the GC (358◦< l < 2◦,|b| < 1◦). Alternatively, Nishiyama et al. (2009) propose a shallower law (α = 2.0). It can be seen in equations (1) and (2) that a shallower law would lead to lower de-rived extinctions by the colour excess method. We perform a second set of absolute magnitude calibrations using the Nishiyama et al. law to quantify its effect on our results. The biggest change is seen in our calibrated absolute magnitudes for late-type WN and WC stars, as these dominate in the inner Galaxy. Compared to values presented in Table5, adopting the Nishiyama et al. law changes
¯
MJ, ¯MH, and ¯MKSof WN9 stars by−0.30,−0.31 and−0.30 mag,
respectively; WN8 stars by−0.26,−0.31,−0.32 mag, and WC9 stars by−0.27,−0.32,−0.32 mag. All differences are within our adopted uncertainties (Table5), and hence are not significant. How-ever, as we proceed to obtain further results based on these values we monitor their effects and comment where discrepancies arise.
3 T H E O B S E RV E D G A L AC T I C W R S TA R D I S T R I B U T I O N
The sample of WR stars involved in our absolute magnitude cali-brations represents approximately 20 per cent of the current known Galactic population. The remainder either have poorly defined spec-tral types, uncertain binary status, or in a majority of cases do not reside in an identified cluster or association for which a distance measurement is available. For convenience, we shall refer to any WR star not in our calibration sample (i.e. Tables1–3) as a ‘field’ star.
[image:9.595.43.283.311.407.2]Table 8. Calculated spatial locations of the 228 ‘field’ WR stars showing no conclusive evidence for an IR-bright companion, to which our calibrated absolute magnitudes have been assigned. Shown for each object are the adopted spectral type, 2MASS photometry (unless stated), derivedKS-band extinction, heliocentric distance (d), Galactocentric radius (RG) and vertical
distance from the Galactic mid-plane (z). A full version of this table is available online, and further details of stars discovered following the VIIth catalogue (WRXXX-#) are provided in Appendix A.
WR# Spectral type Ref. J H KS A¯KS d(kpc) RG(kpc) z(pc)
3 WN3ha 1 10.24 10.13 10.01 0.18±0.02 4.53±1.15 11.41±1.18 −308±83 4 WC5 2 8.75 8.57 7.88 0.13±0.01 2.69±0.49 10.15±0.55 −121±25
5 WC6 2 8.63 8.34 7.65 0.16±0.02 2.69±0.84 10.18±0.88 −82±32
13 WC6 2 10.14 9.64 8.86 0.29±0.02 4.42±1.38 9.46±1.40 −40±19
15 WC6 2 7.85 7.34 6.60 0.28±0.02 1.57±0.49 8.11±0.55 −10±9
16 WN8h 2 6.97 6.71 6.38 0.24±0.02 2.77±0.46 7.95±0.52 −104±20 17 WC5 2 9.93 9.74 9.17 0.07±0.02 5.02±0.91 8.31±0.95 −303±59 17−1 WN5b 3 11.73 10.38 9.53 0.85±0.05 5.43±0.86 8.58±0.89 −41±10 19 WC5+O9 4,5 9.75 9.13 8.53 0.20±0.02 3.52±0.64 7.93±0.69 −54±13 19a WN7(h) 2 9.07 8.13 7.50 0.71±0.04 2.41±0.47 7.78±0.53 −23±8
... ... ... ... ... ... ... ... ... ...
Spectral types: (1) Marchenko et al. (2004), (2) van der Hucht (2001), (3) this work, (4) Crowther et al. (1998), (5) Williams, Rauw & van der Hucht (2009), . . . .
presently in clusters arose via dynamical ejection or rapid cluster dissolution. It is now recognized that a high fraction of star forma-tion occurs in relatively low density regions (Bressert et al.2010), so the low fraction of WR stars in clusters does not require an un-usually high rate of ejection. Smith & Tombleson (2015) compare the association of WR stars (and luminous blue variables) in the Milky Way and Magellanic Clouds with O stars. They find WR stars to be less clustered than O-type stars, with WC stars in partic-ular showing weak spatial coincidence with O stars and H-rich WN stars.
Our WN and WC calibration samples echo this finding, with approximately half as many WC stars residing in clusters or as-sociations as WN stars. The typical velocity dispersion of cluster stars is not high enough to account for the isolation of WC stars considering their age. The relative isolation of WC stars challenges the commonly accepted evolutionary paradigm that this phase fol-lows the WN phase in the lives of the most massive stars. Two alternative scenarios may explain the locations of WC stars; either they descend from a lower initial mass regime than other WR types (Sander, Hamann & Todt2012), or the runaway fraction of WC and H-free WR stars in general is higher. Further detailed modelling of cluster collapse and the ejection of massive stars is needed to explain these emerging statistics.
In this section, we present an analysis of the spatial distribution of WR stars, where distances to 246 field WR stars are obtained by application of our absolute magnitude calibrations. Runaway WR stars are discussed further in Section 3.2.3.
3.1 ApplyingMKScalibrations
Photometry and the derived spatial information for 246 field WR stars are given in Tables8and9. For any non-dusty field WR star with a well-defined spectral type and no evidence of a significant binary companion – either spectroscopically or through dilution of near-IR emission lines – we simply apply ourMKS calibrations to
obtain a distance. For these straightforward cases, we once again use 2MASS photometry and calculate extinctions by the method described in Section 2.3.
Regarding rare WO stars, although only one star (WR 142, WO2) is available for calibration, we apply the absolute magnitude of this
star to the other three field WO stars in the Galaxy, spanning WO1–4 spectral types.
We find the spectral type and binary status of many field WR stars to be uncertain. The majority of the field sample are heav-ily reddened stars discovered by near-IR surveys, with typically only aK-band (and occasionally H-band) spectrum available in the literature; inclusion of these stars in our analysis is subject to a spectral type being attributable by our near-IR classification scheme to the required±1. Of the field WR stars included in this distribution analysis, we modify the previously claimed spectral types of ∼25 per cent of those with only IR data available, in-dicated in Tables8and 9. For the remaining 75 per cent, we ei-ther agree with previous spectral types based on near-IR spectra, or adopt optically assigned spectral types (always assumed to be reliable).
Further difficulty is encountered when trying to determine the binary status of each WR star, particularly late-WC stars, as IR line dilution could be a result of thermal emission from circumstellar dustorthe continuum of a bright companion. For WR stars of types other than WC7–9 showing evidence of binarity, if a flux ratio of the WR component to its companion is determinable in eitherJ, HorKS, it is straightforward to adjust the corresponding 2MASS photometry to that of the WR component alone. We follow one of two procedures to obtain near-IR flux ratios for suspected binary systems, depending on whether or not the companion responsible for line dilution has been classified.
In the case of SB2 systems where both stars have been explicitly classified, we determine flux ratios in the JHKS bands using the absolute magnitudes of Martins & Plez (2006) (O stars) or Wegner (2006) (B stars) along with our calibrated WR star absolute magni-tudes. The advantage of this method is that it enables us to correct photometry over all bands, allowing an extinction calculation by our favoured colour excess method. This method is also applicable to dusty WC stars, provided photometry is available from a quiescent period.
Table 9. Calculated spatial locations of 18 binary ‘field’ WR stars to which our calibrated absolute magnitudes have been assigned. Shown for each object are the adopted spectral type(s), systemic 2MASS photometry (unless stated), calculatedKS-band (unless stated otherwise in parentheses)
WR/system flux ratio, derivedKS-band extinction, heliocentric distance (d), Galactocentric radius (RG) and vertical distance from the Galactic
mid-plane (z).
WR# Spectral type Ref. Jsys Hsys Ksys
S FWR/Fsys A¯KS d(kpc) RG(kpc) z(pc)
29 WN7h+O5I 1 9.91 9.46 9.12 0.49±0.16 0.51±0.19 9.48±2.56 10.27±2.57 −148±45 30 WC6+O6–8 2 10.06 9.76 9.21 0.75+−00..2566 0.25+−00..3725 6.11±3.44 8.29±3.45 −258±157 30a WO4+O5–5.5 3 10.25 9.83 9.56 0.13±0.04 0.40±0.04 5.67±1.18 8.17±1.21 −117±28 31 WN4+O8V 2 9.17 8.96 8.69 0.46±0.23 0.30±0.22 3.34±1.12 7.63±1.15 21±1 35a WN6h+O8.5V 4 10.47 9.98 9.65 0.80−+00..2033 0.37±0.14 7.81±1.99 9.13±2.00 12±2 41 WC5+OB 2 11.53 10.98 10.12 0.93−+00..0753 0.47±0.27 6.69±2.06 8.40±2.07 −101±37 42 WC7+O7V 5 7.59 7.52 7.08 0.53±0.10(J) 0.14±0.03 2.96±0.53 7.47±0.58 −6±5 47 WN6+O5.5 6 8.32 7.92 7.55 0.93−+00..0712(J) 0.37±0.03 2.12±0.44 7.10±0.50 11±2 50 WC7+OB 2 9.75 9.38 8.81 0.86+−00..1459 0.21+−00..2137 5.23±2.18 6.49±2.19 45±11 51 WN4+OB? 2 10.90 10.33 9.89 0.77+−00..2330 0.72+−00..7286 3.70±1.80 6.55±1.82 35±7 63 WN7+OB 2 8.60 8.07 7.64 0.89−+00..1144 0.43±0.27 3.68±1.23 5.85±1.26 −6±8 86 WC7+B0III 7 7.44 7.14 6.67 0.77±0.26 0.31±0.02 1.97±0.47 6.05±0.53 83±15 125 WC7ed+O9III 2 9.268 8.748 8.258 0.46±0.07 0.25±0.12 5.45±1.05 6.56±1.08 120±19 138 WN5+OB 2 6.97 6.80 6.58 0.61±0.11 0.27±0.10 1.38±0.26 7.76±0.36 46±5 143 WC4+Be 9 8.58 8.10 7.46 0.53±0.17 0.60±0.06 1.33±0.30 7.82±0.39 18±1 151 WN4+O5V 2 9.76 9.36 9.01 0.73±0.10 0.40±0.11 2.93±0.65 9.10±0.70 91±16 155 WN6+O9II–Ib 2 7.48 7.34 7.16 0.70±0.07 0.14±0.08 2.56±0.56 9.02±0.61 −38±13 158 WN+OB? 2 8.64 8.20 7.81 0.84−+00..1628 0.40±0.03 6.46±1.38 12.23±1.40 31±3 (1) Gamen et al. (2009), (2) van der Hucht (2001), (3) Gosset et al. (2001), (4) Gamen et al. (2014), (5) Davis, Moffat & Niemela (1981), (6) Fahed & Moffat (2012), (7) L´epine et al. (2001), (8) Williams et al. (1992): average of quiescent photometry in 1989, and (9) Varricatt & Ashok (2006).
to the near-IR. However, the paucity of published line strengths typ-ically results in a flux ratio only being determinable in one near-IR band. When this is the case, we either adopt Av from the liter-ature (indicated in Tables8and 9) or exclude the star from our analysis.
To determine the nature of late-WC stars displaying diluted emis-sion lines, we incorporate photometry from theWISEall-sky survey (Wright et al.2010) allowing us to construct a simplistic 1-22μm SED. We interpret a peak energy output at5μm as evidence for circumstellar dust emission, and stars displaying this are excluded from our analysis as we cannot determine their distances accurately. We identify only one line-diluted late WC, WR 42 (WC7+O7V), to be conclusively dust-free, and include this star in the binary field sample (Table 9) withJ-band photometry corrected for the companion.
Our field WR star sample consists of 246 objects; 18 of these are corrected for a companion by the line-dilution technique, and 3 are corrected for a spectrally classified companion. We note that with the currently known population standing at∼635, approximately 260 WR stars are unaccounted for in our calibration and field sam-ples. Of these, the majority have uncertain spectral types, and lack spectra of sufficient quality (or spectral range) to obtain the required precision. Also excluded are stars with inconclusive evidence for a companion, and subtypes for which we cannot assign reliable near-IR absolute magnitudes (dusty WC stars, WN/C stars, WN10–11 stars).
A complete list of WR stars discovered between the Annex to the VIIth WR catalogue (van der Hucht2001,2006) and 2014 March is provided in Appendix A, which also highlights those for which distances have been obtained from the present study, together with an explanation of the revised nomenclature.
3.2 Spatial properties
The Galactic locations of 354 WN and non-dusty WC stars com-prising our calibration and field samples are shown in Fig.3. Uncer-tainties on distance moduli of field WR stars are displayed in Fig.4, where it can be seen thatDM ∼ 0.4 mag typically applies, and minimum distance uncertainties are approximately±14 per cent.
3.2.1 Radial distribution
Fig. 5 shows the radial distribution of 354 WR stars in the Milky Way. As expected, the majority of WR stars are located at Galactocentric distances of 3.5–10 kpc, with an additional peak atRG < 500 pc owing to significant star formation within the
cen-tral molecular zone (CMZ), reminiscent of OB star-forming regions (Bronfman et al.2000).
Two conspicuous subpeaks, consisting mostly of WN stars, occur atRG ∼ 4.5 and∼7.5 kpc. Both may be viewed as superpositions
on the underlying WR population, the innermost and outermost are largely attributable to the WR content of Westerlund 1 (∼20 WR) and the nearby Cygnus star-forming region (∼15 WR,l ∼ 75◦,
d= 1.3–1.9 kpc), respectively.
3.2.2 z-distribution
Figure 3. Positions of 354 WR stars projected on the Galactic plane (top) and viewed edge-on (bottom) in Cartesian coordinates, with the GC at (0, 0, 0). Galactic longitude increases anticlockwise about the Sun, which is represented by the standard symbol. Stars with known distances (calibration sample) are represented by larger symbols, whereas those with photometric distances (field sample) are represented by smaller symbols. Stars located at|z|>300 kpc are marked with black crosses. The dotted lines atRG=6 and 9 kpc delineate the three chosen metallicity zones. From left to right, the displayed clusters from which>1 WR stars are taken are: NGC 3603 [–7.07, 5.20], Danks 1 and 2 [–3.39, 5.59], Westerlund 1 [–1.40, 4.25], Halven–Moffat 1 and 2 [–0.65, 4.76], NGC 6231 [–0.47, 6.43], GC [0.0, 0.0], Arches and Quintuplet [0.02, 0.0], Cl 1813−178 [0.79, 4.49] and Quartet [2.65, 2.29].
(equation 8) matches well the distribution of vertical heights (z) of WR stars from the Galactic plane,
N(z)=A
γ2
(z−zo)2+γ2
, (8)
whereγ is the half-width at half-maximum (HWHM),zo is the location of the peak andAis an intensity. Assuming the Sun lies 20 pc above the Galactic plane (Humphreys & Larsen1995), our fit yieldsγ = 39.2 pc andzo = 1.9 pc (Fig.6).
Unlike other young stellar population tracers, we find no evi-dence for flaring of the WR star disc with increasingRG, although
this is likely due to the small number of WR stars identified be-yond the solar circle. Paladini, Davies & De Zotti (2004) perform a Gaussian fit to thez-distribution of 456 Galactic HIIregions interior
Figure 4. Distance modulus uncertainty for field WR stars, with equivalent distances indicated by vertical arrows and percentage errors by horizontal arrows.
Figure 5. The distribution of Galactocentric radii for 354 WR stars, in 0.5 kpc bins.
Figure 6. z-distribution of 354 Galactic WR stars shown in 20 pc bins (thick black line) with a fitted three-parameter Lorentzian function (thin red line, equation 8). Stars at|z|>300pc (outside dotted lines) are listed in Table10. 30–50 pc – slightly narrower than the WR star disc – flaring to>200 pc beyondRG=12 kpc.
3.2.3 WR stars at large distances from the Galactic disc
A small fraction of WR stars are found at high vertical distances from the Galactic disc. Additional details of the 12 WR stars at |z|> 300 pc (7γ) are shown in Table10, all of which are presumably runaways from star formation sites in the thin disc. We include WR 124 in Table 10 since it has previously been
identified as an extreme runaway by its high peculiar radial velocity (156 km s−1; Moffat, Lamontagne & Seggewiss1982). Here, we
briefly discuss the possible events leading to their runaway status, and summarize the evidence for each.
First, we address the possibility that some of these objects are much fainter (thus less distant) WR-like central stars of planetary nebulae (CSPN). Both WC-like ([WC], e.g. Depew et al.2011) and WN-like ([WN], e.g. Miszalski et al.2012; Todt et al.2013) CSPN have been observed in the field, although [WC]-type are far more common. These objects are almost identical in spectral appearance to their high-mass analogues (Crowther, Morris & Smith2006b), yet are intrinsically fainter by several magnitudes.
We conduct a search for nebulosity around each|z|>300 pc WR star by inspection of SuperCOSMOS Hαimages (Parker et al.2005) and any other published Hαimaging. Identification of a surrounding nebula cannot alone prove any of these objects to be CSPN, as some WR stars are seen to possess ejecta nebulae (Stock & Barlow2010), yet it would provide a strong indication. Nebulosity is only observed around WR 71, which is known to be a genuinely massive, potential WR+compact object binary system (Isserstedt, Moffat & Niemela 1983). We therefore conclude that none of these 12 high-zWR stars are misclassified CSPN.
There are two leading mechanisms by which massive stars can be ejected from their birthplaces; the binary SN scenario where a massive binary system becomes unbound after an SN explosion (Blaauw1961), and the dynamical ejection scenario where close encounters in a dense cluster can eject massive single or binary stars (Poveda, Ruiz & Allen1967).
A WR star at|z| =700 pc (similar to the highest observed), as-sumingz=0 at birth and a time since ejection of 5 Myr (typical WR star age), would require an average velocity in thez-direction of 140 km s−1. In the case of dynamical interaction between
mas-sive single and binary stars, a typical ejection velocity is given by v2
ej=GMb/a(Mb =total mass of binary with semimajor axisa)
according to Fujii & Portegies Zwart (2011), and the ejected star usually has the lowest mass of 3. By this reasoning, assuming a
M 25 MWR progenitor limit, aMb=50 M(160 M)
bi-nary with a period up to 170 d (550 d) would be capable of ejecting a WR progenitor star with at leastvej=140 km s−1. Ejection of
the binary system is also possible in such an interaction, which one might expect thereafter to be associated with considerable hard X-ray flux from the collision of stellar winds. In Table10, we include available X-ray observations for these 12 stars, showing that only WR 3 is conspicuous, lying on theLX/Lbolrelation for spectroscopic
O-star binaries (Oskinova2005). However, Marchenko et al. (2004) find no evidence for short period (<2 yr) radial velocity changes, concluding that WR 3 is likely a single star.
Alternatively, the locations of these stars may be explained by mo-mentum gained from the SN explosion of a companion. Dray et al. (2005) estimate that 2/3 of massive runaways are produced this way. Isserstedt et al. (1983) show that kick velocities of∼150 km s−1
[image:13.595.55.273.430.573.2]