A New Detached M Dwarf Eclipsing Binary
The Harvard community has made this
article openly available.
Please share
how
this access benefits you. Your story matters
Citation
Creevey, O. L., G. F. Benedict, T. M. Brown, R. Alonso, P. Cargile,
G. Mandushev, D. Charbonneau, et al. 2005. “A New Detached M
Dwarf Eclipsing Binary.” The Astrophysical Journal 625 (2): L127–30.
https://doi.org/10.1086/431278.
Citable link
http://nrs.harvard.edu/urn-3:HUL.InstRepos:41417372
Terms of Use
This article was downloaded from Harvard University’s DASH
repository, and is made available under the terms and conditions
applicable to Other Posted Material, as set forth at
http://
L127
䉷2005. The American Astronomical Society. All rights reserved. Printed in U.S.A.
A NEW DETACHED M DWARF ECLIPSING BINARY
O. L. Creevey,1,2,3
G. F. Benedict,4
T. M. Brown,1
R. Alonso,3
P. Cargile,4
G. Mandushev,5
D. Charbonneau,6
B. E. McArthur,4
W. Cochran,4
F. T. O’Donovan,7
S. J. Jime´nez-Reyes,3
J. A. Belmonte,3
and D. Kolinski1
Received 2005 January 25; accepted 2005 April 21; published 2005 May 11
ABSTRACT
We describe a newly discovered detached M dwarf eclipsing binary system. This system was first observed by the TrES network during a long-term photometry campaign of 54 nights. Analysis of the folded light curve indicates two very similar components orbiting each other with a period of 1.12079Ⳳ0.00001 days. Spectroscopic observations with the Hobby-Eberly Telescope show the system to consist of two M3e dwarfs in a near-circular orbit. Double-line radial velocity amplitudes, combined with the orbital inclination derived from light-curve fitting, yield Mtotal p 0.983 Ⳳ 0.007 M,, with component masses of M1p0.493Ⳳ0.003 M, and M2p
M,. The light-curve fit yields component radii of R, and
0.489Ⳳ0.003 R p0.453Ⳳ0.060 R p0.452Ⳳ
1 2
R,. Although a precise parallax is lacking, broadband VJHK colors and spectral typing suggest component 0.050
absolute magnitudes ofM (1)V p11.18Ⳳ0.30andM (2)V p11.28Ⳳ0.30.
Subject headings: binaries: close — binaries: eclipsing — stars: individual (TrES-Her0-07621) — stars: late-type
1.INTRODUCTION
Although low-mass binary stars are the most abundant stars in the Galaxy (Henry & McCarthy 1993), their intrinsic faint-ness inhibits their detection and study. Noncontact eclipsing binary M dwarf systems have great value, as these systems allow us to accurately estimate the most basic stellar param-eters: mass and radius. Only four8such systems are known and
have been studied in detail: YY Gem (Bopp 1974; Leung & Schneider 1978), CM Dra (Lacy 1977; Metcalfe et al. 1996; Kozhevnikova et al. 2004), GJ 2069A (Delfosse et al. 1999; Ribas 2003), and OGLE BW03 V0389
(Maceroni & Montalba´n 2004). The observed properties of each of these systems present discrepancies with the theory of low-mass stellar objects; nei-ther the observed radius relation nor the observed mass-luminosity relation is well represented by existing models (Ben-edict et al. 2000); see Figure 1. The problem most likely lies in the shortcomings of the physical models, owing to our lack of understanding of the complex atmospheres of such low-mass objects (Baraffe et al. 1998). Enlarging the small existing sample of such systems is therefore desirable, to allow more detailed comparisons between observations and the theory of these ubiq-uitous, interesting, and complex objects. Here we report a pre-liminary analysis of a fifth such low-mass eclipsing binary.
1High Altitude Observatory, National Center for Atmospheric Research,
3450 Mitchell Lane, Boulder 80307, CO; [email protected], timbrown@ hao.ucar.edu, [email protected].
2Universidad de La Laguna, E-38206 La Laguna, Tenerife, Spain. 3Instituto de Astrofı´sica de Canarias, E-38200 La Laguna, Tenerife, Spain;
[email protected], [email protected], [email protected].
4McDonald Observatory, University of Texas, 1 University Station, C1402,
Austin, TX 78712; [email protected], [email protected], mca@ barney.as.utexas.edu, [email protected].
5Lowell Observatory, 1400 West Mars Hill Road, Flagstaff, AZ 86001;
6Harvard-Smithsonian Center for Astrophysics, 60 Garden Street,
Cam-bridge, MA 02138; [email protected].
7California Institute of Technology, 1200 East California Boulevard,
Pas-adena, CA 91125; [email protected].
8We refer specifically to binaries for which both components are M dwarfs.
However, a number of M dwarf stars whose companion is an F or G MS star have also been detected and studied (e.g., Pont et al. 2005); see Fig. 1.
9This is a very close although still detached system.
2.OBSERVATIONS
2.1. Photometric Observations
The recently discovered spectroscopic binary, TrES-Her0-07621 (ap16h50m20s.7,dp⫹46⬚39⬘01⬙[J2000], Vp15.51Ⳳ0.08)
was first identified through an analysis of photometric time series from the TrES (Trans-Atlantic Exoplanet Survey) network. This network consists of three telescopes: STellar Astrophysics and Re-search on Exoplanets10
(STARE; Brown & Charbonneau 1999), Planet Search Survey Telescope11
(PSST; Dunham et al. 2004), and Sleuth.12
The telescopes are similar in their characteristics, with apertures of 10 cm,2048#2048pixel CCD detectors, and fields of view of6⬚#6⬚.
TrES collects long-term time-series photometry in one filter. The photometry run in question spanned 54 days, beginning in 2003 May 6, and was observed in a band roughly equivalent to Harris R at a cadence of one image every 2 minutes. The images were reduced and calibrated by an automatic package developed specifically for these data. TrES-Her0-07621 was observed by both STARE and PSST, but the latter time series proved significantly noisier. We therefore analyzed only the STARE light curve. The R magnitude is 14.42, with each point having a formal accuracy of 0.04 mag rms. This light curve contains 8781 data points, obtained in 309.5 hr over 54 days, giving a duty cycle of 23.8%.13
A high signal-to-noise ratio peak in the time series’ frequency spectrum at 1.79 cycles per day initiated the study of TrES-Her0-07621. Folding the star’s light curve with a period of 1.1208 days showed it to be an eclipsing binary. The light curve also displays sinusoidal out-of-eclipse variations near the photometric period. The star’s infrared colors from the 2MASS14
catalog are quite red
10Observatorio del Teide, Tenerife, Spain. 11Lowell Observatory, Arizona.
12Palomar Observatory, California, at http://www.astro.caltech.edu/∼ftod/
tres/sleuth.html.
13The data are available via the STARE Web site, http://www.hao.ucar.edu/
public/research/stare/stare.html.
14Two Micron All Sky Survey: University of Massachusetts and the Infrared
L128 CREEVEY ET AL. Vol. 625
[image:3.612.47.282.63.230.2]Fig.1.—Mass-radius relation showing the four other known M dwarf bi-naries (triangles). Our binary system is represented by squares. We also rep-resent some other M dwarf stars whose companions are F or G MS stars (e.g., Bouchy et al. 2005; Pont et al. 2005). We show theoretical models from Baraffe et al. (1998), indicating an age of 10 (solid line), 5 (dash-dotted line), and 1 Gyr (dashed line), corresponding to[Z]p0 Y, p0.275.
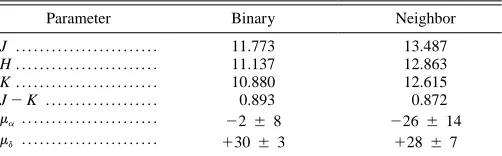
TABLE 1
Catalog Information
Parameter Binary Neighbor
J . . . . 11.773 13.487
H . . . . 11.137 12.863
K . . . . 10.880 12.615 . . . .
J⫺K 0.893 0.872
. . . .
ma ⫺2Ⳳ8 ⫺26Ⳳ14
. . . .
md ⫹30Ⳳ3 ⫹28Ⳳ7
Note.—Color information from 2MASS, significant proper motion data from USNO-B (units of mas yr⫺1).
Fig.2.—Phased radial velocity curve of TrES-Her0-07621 with residuals; data observed by the HET. A total of four nights were obtained; the system was observed for 1 hr every night at 20 minutes per exposure. The Doppler displacement was measured in two different wavelengths regions and at Ha.
(Table 1), and the USNO-B15catalog shows a significant proper
motion. Taken together, these facts suggested that the object is a binary M dwarf, with substantial levels of magnetic activity driven by the rapid, tidally locked rotation of the component stars; this motivated further study.
2.2. Spectroscopic Observations
In 2004 September we obtained spectroscopic observations of TrES-Her0-07621 using the High Resolution Spectrograph (HRS; Tull 1998) on the Hobby-Eberly Telescope (HET). We secured measurements at 4 epochs; each epoch contained three separate exposures taken over approximately 1 hr—giving a total of 12 spectra. The analysis was carried out with standard IRAF (Tody 1993) echelle and rv package tools, including fxcorr. We cross-correlate TrES-Her0-07621 with an M2 dwarf (Gl 623) template and extract velocities for both components at four dis-tinct phases. We adopted a radial velocity for the Gl 623 primary of⫺29.2 km s⫺1
, given the orbital phase at which the template was secured and a systematic velocity, Vsys p⫺27.5 km s
⫺1,
from Marcy & Moore (1989). The HRS utilizes two CCDs cov-ering the blue and red spectral regions. The data from each chip were analyzed independently, resulting in two velocity estimates. A third velocity estimate was obtained by cross-correlating an artificial Haemission template with the Haemission line found in each exposure. Given the large orbital velocities, there was no blending of correlation peaks at any phase. The three veloc-ities (blue, red, Ha) are obviously not independent determina-tions but do provide an estimate of our internal error.
3.ANALYSIS
Figure 2 shows the component velocities plotted against pho-tometric phase, while Figure 3 (top panel) shows the folded photometric light curve. It is evident from the nearly symmetrical and sinusoidal radial velocity variation and from the highly sym-metrical light curve that the orbit is nearly circular and that the component masses and surface brightnesses are similar.
An initial period analysis of the entire STARE light curve using the technique of phase dispersion minimization refined the
pho-15
SIMBAD, operated at CDS, Strasbourg, France, and the NASA/IPAC Extragalactic Database (NED), supported by JPL, California Institute of Tech-nology, http://www.nofs.navy.mil/data/fchpix.
tometric period to 1.1209Ⳳ0.0006 days. We predicted and then observed an eclipse on 2004 May 14 using the 1.2 m telescope at the Fred L. Whipple Observatory, Arizona, using Sloan filters r, i, and z. The long time base provided by this observation allowed us to refine the photometric period. By fitting the light curves during (21) eclipse times (we included only totally observed eclipses) to parabolas, we determined all the times of minimum light (center of eclipse) with corresponding error. For the eclipse observed on 2004 May 14, we only used the time of minimum light from the r filter. We also used observations from IAC80 (see below). Using the bootstrap method, we refined the period to 1.12079 Ⳳ 0.00001, corresponding to a precision of 1 s. The epoch of secondary minimum, T0, was meanwhile determined to
be 2,453,139.749509 (HJD)Ⳳ0.000075.
[image:3.612.315.566.81.159.2] [image:3.612.319.564.528.726.2]TrES-Fig.3.—Observed light-curve and fitting results. The top panel shows the reconstructed light curve (solid line) using the parameters obtained by fitting the observed light curve without the out-of-eclipse variations (small crosses; see § 4). We have indicated phasep0 and 1 (center of secondary eclipse) by dashed
lines. The bottom panel shows the residuals (dots), with the solid line representing the rms of residuals.
TABLE 2
System Parameters
Parameter Value
P (days) . . . . 1.12079Ⳳ0.00001
P (yr) . . . . 0.00306861Ⳳ0.00000036
T0(HJD) . . . 2,453,139.749509Ⳳ0.00075
(M,) . . . .
MT 0.983Ⳳ0.007
a (AU) . . . . 0.01047Ⳳ0.00002
a (R,) . . . 2.251Ⳳ0.005
i (deg) . . . . 83.12Ⳳ0.30
g(km s⫺1
) . . . ⫺26.5Ⳳ0.3 . . . .
[image:4.612.97.510.67.207.2]T /TB A 0.97Ⳳ0.02
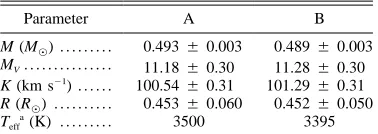
TABLE 3
Component Parameters
Parameter A B
M (M,) . . . 0.493Ⳳ0.003 0.489Ⳳ0.003 . . . .
MV 11.18Ⳳ0.30 11.28Ⳳ0.30
K (km s⫺1) . . . 100.54Ⳳ0.31 101.29Ⳳ0.31
R (R,) . . . 0.453Ⳳ0.060 0.452Ⳳ0.050
Teff
a(K) . . . . 3500 3395 aThe component A temperature is based on that
ex-pected of an M3 V star (Cox 2000).
Her0-07621 by the companion star is important, because it must be accounted for when fitting the time-series data to estimate the stellar radii. This neighbor also has a proper motion that is similar in magnitude and direction to that of TrES-Her0-07621, indicating the possibility that TrES-Her0-07621 is at least a triple system, with the eclipsing pair of stars accompanied by a third M dwarf at a distance of hundreds of AU.
Adopting the photometric period as the orbital period and intro-ducing its associated error, we fit all 36 radial velocities (blue, red, Ha) with a Keplerian model using GaussFit (Jefferys et al. 1988). The model is similar to that used in McArthur et al. (2004). We assume an eccentricity e of 0. The resulting radial velocity semiam-plitudes are K1 p100.54Ⳳ 0.31 km s⫺
1 and K
2 p101.29Ⳳ
0.31 km s⫺1
, giving 3 M,
(M1⫹M ) sin i2 p0.9547Ⳳ0.0062
andM /M p1.0075Ⳳ0.0044. A formal solution including
ec-1 2
centricity (ep0.006Ⳳ0.002) provided a better solution, reducing by 8%, while reducing the number of degrees of freedom by
2
x
3%. However, we constrainep0for this analysis.
We developed ax2minimization algorithm to estimate orbital
parameters from the light curve, ignoring any variations be-tween eclipses (Fig. 3). The input parameters are period P, component masses M1and M2, limb-darkening coefficients (0.7;
Claret 1998, Table 7), and the light from a third nearby star as a fraction of the total light of the system (0.19Ⳳ 0.04). The code solves for both radii R1 and R2, the effective
tem-perature ratio T /T2 1, the center of minimum eclipse T0, and
inclination i. Figure 3 shows the resulting fit to the data. The initial estimates for R1, R2,T /T2 1, and i were derived from
two-dimensional 2 contour plots (while keeping the other two
x
parameters fixed). These contour plots presented high correla-tions between the two radii, constraining their sum while insen-sitive to their difference, and between radius (R1 or R2) and
inclination; larger radius implies smaller inclination.T /T2 1 was uncorrelated to both radii and inclination, so its error is given
by the corresponding value of this parameter at 2 (Press
x ⫹j
et al. 1986, § 14.5) in the direction of its axis. However, because the other parameters are obviously not independent, R1 and R2
for example, the error spanned the range of radii where the contour value is 2 (the full range error ellipsoid).
x ⫹j
Even with the component masses determined, in the absence of a Teffmeasurement we require the component absolute
mag-nitudes to place these stars on the mass-luminosity relation. From the TrES data, calibrated using stars within 1⬚that have measured V magnitudes from SIMBAD, we obtain a V-band apparent mag-nitude of 15.51Ⳳ0.08 for the combined three-star system, giving (Table 1). Assuming a wavelength-inde-V⫺Kp4.63Ⳳ0.10
pendent relative flux, we estimateDVAB⫺Cp1.72from difference J, H, and K magnitudes (between the neighbor and the binary). We can also estimateDV (between the binary components)p
A⫺B
0.1Ⳳ0.05, based on the derived temperature and radii differences. Taking all of the above into account, we estimate the component magnitudes of VAp16.37Ⳳ0.1, VBp16.56Ⳳ0.1, and VCp
17.43Ⳳ0.1, where C is the stellar neighbor.
From the Hawley et al. (2002) color–spectral type relations, we estimate an M3 spectral type for each component. From the Hawley et al. MJ–spectral type relationships, we obtain component absolute magnitudes ofMVp11.18, 11.28Ⳳ0.3. Accepting this estimate of the luminosities, the distance mod-ulus ism(∼16.4–11.2)∼5.2, corresponding tod∼110pc. For this nearby system, we have assumed no absorption (A p0).
V
We also use the radii and effective temperature (Table 3) to determine luminosities, differentially with respect to the Sun (e.g., Benedict et al. 2003). With bolometric corrections as a function of temperature, from Flower (1996) we obtain an av-erage dp118Ⳳ13pc for the two components.
4.RESULTS AND COMMENTS
[image:4.612.349.538.683.750.2]L130 CREEVEY ET AL. Vol. 625
Nightfall16(see below). Both codes give similar results, their
difference being within the error bars. Tables 2 and 3 summarize the results.
Our code does not allow for stellar spots, so we subtracted a smooth function (by a Fourier technique) in order to remove the out-of-eclipse variations, making a rectified light curve. We also constrainep0. The top panel of Figure 3 shows the synthetic light curve (solid line) corresponding to the model fit (our code) of the folded light curve (small crosses). Phasep0 corresponds
to the secondary eclipse. The bottom panel shows the residuals of the fit. The residuals show no variation as a function of phase, indicating an adequate model fit.
Because our code is unable to account for spot variability, we inspected the residuals after subtracting the model fit from the unrectified light curve. These residuals also showed no evidence of eclipses. We also fit this unrectified light curve in order to find R1, R2, i, T0, andT /T2 1. The results varied slightly
from those for the rectified light curve but stayed within the error bars (Table 3).
Our original (unrectified) photometric light curve contains nonuniform out-of-eclipse variations. Binary systems such as TrES-Her0-07621 are often magnetically active (e.g., Strassmeier et al. 1993). While tidal effects may be important, these non-uniform variations are most likely explained by star spots. We used Nightfall to model our unrectified light curve, because this code allows for the presence of spots on each of the components. Our derived parameters were used as inputs, and we attempted to solve for the longitude, latitude, and radii of the spot(s). There was no unique solution; many combinations of these spot
pa-16
See http://www.lsw.uni-heidelberg.de/users/rwichman/Nightfall.html.
rameters could compensate for the out-of-eclipse variations, al-though they always presented a 180⬚longitude difference. This preferred longitude difference has also been observed in other active binary systems (see, e.g., Henry et al. 1995). The presence of spots can have a significant effect on the accuracy of the derived parameters, such as inclination, temperature, and radii (Torres & Ribas 2002 discuss this for the case of YY Gem). Additional observations, photometry in particular, will be nec-essary to increase the precision of the radius estimates as well as to learn more about the magnetic behavior of the stars. This could then provide a link toward a better understanding of the physical processes of these low-mass objects.
We thank Hecto´r Vazquez Ramio (observations on IAC80) and the operating staff for STARE. The IAC80 and STARE are operated by the Instituto de Astrofı´sica de Canarias in the Spanish Observatorio del Teide. We thank Mark Everett for observations on the 48 inch (1.2 m) telescope at Fred L. Whipple Observatory on Mount Hopkins, Arizona, operated by the Harvard-Smith-sonian Center for Astrophysics. We also thank Rainer Wichmann for the use of the program for the light-curve synthesis, Nightfall. Support for this work was provided by NASA through grants GO-09408 and GO-09407 and the Space Telescope Science In-stitute, which is operated by the Association of Universities of Research in Astronomy, Inc., under NASA contract NAS5-26555. The Hobby-Eberly Telescope (HET) is a joint project of the University of Texas at Austin, Pennsylvania State University, Stanford University, Ludwig-Maximilians-Universita¨t Mu¨nchen, and Georg-August-Universita¨t, Go¨ttingen. We thank the HET resident astronomers and telescope operators. We thank the ref-erees for their constructive comments.
REFERENCES
Baraffe, I., Chabrier, G., Allard, F., & Hauschildt, P. H. 1998, A&A, 337, 403 Benedict, G. F., McArthur, B. E., Franz, O. G., Wasserman, L. H., & Henry,
T. J. 2000, AJ, 120, 1106
Benedict, G. F., et al. 2003, AJ, 126, 2549 Bopp, B.W. 1974, ApJ, 193, 389
Bouchy, F., Pont, F., Melo, C., Santos, N. C., Mayor, M., Queloz, D., & Udry, S. 2005, A&A, 431, 1105
Brown, T. M., & Charbonneau, D. 1999, BAAS, 31, 1534 Claret, A. 1998, A&A, 335, 647
Cox, A. N. 2000, Allen’s Astrophysical Quantities (4th ed.; New York: AIP) Delfosse, X., Forveille, T., Mayor, M., Burnet, M., & Perrier, C. 1999, A&A,
341, L63
Dunham, E. W., Mandushev, G. I., Taylor, B. W., & Oetiker, B. 2004, PASP, 116, 1072
Flower, P. J. 1996, ApJ, 469, 355 Hawley, S. L., et al. 2002, AJ, 123, 3409
Henry, G. W., Eaton, J. A., Hamer, J., & Hall, D. S. 1995, ApJS, 97, 513 Henry, T. J., & McCarthy, D. W. 1993, AJ, 106, 773
Jefferys, W. H., Fitzpatrick, M. J., & McArthur, B. E. 1988, Celest. Mech., 41, 39
Kozhevnikova, A. V., Kozhevnikov, V. P., Zakharova, P. S., Polushina, T. S., & Svechnikov, M. A. 2004, Astron. Rep., 48, 826
Lacy, C. 1977, ApJ, 218, 444
Leung, K., & Schneider, D. 1978, AJ, 83, 618 Maceroni, C., & Montalba´n, J. 2004, A&A, 426, 577 Marcy, G. W., & Moore, D. 1989, ApJ, 341, 961 McArthur, B. E., et al. 2004, ApJ, 614, L81
Metcalfe, T. S., Mathieu, R. D., Latham, D. W., & Torres, G. 1996, ApJ, 456, 356
Pont, F., Bouchy, F., Melo, C., Santos, N. C., Mayor, M., Queloz, D., & Udry, S. 2005, A&A, submitted (astro-ph/0501615)
Press, W. H., Flannery, B. P., Teukolsky, S. A., & Vetterling, W. T. 1986, Numerical Recipes (Cambridge: Cambridge Univ. Press)
Ribas, I. 2003, A&A, 398, 239
Strassmeier, K. G., Hall, D. S., Fekel, F. C., & Scheck, M. 1993, A&AS, 100, 173
Torres, G., & Ribas, I. 2002, ApJ, 567, 1140
Tody, D. 1993, in ASP Conf. Ser. 52, Astronomical Data Analysis Software and Systems II, ed. R. J. Hanisch, R. J. V. Brissenden, & J. Barnes (San Francisco: ASP), 173