0004-637X
https://doi.org/10.1088/0004-637X/798/1/19
[email protected] https://eprints.whiterose.ac.uk/
Reuse
Unless indicated otherwise, fulltext items are protected by copyright with all rights reserved. The copyright exception in section 29 of the Copyright, Designs and Patents Act 1988 allows the making of a single copy solely for the purpose of non-commercial research or private study within the limits of fair dealing. The publisher or other rights-holder may allow further reproduction and re-use of this version - refer to the White Rose Research Online record for this item. Where records identify the publisher as the copyright holder, users can verify any specific terms of use on the publisher’s website.
Takedown
If you consider content in White Rose Research Online to be in breach of UK law, please notify us by
arXiv:1410.5715v1 [astro-ph.SR] 21 Oct 2014
Draft version October 22, 2014
Preprint typeset using LATEX style emulateapj v. 04/20/08
SMALL-SCALE STRUCTURING OF ELLERMAN BOMBS AT SOLAR LIMB
C. J. Nelson1,2, E. M. Scullion3,4, J. G. Doyle1, N. Freij2, R. Erd´elyi2.
Draft version October 22, 2014
ABSTRACT
Ellerman bombs (EBs) have been widely studied in recent years due to their dynamic, explosive nature and apparent links to the underlying photospheric magnetic field implying that they may be formed by magnetic reconnection in the photosphere. Despite a plethora of researches discussing the morphologies of EBs, there has been a limited investigation of how these events appear at the limb, specifically, whether they manifest as vertical extensions away from the disc. In this article, we make use of high-resolution, high-cadence observations of an Active Region (AR) at the solar limb, collected by the CRisp Imaging SpectroPolarimeter (CRISP) instrument, to identify EBs and infer their physical properties. The upper atmosphere is also probed using the Solar Dynamic Observatory’s
Atmospheric Imaging Assembly (SDO/AIA). We analyse 22 EB events evident within these data, finding that 20 appear to follow a parabolic path away from the solar surface at an average speed of 9 km s−1, extending away from their source by 580 km, before retreating back at a similar speed. These results show strong evidence of vertical motions associated with EBs, possibly explaining the dynamical ‘flaring’ (changing in area and intensity) observed in on-disc events. Two in-depth case studies are also presented which highlight the unique dynamical nature of EBs within the lower solar atmosphere. The viewing angle of these observations allows for a direct linkage between these EBs and other small-scale events in the Hαline wings, including a potential flux emergence scenario. The findings presented here suggest that EBs could have a wider-reaching influence on the solar atmosphere than previously thought, as we reveal a direct linkage between EBs and an emerging small-scale loop, and other near-by small-scale explosive events. However, as previous research found, these extensions do not appear to impact upon the Hαline core, and are not observed by the SDO/AIA EUV filters.
Subject headings: Ellerman Bombs - Magnetic Reconnection
1. INTRODUCTION
The solar atmosphere is a complex and dynamic en-vironment, filled with a myriad of structures, ranging from large-scale coronal loops and prominences to small-scale granules and photospheric magnetic bright points (MBPs). With the increased resolution and coverage of both ground-based and space-borne instrumentation in recent years, it has become possible to observe and anal-yse a wider range of solar phenomena in greater detail. As certain ground-based instruments, such as theCRisp Imaging SpectroPolarimeter(CRISP; see Scharmer 2006, Scharmeret al.2008), are capable of resolving the lower solar atmosphere on spatial scales close to 90 km, a wide variety of small-scale events have been discussed, specif-ically in terms of how they interact with the wider envi-ronment.
Ellerman bombs (often shortened to EBs within the lit-erature) are one example of small-scale events observed in the lower solar atmosphere. Widely identified as bright-enings inferred from 0.5 - 5 ˚A into the wings of the Hα line profile, EBs often form co-spatially with regions of strong magnetic field, specifically in mixed polarity re-gions (see, for example, Pariatet al. 2004, Visserset al.
2013). First observed by Ellerman (1917), these
small-1
Armagh Observatory, College Hill, Armagh, N. Ireland, UK, BT61 9DG.
2
Solar Physics and Space Plasma Research Centre, University of Sheffield, Hicks Building, Hounsfield Road, Sheffield, UK, S3 7RH.
3
Institute of Theoretical Astrophysics, University of Oslo, 0371 Oslo, Norway
4
Astrophysics Research Group, School of Physics, SNIAM, Trin-ity College Dublin, Dublin 2, Ireland
scale events are reported to have diameters ranging from around 300 km to 750 km and lifetimes often less than 20 minutes (as estimated by,e.g., Zachariadiset al.
1987, Watanabeet al. 2011, Nelsonet al. 2013a), mean-ing they are observed at the lower limits of current in-strumentational capabilities.
Recently, Nelsonet al. (2013a) presented an analysis, using a thresholding technique, of small-scale regions of intense brightening in the Hαline wings, inferred using the Interferometric BIdimensional Spectrometer (IBIS; Cavallini 2006) situated at the Dunn Solar Telescope (DST), and found a dynamic behaviour within many events. It was concluded that many of these small events may be EBs and that higher-resolution data should de-crease the average observed size of EBs. However, as was discussed by Rutten et al. (2013), the strong net-work observable within the Hαwings may also influence the thresholding technique meaning that a proportion of the less dynamic small events could be purely network brightenings and more likely associated with magnetic bright points (MBPs).
Fig. 1.—The FOV of AR 11506 analysed within this article (corrected for local instrumental wavelength shifts), sampled at four positions within the Hαline scan: The far blue wing (approximately−1.8 ˚A; top left), the near blue wing (−0.95 ˚A; top right), the Hαline core (0 ˚
A; bottom left), and the red wing (+0.95 ˚A; bottom right). The black boxes in each image indicate the regions of interest analysed in the following Sections. A known artifact of the image reconstruction process is visible in the far blue wing at (883,−260).
within the lower atmosphere, thought to be consistent with small bi-polar regions observed in magnetogram data. By applying a linear force-free extrapolation pi-oneered by Demoulin et al. (1997), Pariatet al. (2004, 2007) discussed the nature of the photospheric magnetic fields close to EB events. It was found that approxi-mately 87% of EBs formed co-spatially with ∪-shaped magnetic topologies and, hence, concluded that a serpen-tine flux emergence model could lead to EB formation. Further to this, Matsumotoet al. (2008) presented ob-servations of flows co-spatial to EBs potentially support-ing the magnetic reconnection model. It was found that down- and up-flows in the photosphere and chromosphere
existed, respectively, suggesting bi-dimensional plasma ejection by an explosive event, possibly sourced in the up-per photosphere. Interestingly, during a detailed analysis of three suspected EBs by Bello Gonz´alezet al. (2013), one event was observed to penetrate through the chro-mospheric canopy into the Hαline core, indicating that large vertical flows within these events can sometimes occur.
3
Fig. 2.—Normalised line profiles of two representative EBs compared to the background intensity of the nearby quiet Sun. The EB line profiles (solid lines) for (left) box ‘A’ and (right) box ‘CS1’ in Fig. 1 compared to the quiet Sun (dotted line). The dashed line shows the inverted (for clarity) difference in normalised intensity between the quiet Sun and EB profiles. The heightened line wings of the EB line profile are representative of other events within these data.
that the apparent lifetime of EBs was shorter when ob-served at the limb and, importantly, that vertical exten-sions were evident. This work was expanded upon by Kurokawaet al. (1982), who analysed a large group of sunspots at the limb. These observations confirmed ver-tical extensions of EBs and provided the first quantifi-cation of lengths, at approximately 800 km, and widths, below 450 km for 80% of EBs. It is interesting to note, that this estimate of width agrees well with the mea-sured diameters of EBs on the disc by, for example, Georgouliset al.(2002) and Nelson et al.(2013a). More recently, using high-resolution Hαdata, Watanabeet al.
(2011) discussed the small-scale dynamics of EBs at a viewing angle of µ= 0.67, finding evidence of rapid in-creases in area, intensity, and vertical extensions. These ‘flaring’, morphological changes were identified as evi-dence of a high-energy driver within the lower atmo-sphere, specifically, magnetic reconnection. It is clear that further analysis of events observed close to the limb at high inclination angles, as presented here, could pro-vide interesting and useful results about the physical na-ture of EBs.
As well as observations, numerical methods have also been exploited to analyse the physical properties of EBs. Fanget al. (2006) presented a semi-empirical model, finding that increased temperature in the lower atmo-sphere could lead to Hα line profiles with increased intensity in the line wings, analogous to EBs. Nu-merical simulations, using the Coordinate Astronomi-cal NumeriAstronomi-cal Softwares (CANS) code, were presented in two- and three-dimensions by Isobeet al. (2007) and Archontis & Hood (2009), respectively, who found that flux emergence from below the photosphere could lead to ∪-shaped magnetic topologies and associated bright-ening events. More recently, a study was conducted by Nelsonet al. (2013b) who found Hα wing brightenings, analogous to EBs, co-spatial with magnetic reconnec-tion events within a MPS/University of Chicago Radia-tive MHD (MURaM) simulation box. This reconnection occured in the upper photosphere and led to increased
temperatures which explained the enhanced Hα wings, as hypothesised by Fanget al. (2006). Flows were also found, analogous to those observed by Matsumoto et al.
(2008), around the reconnection site. Interestingly, both the observations and the simulations showed FeI6302.5˚A
line core brightenings, which have been widely asso-ciated with magnetic reconnection (see, for example, Shelyaget al.2007).
In this article, we analyse both the morphology of EBs observed at the limb and any potential relationship be-tween these events and the surrounding plasma. We structure our work as follows: In Section 2 we discuss the data analysed in this article; Section 3 presents our re-sults, including a statistical analysis of EBs within these data and two individual case-studies. We discuss the im-plications of our findings in Section 4.
2. OBSERVATIONS
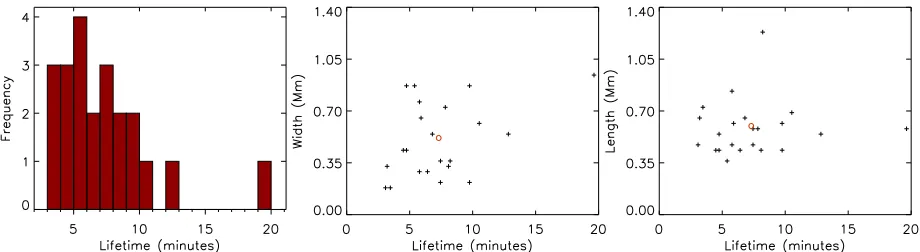
Fig. 3.—Basic statistical properties of EBs. (Left) Lifetime of each of the 22 identified events, with all but three events existing for less than 10 minutes. (Centre) Distribution of peak width vs lifetime. (Right) Same as centre but for length. The red circles indicate the mean of both variables for each plot.
within this article will discuss distances measured using this transverse scale), and the temporal cadence was ap-proximately 7.7 seconds, hence allowing for a detailed analysis of EB events. To conduct the analysis presented here, we exploit the excellent widget-based CRISPEX package (see Vissers & Rouppe van der Voort 2012).
We also make use of data taken by the Solar Dy-namics Observatory’s Atmospheric Imaging Assembly
(SDO/AIA; see Lemenet al. 2012) instrument. These data image the entire solar disc within the UV spectrum using filters around 1600 ˚A and 1700 ˚A. These data have effective spatial and temporal resolutions of around 1000 km and 48 seconds, respectively. The outer layer of the solar atmosphere is also observed using a number of EUV filters; however, in the analysis presented here, we show only the 304 ˚A filter. Each EUV image has a spatial resolution of approximately 1000 km and a temporal res-olution of 24 seconds.
In Fig. 1, we present an overview of the FOV analysed within this article. Clockwise from the top left image, we plot the array returned by the narrow-band CRISP filter for each of−1.8 ˚A, −0.95 ˚A, +0.95 ˚A, and 0 ˚A at approximately 7:36:20 UT. Within this FOV, sit three sunspots (two in the southern part of the FOV and one in the northern section) as well as a large plage region. It is around these sunspots that all EBs occur that are of interest for this analysis. What is immediately apparent from these images, is that the underlying photosphere is obscured by absorption resulting from the chromospheric material in the Hα line core in the bottom left image. The complex fibril structures observed in the line core appear to be present higher in the atmosphere, hence, potentially obscuring some of the vertical extent of the EBs in this dataset. We overlay three boxes on all images highlighting the three EBs analysed in detail.
3. RESULTS
3.1. EB statistics
Within the Hαline profile, EBs are easily identified as increases in intensity observed in images around 0.5 ˚A ei-ther side of the line core. Modern imaging-spectrometers, such as the CRISP instrument, are able to provide fast wavelength tuning between each line position included in a line scan allowing confident identification of EBs. Here, we define EBs as events which show both intensity increases which are greater than 1.5 times the intensity of the nearby quiet Sun in the wings of the Hαline profile
and also a dynamic, explosive nature evidenced by imag-ing data. Fragmentimag-ing EBs observed within these data are classified as being a single event. If an event dies completely and does not recur for five frames, any new co-spatial brightening is classified as a new EB event. By employing these guidelines, we remove the influence of network bright points such as those situated atxc=893′′,
yc=-250′′, which have a consistently lower line wing in-tensity throughout these observations, as compared with EB wing intensity excess. Overall, we confidently iden-tify 22 EB events within these observations. Three re-gions which contain EBs during these observations are highlighted in Fig. 1 by black boxes for further analysis. In Fig. 2, we plot normalised line profiles for two of the representative EB events highlighted in Fig. 1 (solid lines; scaled to the maximum intensity of the EB profile). The significant intensity increases within these events are evi-dent when compared to the local quiet Sun (dotted lines; also scaled to the maximum intensity of the EB profile). To highlight the percentage increase in intensity, we also plot the inverted (for visual ease) difference between the quiet Sun and the EB events (dashed lines). The dif-ference between line-wing intensities peaks at over−0.5 indicating a doubling of the intensity from the quiet Sun for these EB events in their respective frames. Such gra-dients between EBs and the background atmosphere are not observed in every frame as the intensity of individual events appears to vary on timescales of seconds (as was discussed by Qiu et al. 2000). We note that an accept-able thresholding value is highly dependent on a number of factors such as the instrumentation, data processing techniques, and the seeing at the time of the observa-tions.
After the identification of all apparent EBs in the data, each event was carefully analysed to determine its life-time and area. As the definitions between EBs and the background are strong in these data (as is shown in Fig. 2), the estimation of the lifetime was easily com-pleted by analysing the evolution of each EB through time. The initial and final frames of each event were iden-tified visually by studying the imaging data which show the evolution of these events clearly. Overall, the average lifetime of EBs in these data was found to be approxi-mately 7 minutes, comparable to previous researches by,
5
Fig. 4.— The smoothed projection profiles for the tips (nor-malised against the peak length of each event) of the three EB segments analysed in Case Study: I (top) and three other indepen-dent EBs (bottom). Each event is plotted through its full lifetime. The top panel highlights the parabolic evolutions of each small segment, indicative of a repetitive driver. These profiles are sim-ilar to the majority of EB events, represented by the dashed and dot-dashed lines in the bottom panel.
is plotted in Fig. 3a.
We plot both the peak width and peak length of each EB event against lifetime in Fig. 3b and Fig. 3c. It is ap-parent (although not significantly correlated) that longer lived EBs appear to be larger (as previously discussed by Roy & Leparskas 1973). As the majority of EBs exhibit parabolic morphological evolutions through time (as ev-idenced in Fig 4), it appears that the strength of the initial driver is a key variable in defining the statistical properties (such as lifetime and area) of each EB event. It should be noted that parabolic and ballistic profiles would not be discernible within these data due to their similarity in the photosphere and the spatial resolution. Therefore, we use ‘parabolic’ as an umbrella term for both profile types. Basic energy estimates of EBs (see, for example, Georgouliset al.2002) require both lifetime and area and, hence, it would appear that a correlation exists between lifetime and energy release. Future anal-ysis with a larger statistical sample should further test this assertion.
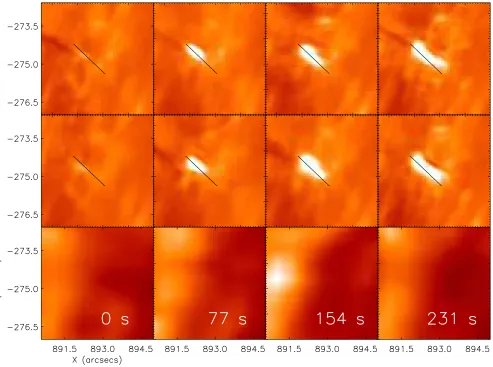
In Fig. 5, a representative EB event is plotted through its onset until it reaches its peak length. The EB ap-pears simulataneously and co-spatially in both wings be-fore extending away along a constant trajectory. The black lines in Fig. 5 indicate the path of the EB over time. It is interesting to note that all but two of the EBs analysed appear to have tips which extend and con-tract with parabolic profiles, however, horizontal motions within these events are also common. Each EB was care-fully analysed for both vertical and horizontal motions and the results were recorded. For the parabolic EBs
identified, an average vertical speed of around 9 km s−1 was observed (from onset to peak extension), with most events reaching higher velocities during their most ex-plosive periods. It was found that 12 of the EB events analysed here exhibited transverse motions, averaging at 1.5 km s−1(similar to velocities observed by, for example, Denker et al.1995, Nindos & Zirin 1998); however, sev-eral EBs had apparent motions over 3 km s−1. The aver-age horizontal speed is slightly higher than previous es-timates (by,e.g, Georgouliset al.2002, Watanabe et al.
2011, Nelsonet al.2013a), probably due to a small num-ber of extremely dynamic events which are observed. We examine two EBs with significant horizontal speeds, and an apparent influence on the wider atmosphere, in detail in the following case studies.
Co-spatial EUV data inferred by the SDO/AIA in-strument are also analysed for each EB. As EBs con-sist of a vertical extension, one may expect that some signature would be observed in the upper atmo-sphere, however, the majority of previous studies have found no signal even within the Hα line core (see, for example, Zachariadiset al. 1987, Watanabeet al.
2011, Visserset al. 2013). Despite recent work by Bello Gonz´alezet al. (2013) suggesting that some EBs may penetrate into the chromosphere, it is still unclear whether these events have any influence on the chromo-sphere and corona. The EBs analysed in this article show no influence in the upper atmosphere (although this lack of influence is to be expected within data collected at the limb), specifically within the Hαline core, as indicated in Fig. 1, or the EUV SDO/AIA filters, as plotted in Fig. 5 and Fig. 6. Had co-spatial IRIS observations been available for this research, it would have been interesting to analyse what the overall influence of EBs is on the Transition Region plasma around 100,000 K.
As the intensity enhancement of an EB occurs in both wings of the Hα line profile simultaneously and corre-sponds to apparent vertical motions, it is likely that these observables are a result of increased temperature and density within the ejected plasma compared to the surrounding atmosphere. This hypothesis agrees with simulations of EBs within the lower solar atmosphere (by, e.g., Fanget al. 2006; Nelsonet al. 2013b), and with observations of flows co-spatial to EB events (e.g., Matsumoto et al. 2008). It has been widely speculated, as previously discussed, that magnetic reconnection in the photosphere could lead to plasma ejection, hence cre-ating density increases in the local atmosphere similar to those observed here; however, it should be noted that no magnetic field data of sufficient resolution comparable to EB cross-sections are available for comparison to the CRISP data.
3.2. Case Study: I
Fig. 5.—Evolution of EB event ‘A’ (from Fig. 1) in the blue (top) and red (middle) wings of the Hαline profile with the co-spatial SDO/AIA 304 ˚A filter (bottom). The EB event appears in both wings simultaneously from an apparent footpoint before extending along a constant axis (identified by the black line of length 1200 km) to its peak length. After the fourth frame, it then fades back along the same axis. The initial images of this figure were taken at 17:32:30 UT and each subsequent image 77 seconds later.
to the formation of a number of EBs in a structured man-ner. EB events within this region display strong horizon-tal motions and appear to trigger other, similar events in different spatial locations.
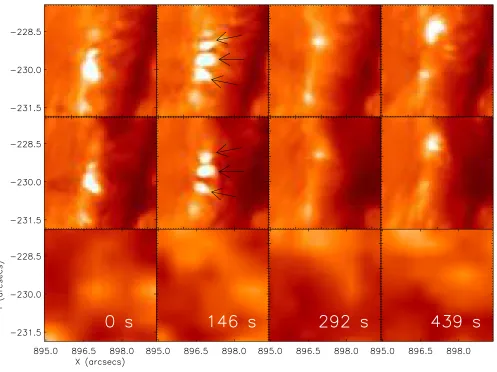
In Fig. 6, we plot the evolution of the northern event emphasised in Fig 1 with the label ‘CS1’, with respect to time for both 6561.7 ˚A and 6563.83 ˚A (−1.1 ˚A and +1.03 ˚A from the line core, respectively). The first frame depicts the original EB, before spatial fracturing within this event is evident in the second frame (indicated by arrows). Each independent fracture appears to slowly propagate away from the original footpoint along the bright trail evident in the third frame. After the orig-inal EB fades for long enough such that it is deemed to have ended, a second large EB event occurs, as evidenced in the fourth frame. This rapid morphology is reminis-cent of the evolution of the magnetic field simulated by,
e.g., Archontis & Hood (2009), where an emerging flux rope formed in a ‘sea-serpent’-like manner reconnected at each individual∪to form a larger over-lying loop.
EBs have been shown to occur co-spatially with
inter-granular lanes (see, for example, Denker et al. 1995, Nelsonet al. 2013a). It is possible that the bright trail which appears to guide the EBs is evidence of a localised network structure, or an inter-granular lane. On-disc observations of the Hαline wings often include weak in-tensity increases, reminiscent of this trail, co-spatial to strong magnetic fields, inferred using magnetogram or G-band data. It is, therefore, possible that these EBs are propagating along a defined structure and, hence, that further information could be derived by analysing on-disc examples of such events. High-resolution, multi-wavelength observations close to the disc centre should be further investigated to infer whether these events are indeed guided by the magnetic field.
7
Fig. 6.—An illustration of the propagation of the EB analysed in Case Study I for both the blue (−1 ˚A; top) and red (+1 ˚A; middle)
wings of the Hαline profile, as well as the SDO/AIA 304 ˚A filter (bottom). The almost northward propagation of this event appears to be parallel to the near-by penumbra and follows the bright track evident in the third panel. In the second panel for each wavelength, three small sub-structures are highlighted with arrows. The line wings are originally sampled at 7:29:54 UT and each subsequent image is separated by 146.3 seconds.
the creation of multiple vertical peaks within this in-dividual EB? If magnetic reconnection is indeed the driver of EBs, then, are we observing a ‘train’ of recon-nection through a ‘sea-serpentine’ morphology as simu-lated by Archontis & Hood (2009)? Thus, are sequen-tial and apparently connected EBs a signature of a yet un-determined large-scale sub-surface process? The spa-tial separation between the inispa-tial and final EB event is around 2200 km, hence, this would suggest that a sin-gle reconnection event in a unstable region could lead to a sustained energy release within the local plasma (of course, this statement also applies if another driver is the cause of these events). For a full analysis of events such as this to be completed, high-resolution magnetic field data would be required, well beyond the current capabil-ities of instrumentation. It is, therefore, imperative that further research be carried out using both imaging ob-servations and state-of-the-art computational modelling. The second important result which can be drawn from this event is that small-scale EB dynamics, as discussed
by Nelsonet al. (2013a), are conspicuous within these data. It is inherently clear that higher-resolution data may allow further insight into the dependence, or in-deed independence, of these small-scale events to close-by larger EB events. The individual parabolic profiles evident in each of the smaller-scale structures (Fig. 4a) analysed in this example (analogous to the profiles ob-served in Fig. 5) adds weight to the argument that each fragment may be formed by a separate (or a single repet-itive migrating) driver. Overall, we suggest that future analysis of EBs in a wide range of datasets be conducted to assess whether a minimum EB size is determinable using modern instrumentation.
3.3. Case Study: II
Fig. 7.—The evolution of the EB analysed in Case Study II at +0.8 ˚A. In the top row, four frames from this wavelength are plotted starting at 7:40:49 UT and separated by 146.3 seconds. The initial EB event is easily observed in the left-hand frame. The most dynamic horizontal motion of the event is shown in the second frame before the generation of the apparent loop is depicted in the third and fourth frames. The bottom row shows the time-distance analysis of the black slit overlaid on the top row with intensity normalised through time to remove the influence of changes in seeing. The black line indicates the speed of the event through time, highlighting the evident deceleration. The speeds of the event at the times marked by 1 and 2 are 6.2 km s−1 and 0.6 km s−1, respectively. White vertical lines depict the temporal position of each of the four top row plots.
exhibits the most rapid apparent horizontal motions ob-served in this dataset (around 6 km s−1), which occur during an apparent splitting of the event. Such dynam-ics have yet to be studied in the literature and provide a potentially excellent diagnostic tool for future analysis of the driver of EBs.
The evolution of the event is depicted by the top row of Fig. 7 which shows information observed at +0.8 ˚A. The original EB, initial splitting, fading, and then loop formation are visualised from left to right, respectively. The bottom row of Fig. 7 includes a time-distance plot for the spatial positioning indicated by the black line in the top row. The initial off-shoot appears to be as bright as the original EB event and propagates away from the formation site at a speed of 6.2 km s−1. This is over four times the average apparent horizontal motion speed of EBs within these data. The off-shoot continues to move away from the large EB and decelerates until it reaches a speed of around 0.6 km s−1. A black line is overlaid on the time-distance plot to emphasise the path of the off-shoot.
Of particular interest here is the similarity of this evo-lution to magnetic flux emergence events. Compara-ble morphological traits to these were reported by both Otsujiet al. (2007) and Ortizet al. (2013). These re-searches analysed events which had initial separation speeds of around 5 km s−1 that dropped to around 1 km s−1, and spatial separations of the footpoints on the order of 2200 km - 3000 km. Flux emergence models also commonly discuss the occurrence of bright regions at the footpoints of formed loops (by such authors as
Guglielminoet al.2008), as observed here in the form of EBs. These brightenings have been linked to reconnec-tion between the emerging and existing fields and could facilitate the transport of energy from the lower solar at-mosphere into the corona (as found to be, for example, by Isobeet al.2008). Unfortunately, as this event occurs during the final frames of this dataset, we are unable to establish whether this brightening and loop structure displays the traits observed in previous studies. Interest-ingly, Zachariadiset al. (1987) observed the occurrence of EB pairs, separated by around 3′′. It is plausible that such pairs were formed in a comparable method to that described in this subsection.
In terms of EBs, this apparent link to an observation of flux emergence could prove exciting. Magnetic flux emergence has long been discussed as a potential driver of magnetic reconnection (see, for example, Heyvaerts et al.
9
datasets should be analysed in the near future to further test these findings, specifically in terms of how many EBs are actually linked to examples of flux emergence.
4. DISCUSSION
The results presented here support the conclu-sions of earlier investigations, where it has been sug-gested that EBs are energetic explosive events ema-nating from the lower solar atmosphere (see, for ex-ample, Georgouliset al. 2002, Watanabeet al. 2011, Nelsonet al. 2013b). The average lifetime and spatial properties of brightenings analysed in this article (7 min-utes and widths around 0.65′′) are comparable to values reported by a number of authors as properties of EBs, therefore, allowing us to confidently link these near-limb events to on-disc EBs. However, we present the first limb measurements of EB lengths using state-of-the-art ground based instrumentation, finding the average height of these events to be 600 km (which is well below the be-lieved height of formation for the Hα line core of 2000 km). This is slightly shorter than previous estimates by Kurokawaet al. (1982). It should be noted that a plethora of highly dynamic events within our data were observed which did not eventually reach the required intensity threshold, possibly due to a mixing of events within the line-of-sight manifesting in a single less in-tense line profile. Because of this, we suggest that fur-ther study of EBs at the limb with a range of datasets could provide interesting additional insights.
We also find strong evidence of flows associated with EBs, agreeing with previous observations by, for example, Roy & Leparskas (1973) at the limb and Matsumoto et al.(2008) on the disc. The tips of 20 out of 22 events appear to follow a parabolic path through time suggesting the occurrence of a displacement of plasma, increasing the density and temperature within a localised region, hence, leading to the enhancement of the inten-sity in the wings of the Hαline profile. We suggest that this propagation of plasma is analogous to the flows ob-served by Nelsonet al.(2013b) at a simulated reconnec-tion site where rapid cancellareconnec-tion of opposite polarity field occured. Unfortunately, due to the FOV of these ob-servations being situated at the solar limb, we are unable to confidently present co-temporal, co-aligned magnetic field data to analyse with this dataset; hence, further as-sertions about the formation of these events elude us. We note, however, that no evidence of EBs within the Hαline core or the SDO/AIA EUV filters is found, agreeing with previous studies which have concluded that the vertical extensions of these events may not be sufficient enough to penetrate into the chromosphere and lower corona.
The two individual case studies presented in Section 3 highlight small-scale dynamics associated with EBs which have not previously been observed. Within the first case study, the influence of an EB on the surround-ing atmosphere was analysed. A large EB event appeared (by visual inspection) to fragment, with the small-scale pieces appearing to propagate north, away from the ini-tial event. Each of the small-scale fragments were only around 230 km in diameter, similar in size to the events analysed by Nelsonet al. (2013a). The northern-most
fragment drifted to around 1500 km from the initial po-sition before reducing dramatically in size and fading be-low the threshold of 1.5 times the background intensity. A second large EB event was, then, observed to occur at the same spatial position. This case study highlights the influence that EBs can have on the surrounding localised plasma. Other examples of the horizontal extensions of EBs are also observed within these data, however, as these events are further towards the limb, we are un-able to fully resolve any potential smaller-scale structures within the larger event.
The second case study discussed a rapid splitting of a large EB event close to a large sunspot. The main body of the ejection appeared to propagate south, away from the initial event, and continued through until the end of these observations, decelerating from around 6.2 km s−1 to approximately 0.6 km s−1. Possibly, the most inter-esting aspect of this example is the apparent loop forma-tion between the two main bodies in the Hαline wings, potentially indicating a flux emergence region (see, for example, Otsuji et al. 2007, Ortizet al. 2013). Despite a significant apparent vertical extension of this loop, no evidence of any such structure within the Hα line core was found (possibly due to the dense foreground struc-tures in the Hαline core obscuring any signal) suggesting that even a dynamic event, such as this example, has no initial influence on the upper chromosphere. Unfortu-nately, our observations end before the loop faded and we are unable to discuss the full evolution of this event. We strongly encourage that further work be carried out to fully test whether other flux emergence regions can be correlated to EBs.
Overall, we suggest that this analysis highlights both the small-scale structuring and dynamic nature of EBs. An investigation of a wide variety of these events at a range of spatial positions over the Sun would be required to fully understand how many EBs display morpholo-gies similar to those discussed within the presented case studies. We have now addressed the importance of inves-tigating the sub-structures of small-scale, explosive phe-nomena in the lower solar atmosphere which can act as important agents in triggering local instabilities in the magnetic environment of the solar surface. Such influ-ence can be both vertically and horizontally orientated and require extensive future study.
Research at the Armagh Observatory is grant-aided by the N. Ireland Dept. of Culture, Arts and Leisure. We thank the UK Science and Technology Facilities Council for CJN’s and NF’s studentships, PATT T&S support, plus support from grant ST/J001082/1. The Swedish 1-m Solar Telescope is operated on the island of La Pal1-ma by the Institute for Solar Physics of Stockholm University in the Spanish Observatorio del Roque de los Muchachos of the Instituto de Astrofsica de Canarias. We thank L. Rouppe van der Voort (Institute of Theoretical As-trophysics, University of Oslo) for advice on data reduc-tions with MOMFBD for SST/CRISP. RE is thankful to the NSF, Hungary (OTKA, Ref. No. K83133) and acknowledges M. K´eray for patient encouragement.
REFERENCES
Henriques, V. M. J.: 2012, A&A548, A114
Heyvaerts, J., Priest, E. & Rust, D. M.: 1977, Sol. Phys.53, 255 Isobe, H., Proctor, M. R. E. & Weiss, N. O.: 2008, ApJ679, L57 Isobe, H., Tripathi, D. & Archontis, V.: 2007, ApJ,657, L53 Kurokawa, H., Kawaguchi, I., Funakoshi, Y. & Nakai, Y.: 1982,
Sol. Phys.79, 77
Lemen, J. R., Title, A. M., Akin, D. J.et al.: 2012, Sol. Phys. 275, 17
Matsumoto, T., Kitai, R., Shibata, K., Otsuji, K., Naruse, T., Shiota, D. & Takasaki, H.: 2008, PASJ60, 95
Nelson, C. J., Doyle, J. G., Erd´elyi, R., Huang, Z., Madjarska, M. S., Mathioudakis, M., Mumford, S. J. & Reardon, K.: 2013, Sol. Phys.,283, 307
Nelson, C. J., Shelyag, S., Mathioudakis, M., Doyle, J. G., Madjarska, M. S., Uitenbroek, H. & Erd´elyi, R.: 2013, ApJ 779, 125
Nindos, A. & Zirin, H.: 1998, Sol. Phys.182, 381
Ortiz, A., Bellot Rubio, L., Hansteen, V., de la Cruz Rodriguez, J. & Rouppe van der Voort, L.: 2013, ArXiv e-prints
Otsuji, K., Shibata, K., Kitai, R.,et al.: 2007, PASJ59, 649 Pariat, E., Aulanier, G., Schmieder, B., Georgoulis, M.K., Rust,
D.M. & Bernasconi, P.N.: 2004, ApJ614, 1099
Engineers (SPIE) Conference Series , 341
Scharmer, G. B., Narayan, G., Hillberg, T., de la Cruz Rodr´ıguez, J., L¨ofdahl, M. G., Kiselman, D., S¨utterlin, P., van Noort, M. & Lagg, A.: 2008, ApJ689, L69
Sekse, D. H., Rouppe van der Voort, L. & De Pontieu, B.: 2012, ApJ752, 108
Shelyag, S., Sch¨ussler, M., Solanki, S. K. & V¨ogler, A.: 2007, A&A,469, 73
Shibata, K., Nozawa, S. & Matsumoto, R.: 1992, PASJ44, 265 van Noort, M., Rouppe van der Voort, L. & L¨ofdahl, M. G.: 2005,
Sol. Phys.228, 191
Vissers, G. & Rouppe van der Voort, L.: 2012, ApJ750, 22 Vissers, G. J. M., Rouppe van der Voort, L. H. M. & Rutten,
R. J.: 2013, ApJ774, 32
Watanabe, H., Vissers, G., Kitai, R., Rouppe Van Der Voort, L. & Rutten, R. J.: 2011, ApJ736, 71