This is a repository copy of Extremely Large Magnetic Entropy Changes, Quantum
Phases, Transitions and Diagram in Gd(OH)3 Single Crystal Nanowires - Quasi-1D Large Spin (S = -7/2) Chain Antiferromagnet.
White Rose Research Online URL for this paper: http://eprints.whiterose.ac.uk/81689/
Article:
Zeng, R., Zhang, C.F., Debnath, J.C. et al. (5 more authors) (2012) Extremely Large Magnetic Entropy Changes, Quantum Phases, Transitions and Diagram in Gd(OH)3 Single Crystal Nanowires - Quasi-1D Large Spin (S = -7/2) Chain Antiferromagnet.
[email protected] https://eprints.whiterose.ac.uk/
Reuse
Unless indicated otherwise, fulltext items are protected by copyright with all rights reserved. The copyright exception in section 29 of the Copyright, Designs and Patents Act 1988 allows the making of a single copy solely for the purpose of non-commercial research or private study within the limits of fair dealing. The publisher or other rights-holder may allow further reproduction and re-use of this version - refer to the White Rose Research Online record for this item. Where records identify the publisher as the copyright holder, users can verify any specific terms of use on the publisher’s website.
Takedown
If you consider content in White Rose Research Online to be in breach of UK law, please notify us by
SUPPLEMENTARY INFORMATION
Extremely Large Magnetic Entropy Changes, Quantum
Phases, Transitions and Diagram in Gd(OH)
3Single Crystal
Nanowires - Quasi-1D Large Spin (
S = -7/2
) Chain
Antiferromagnet
R. Zeng 1, 2, C.F. Zhang1, J.C. Debnath1, P. Shamba1, J.L. Wang1, Z.X. Chen1, Z.P. Guo1, S.X. Dou1
1
Institute for Superconducting and Electronic Materials, University of Wollongong, NSW 2522, Australia
2
School of Computing, Engineering and Mathematics, University of Western Sydney, Campbelltown, NSW 2560, Australia
Address for Correspondence:
R. Zeng
Solar Energy Technologies
School of Computing, Engineering and Mathematics University of Western Sydney
Penrith Sout, Sydney, NSW 2751, Australia
SUPPLEMENTARY INFORMATION
Abstract
The study of quantum phase transitions (QPT) has continually attracted great interest from many researchers over the last three decades 1-7, especially since the discovery of the cuprate high temperature superconductors. The magnetocaloric effect in quantum spin systems has recently attracted renewed attention because field-induced QPT leads to universal responses when the applied field is varied adiabatically 3, 8, and the magnetocaloric effect (MCE) is the only way to approach the limit of low temperature (T → 0 K). In terms of applications of MCE, magnetic refrigeration (MR) has become a promising alternative to conventional refrigeration technology 9-14 due to its more energy-efficient and environmentally-friendly features, and the exotic paramagnetic (PM) phases and transitions that accompany it have become more and more important for fundamental research, quantum computing, and space technology application 15-18. The MCE is defined as the temperature change in magnetic materials as a result of alignment of spins when the material is exposed to a magnetic field. Giant MCE near room temperature has been reported in recent years, but there are still problems with hysteresis (due to the nature of first order ferromagnetic phase transitions) for practical application13. At the same time, high MCE materials with molecular clusters and nanostructures for access to ultra-low temperature have also been proposed and successfully measured and confirmed 15-28, but the MCE values still seem somewhat low for high MR efficiency. On the other hand, low temperature MCE or even zero-point entropy study is important for our understanding of complex phase structures and exotic paramagnetic phase transitions of many low dimensional and frustrated magnetic materials. Here, we have conducted systematically magnetic and magnetothermal measurements at temperatures down to 2 K and magnetic fields up to 13.5 Tesla, analysis and report that, (1) magnetic field enhances the thermal and local spin fluctuations which suppress long-range spin ordering (LRO) within the measured temperature range, and close to 0 K at the quantum critical point (QCP); (2) possible field-induced exotic local spin-liquid-like, aligned-spin, and spin-flip exotic paramagnetic phases, and transitions in the low temperature and high field range have been observed, allowing us to identify a possible quantum critical point; (3) there is extremely large, fully reversible MCE (magnetic entropy change (-ΔSM)= 27.8, 66, and 88 J / kg K, adiabatic temperature change (ΔTad) = 6.7, 17.6, and 36.4 K at
SUPPLEMENTARY INFORMATION
Introduction
A large magnetocaloric effect (MCE) can be obtained near the magnetic-ordering temperature by aligning the spins under application of an external magnetic field. A giant MCE is usually found to be related to a field-induced first-order magnetic transition 9-12. However, a first-order transition usually gives rise to considerable thermal/magnetic hysteresis due to concurrent field-induced crystallographic structural changes, which is disadvantageous for applications. Therefore, much attention has been focused on finding new materials with a large MCE and small thermal/magnetic hysteresis 5, 6. Research is in progress to find new materials which have large MCE at low fields close to room temperature for domestic and other technological applications. On the other hand, systems showing large MCE in the low-temperature region from about 20 K down to the sub-Kelvin range are also important for basic research, as well as for specific technological applications, such as space science and liquefaction of hydrogen and natural gas in the fuel industry
15 - 28
. In particular, when a temperature approaching absolute zero is needed (T → 0 K), it is only magnetic refrigeration technology that can achieve it. On other hand, when the temperature T → 0 K, according to thermodynamic principles, all matters should be ordered and show very low entropy and entropy change, while for some materials, especially for low dimensional magnetostructural magnets, the enhanced spin fluctuations would suppress magnetic ordering and give rise to a variety of exotic phenomena and novel types of magnetism, such as quantum critical phenomena and quantum phase transitions under changes in external conditions. One such example is the magnetic field induced quantum critical point. When the system emerges from the Òlocal spin liquidÓ state, the system is in a highly degenerate and low-lying energy state. All the spins are singlets, but in strongly coherent, low-lying, even gapless energy states, so that external field can easy align them and translate the state to an aligned spin state, which may generate extremely high magnetic entropy change.
The quantum phase transitions (QPTs), in contrast to their classical counterparts at T > 0 K, where thermal fluctuations are important, are driven by a control parameter other than temperature, e.g. composition, pressure, or field. A quantum critical point (QCP) commonly separates an ordered from a disordered phase at T → 0 K. The magnetocaloric effect may be enhanced by magnetic ion clusters 19 and magneto-structural geometric frustration 28, promising an improved efficiency in T →
0 K refrigeration application. The development of magnetic refrigerant materials for ultra-low temperatures has mainly been focused on the garnets and paramagnetic salts 20. However, those materials normally also present a somewhat high ordering temperature, which introduces a very low MCE at ultra-low temperature and hence limits the lowest temperatures achievable with paramagnetic salts. In recent years, superparamagnetic nanostructured materials 21, 22, well designed molecular nanomagnets and magnetic clusters 23-27, and frustrated magnets 19 have been introduced to improve the MCE required to reach T → 0 K.
Here we introduce a new nanosized Gd(OH)3 material, which shows a large spin (S = 7/2)
SUPPLEMENTARY INFORMATION
spin-liquid), aligned-spin and spin-flip exotic paramagnetic phases and their transitions occur in the low temperature and high field range, making it possible to determine the quantum critical point and construct the phase diagram. Moreover, we have demonstrated an extremely large reversible magnetic-entropy change observed in the paramagnetic phase transition range of high spin Ising chains in Gd(OH)3 single crystal nanowires. These indicate that, in contrast to classical phase
transition, giant MCE can be obtained near the first order transition temperature, extremely large MCE can be obtained around the spin fluctuation temperature range, and in the continuous quantum phase transition temperature range.
Abstract
Gd(OH)3 nanowires were synthesized by a facile hydrothermal method, as described in the
experimental methods section. Microstructure analysis indicate that the sample present highly purity and uniformity features, the details see supporting information (SI) in Fig. S1. The crystal structure dominates the magnetic properties of bulk Gd(OH)3, with a weak nearest-neighbor isotropic
exchange aligned in the c-direction, causing an antiferromagnetic interaction, and a much weaker next-nearest neighbor exchange that gives rise to a ferromagnetic interaction, plus a likely dipole interaction, which drives the long-range order to very low temperature (NŽel temperature, TN≈ 0.94
K) 29, 30.
The form of the effective spin Hamiltonian for Gd(OH)3 should be identical to that of other
isostructural Gd3+ compounds, several of which have previously been studied in some detail 31, 32. This has been calculated 29 according to experimental magnetic and magnetothermal measurement data and is expressed by the following spin Hamiltonian equation (1):
Ηami = ∑i>j JijSiSj ∑ i>j αij [SiSj - Si rij ) Sj rij )] ∑ i gµBHSi + VC Ð H ∑ i Si (1)
where αij = g2µB2 / rij2 is a measure of the strength of the magnetic dipole-dipole coupling and rij
is the distance between ions i and j; the effective spin S = 7/2, the g factor has been found to be about 2, the term VC denotes the effect of the crystal field and indicates that the largest single
interaction is the nearest-neighbor isotropic exchange J1 = 0.180 K, which tends to weakly align
nearest neighbors antiferromagnetically. The next-nearest-neighbor exchange is ferromagnetic, but much smaller, J2 = 0.017 K, and the third nearest-neighbor exchange, in addition to the effect of the
SUPPLEMENTARY INFORMATION
Ηami = ∑i>j JijSiSjÐ H ∑ i Si (2)
The 1D Ising chain in transverse field is perhaps the most-studied theoretical paradigm for a quantum phase transition 1-6. We cannot reach sub-Kelvin temperatures in our laboratory, however, our high field magnetic measurements and the magnetocaloric properties (down to 2 K) can be employed to predict the presence of any state with field-induced orderings, as Ref. [33] has demonstrated that some remarkable properties of the 1D quantum chain may have important implications for experimental characterization of QPTs when one is unable to reach temperatures below which a QPT can be seen. As well, proximity to a quantum critical point may be the cause of unusual properties in a variety of materials, even when the quantum critical point itself has not been observed. In such materials, the quantum critical point might only be observable with an unphysical tuning parameter such as negative pressure. Yet the proximity to quantum criticality would still leave a shadow on the phase diagram of the material, since the QCP is entirely an extrapolation of experimental data. Although the Gd(OH)3 single crystal nanowire material is not a large single
crystal, in the randomly aligned powder nanowires, part of the single crystal wires are under external transverse magnetic field when there is an applied field; in addition, although the magnetic anisotropy of Gd(OH)3 material is not very large, reasonable anisotropy has been demonstrated in a
single crystal sample 29; in particular, the very low exchange energy J in Gd(OH)3 materials can be
easy matched by experimentally attainable magnetic fields (10 T ≈ 1 meV) to access the QCP, so that high field measurements may be very beneficial to explore the exotic paramagnetic phases (or quantum phase) and QPTs, and to establish the quantum phase diagram.
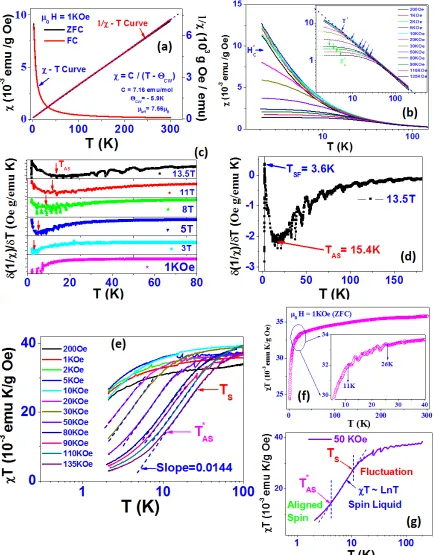
A series of magnetic and magnetothermal measurements have been conducted to identify the possible magnetic states and possible quantum phase transitions. Detail magnetic susceptibility (χ) analysis was shown in SI information (Fig. S2). The temperature dependence of the magnetic susceptibility (χ) under zero field cooling (ZFC) and field cooling (FC) in an external magnetic field H = 1000 Oe is plotted in Fig. S2(a). The curves can be well fitted as Curie-Weiss law behaviour over the whole temperature range, with the Curie-Weiss temperature, ΘCW≈−5.91 K, the Curie constant, C = 7.16 emu / mol, and the effective magnetic moment, µeff = 7.56 µB, where µBis
the Bohr magneton. The fitting line is shown by the solid blue line in Fig. S2(a). However, there is no spontaneous magnetic ordering transition that takes place within the temperature range from 2 to 300 K in this nanowire system. The negative value of ΘCW is expected because of the potential for antiferromagnetic interaction below 2 K. We note that µeff = 7.56 µB is slightly lower than, but very
close to the theoretical effective magnetic moment of non-interacting Gd3+ ions (µeff = 7.95 µB) 32.
SUPPLEMENTARY INFORMATION
measuring the influence of frustration on the cooperative transition. In this Gd(OH)3 nanowire
system, f > 6, since the TN should be lower than 0.94 K 29, as the TN in a nanoscale material is lower
than in the corresponding bulk system. That 1/χ is linear at such a small value of TN/ΘCW is
surprising in itself and represents another characteristic feature of frustrated systems. In non-frustrated systems, χ starts to deviate from Curie-Weiss behaviour at T ≈ 2ΘCW, making a linear extrapolation of 1/χ possible only if there is data over a significant range of temperature above 2ΘCW. Since this deviation from Curie-Weiss behaviour is a result of growing correlations among the spins, e.g., most likely due to the Ruderman-Kittel-Kasuya-Yosida (RKKY) interactions of the 4f
7
unpaired electrons moment for the negligible of (i) superexchange and dipolar interaction in the insulating 1D Ising chain spin structure, (ii) single-ion Kondo coupling, and (iii) crystal electric field (CEF) scheme of Gd3+. Since mean-field theory is inadequate for predicting the critical temperature in large frustration factor f value systems, it is inapplicable for describing the linearity of 1/χ. The value of f > 6 means that this Gd(OH)3 spin chain is an intermediate frustrated system,
and the unusual features of the above-mentioned remarkably simple behaviour can be currently explained by a local spin liquid-like scenario. 35-37 Therefore, the strongly frustrated systems have the unusual feature that the spins behave like free entities, despite the extremely large temperature-renormalized coupling strength. This means that the system may emerge from a local spin liquid-like state under finite conditions.
Those results suggest that the system is a simple spontaneous paramagnet and that superparamagnetic behaviour does not appear in the temperature range from 2 to 300 K, but typically, exotic paramagnetic phases and complex transitions might be observed due to the weakly frustrated quasi-1D spin chain structure, where strong thermal and local spin fluctuations compete with the spontaneous antiferromagnetic interaction. We indeed observed that the relationship between susceptibility (χ) and temperature shows significant changes under high field, as shown in Fig. S2(b), where the where χ - T curves under field from 1 kOe to 135 kOe are presented, and the inset shows the χ vs. log T curves. We note that there is a divergence in the susceptibility (χ) for T→ 0 K that appears in the magnetic field range from 1 to 2 T, and a critical field H*C may be
present around 1-2 T. As shown in Fig. S2(b) and the 1/χ−T curves shown in Fig. 1(a), when H < H*C, the curves can be well fitted to the Curie-Weiss (CW) rule Ð the system is strictly a CW
paramagnet, but when H > H*C, the curves show a downturn (χ - T curves ) or upturn (1/χ−T
curves). A systematic study has revealed a divergence in the susceptibility (χ) for T → 0 K at a critical point. The spontaneous moment vanishes linearly at the critical point 37. We employed a similar method to analyse the critical phenomena and critical points at T → 0 K in our system. At H < H*C , the system falls into the classical conventional range, and we use the Curie-Weiss (CW) rule
to analyse the system and determine the spontaneous inverse susceptibility 1/χ0 at T → 0 K. At H > H*C, the system falls into the quantum phase transition regime, and we directly extrapolate from the
experimental data to determine the inverse susceptibility 1/χ0 at T→ 0 K. Fig. 1(b) clearly shows that the │1/χ0│ value linearly decreases with the logarithm of the external magnetic field value in the H < H*C range. This indicates, as is understandable, that the field suppresses antiferromagnetic
SUPPLEMENTARY INFORMATION
relationship of │1/χ0│= 86.225 Ð 12.5 log (µ0H). At the quantum critical point, T→ 0 K, where χ0
→∞, │1/χ0│→ 0, we obtain the quantum critical field, H
*
C ≈ 1.4 T. The two inset figures in Fig.
1(b) show the determination of the 1/χ0 value at H < H*C (left inset) and at H > H*C (right inset),
respectively.
Moreover, we noted that the shape of the curves is similar to what appears for the spin disordered triangular lattice in NiGa2S4 38, where the liquid-like state is stabilised by geometrical
frustration in this system. In our system, clear crossover behaviour is seen for the log (χ) versus log (T) curves, which are characterized by inflection points 39 (blue arrows shown in inset of Fig. S2(b)), where the points are denoted as T*. It is clear from the figure that T* increases with increasing field H, and when T > T*, the χ - T curves are well fitted by the Curie-Weiss (CW) rule Ð the system is strictly a CW paramagnet: χ∝ 1/T; when T < T*, the relationship is χ∝ − log (T). The boundary position line at different external fields can be obtained from the crossover transition points in Fig. S2(b). Another point, denoted as TC*, shown in Fig. S2(b), is the crossover point of
log (χ ) ≈ constant A with the CW straight line, and it shows that the value of A only depends on the external field. The 1/χ−T curves, as shown in Fig. 2(a), show the characteristic more clearly. In the low temperature range, at the upturn point, the temperature increases with increasing field. The inset of Fig. 1(a) shows the 1/χ−T curve under 135 kOe field, indicating that at extremely low temperature, the curve shows another more significant upturn: this point is the spin-flip temperature that we have denoted as TSF, which will be discussed later. In order to clearly pick out the critical
point temperature, we replotted the curves as δ(1/χ)/δT −T curves, as shown in Fig. 1(b). We denoted the peak point as TAS, as it is the temperature where the spin state becomes aligned under
external field. For example, TAS =15.4 K and TSF = 3.6 K under field of 135 kOe, as shown in Fig.
SUPPLEMENTARY INFORMATION
this system is similar to the dimensional reduction system of Cs2CuCl4, with a spin -1/2
antiferromagnet on a moderately anisotropic triangular lattice and intermediate frustration (f = 8) ordering into a spiral at TN = 0.6 K 40-42. Although the interchain exchange coupling is weaker, an
order of magnitude smaller than for this similar Ga(OH)3 system, the quantum magnetism is
extremely sensitive to the interchain exchange coupling at low temperature 43. So, we can consider this system as consisting of quasi-one-dimensional intermediate frustrated spin 7/2 antiferromagnetic chains. Moreover, the system emerges from the spin-liquid-like state only at infinite range (as shown in Fig. S2(e) and S(g)), which indicates that other interactions can not be neglected and that where Eq. (2) is too simple to interpret the system, Eq. (1) should be used.
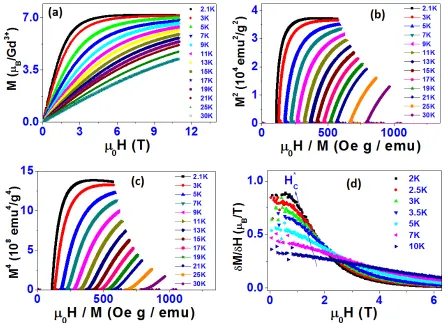
In order to cross-check the exotic paramagnetic phases and their transitions, a series of isothermal M Ð H curves (as shown in Fig. S3(a)) has been collected, and they show a change in curvature from the more linear shape at high temperatures to more bent shapes at lower temperatures (meaning ferromagnetic-like (FM-like) behaviour, but still in the paramagnetic (PM) state) when the temperature is lower than 25 K, which indirectly supports the existence of the local spin fluctuations. Fig. S3(a) shows the FM-like state, but the Arrott plots of the M Ð H curves (as shown in Fig. S3(b)) donÕt show the classical magnetic phase transition characteristic, e.g., the Arrott plot should show a linear relationship at the transition temperature, but in fact, it shows a convex curvature against H/M in the low temperature range. To the best of our knowledge, the convex curvature of M2 against H/M has so far been reproduced only by TakahashiÕs spin-fluctuation theory44, 45. Moreover, we plotted the isothermal magnetization curves in the modified Arrott plot form of M 4 vs. H/M, as shown in Fig. S3(c). Here, the M 4 shows an almost linear relationship to H/M around the temperature range of 10 to 25 K, which confirms the above mentioned spin fluctuation range shown in Fig. S2(c-g). According to TakahashiÕs theory, in the case where the coefficient of M 4 in the Landau expansion of the free energy is zero, M 4becomes linear against H/M. Thus, complete linearity is only obtained under delicate conditions. The system appears to be very near those conditions. We note that the maximum value of the moment at the temperature of 2.1 K reaches Mmax = 7.14 µΒ/Gd
3+
, and this value is close to the theoretical value of Gd3+, where almost every single spin is aligned at high field and the system seems to have fallen into the aligned spin state (FM-like). The aligned spin in a high energy state is not stable, and with increasing field, the system would be transformed into other states with lower energy. One of the most likely types of behavior is the formation of a resonating-valence-bond (RVB) state 46, 47 by spin flipping. We also note that the spin flipping leads to the emergence of E8 symmetry in the
CoNb2O6 Ising chain 48. We have observed this striking phenomenon in the high field range in this
quasi-1D spin chain system.
In order achieve a more detailed understanding of the low temperature and high field spin state, we differentiated the M Ð H curves and have plotted them in Fig. S3(c). At low field, where
δ(M)/δH ≈ constant, the system is in the paramagnetic state; in the middle field range, the system makes a transition from the paramagnetic state to short range spin order or a spin liquid, and then to a highly ordered aligned spin state in a continuous process with increasing field. It is also interesting to note that there is a crossover point at a field of about 1.4 T for the δM/δH −H curves at the indicated temperature, which we have denoted as HC* = 1.4 T. More detailed M Ð H curves at
SUPPLEMENTARY INFORMATION
view of the low field region, and the right inset shows a magnified view of the high field region. The low field M Ð H curves are linearly increasing with the field, but there are complex relationships (an emerging spin liquid and aligned spin state) in the middle field area. It is interesting to note that the M Ð H curves reach a peak of maximum moment and then linearly decrease with increasing field. This is actually due to the field induced spin flip state. We have denoted the field as HSF at indicated temperatures TSF, as shown in the lower right inset of Fig. 2(a),
and we thus obtain a HSF-TSF boundary line for the phase diagram. Fitting the straight line parts of
the M Ð H curves at low field (upper left inset of Fig. 2(a)) and high field (lower right inset of Fig. 2(a)), the slopes are the spin susceptibilities (χM = δM/δH) at different temperatures. As for the emerging spin flip field (HSF) at the indicated temperatures, the results at indicated temperatures T
and field HSF are plotted in Fig. 2(b). Fitting the low field χM Ð T lines and the high field χM Ð T and χM Ð HSF lines, as shown in Fig. 2(b), equations are obtained for both the low and high field ranges
with
χM = 13.1 Ð T 0.7 (10-3 emu/g Oe) (low field range) (3)
χM = Ð 2.8 + T 4.5 (10-5 emu/g Oe) (high field range) (4) and χM = Ð 2.8 + 5×10⁻⁷ × ( µ0H) 7.1 (10-5 emu/g Oe) (spin-flipping field) (5).
The low field χM values are positive, and χM vs. T appears to have an almost linear relationship. The high field χM values are negative, and χM vs. T shows a complex relationship (∝ T4.5). These features are very similar to those that appear in the superconducting state, and we emphasize that this RVB state may be the superconducting state. From Eq. (4), the superconducting critical temperature can be obtained as: χM → 0, TCSC ≈ 3.8 K, and similarly, it can be obtained that the
critical field of the emerging superconducting state is HCSC≈ 8.92 T. We noted that a similar
non-conventional superconducting state was discovered in CeCoIn5 heavy-Fermion alloy 49, 50. It is
seems that pairs of two aligned individual spins form RVB singlets as antiparallel-spin Cooper pairs and that this unconventional superconducting state is magnetically mediated superconductivity 51-53. Another possible explanation is that the create local antiferromagnetism due to spin flipping at low temperature and high field rang, research into these phenomena is ongoing.
SUPPLEMENTARY INFORMATION
required for demonstrating the classical and quantum phases, especially the spin-liquid character of this material.
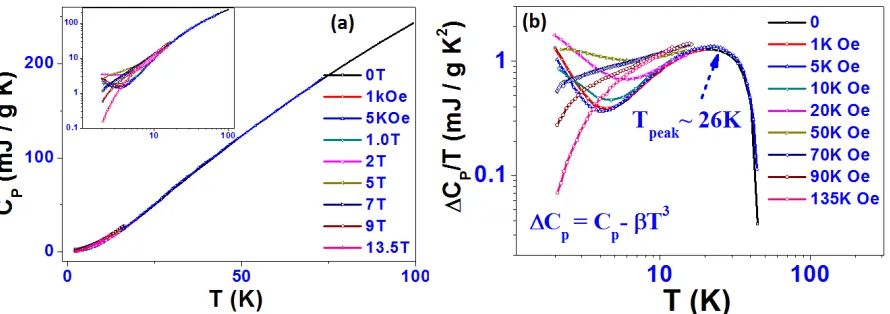
The temperature dependence of the heat capacities of single crystal Gd(OH)3 nanowires
under fields from 0 to 13.5 T are shown in Figure S4(a). The heat capacities, CP, are plotted on a
logarithmic scale against temperature. The CP show a slight upturn when the temperature is lower
than 4 K for H = 0 T, and this is only 1.5 K lower than the value reported in Ref. [29] for single crystal data, which indicated that the NŽel ordering temperature should be lower than TN ≤ 0.94 K.
The figure also shows that heat capacities have slightly upturned shapes for H < 2 T curves, but no sharp peak structure for the H ≥ 2 T curves. These results again indicate absence of long-range ordering over the entire measured temperature range for H ≥ 2 T. We note that the heat capacity for the H = 2 T curve remains constant when the temperature T < 5 K. This may due to the coexistence of both a weak antiferromagnetic (AFM) phase and a quantum phase at this energy scale, which falls into the classical-quantum crossover regime, as discussed for the above susceptibility measurements. The absence of thermal anomalies when the system is under field H ≥ 2 T is consistent with the above magnetic susceptibility measurements. To elucidate the detailed characteristics of low-energy excitations from the ground state, data in the low-temperature region are plotted as CP / T vs. T 2 in Figure 3(a). Fitting the 0T data between 6 and 10 K, using the
formula
CP / T = γ+ βT 2 (5)
yields coefficients γ = 51.52 mJ K− 2 mol− 1 and β = 1.51 mJ K− 4 mol− 1. The finite electronic heat capacity coefficient γ in this weakly frustrated quasi-1D S = 7/2 spin system suggests that gapless excitations occur from a local liquid-like ground state, similar to the case of κ -(BEDT-TTF)2Cu2(CN)3 55. As Figure 3(b) shows, γ is not seriously affected by magnetic fields within the
finite temperature range where CP is linear with temperature up to 13.5 T. This excludes the
possibility that paramagnetic impurity spins are the origin of the γ term. The measurement was also performed on over 10 mg of single crystal nanowires, and thus, the large heat capacity at low temperatures is attributable to the intrinsic properties of this material.
As weak spin frustration combined with strong fluctuation spin systems may give rise to unexpected phase changes in the low energy region due to various kinds of many-body effects, such as in the hyperkagome system Gd3Ga5O12, where the system appeared to have a field-induced
transition from a spin-liquid phase to an antiferromagnetic phase 56. For our system, it is obvious that the AFM phase is suppressed by field due to the increase in the frustration effects and enhancement of the fluctuation. However, the spin and the threshold field in that case are similar to those in the system studied here, suggesting that the physics here has a similar character. Moreover, Figure S4(a), Fig. 3(a), and Figure S4(b) shows a linear extrapolation of the data in the finite temperature range and then gives a vanishing γ term in the heat capacity. Firstly, we analyse the linear extrapolation temperature range, which demonstrates that the T-linear contribution is observed only in the spin-liquid state. In heavy-electron systems produced by strong correlations of f-electrons in Ce and U compounds, anomalous divergence of CP /T, expressed by the − Log T term,
SUPPLEMENTARY INFORMATION
suppressed to TN = 0 and an anomalous Fermi liquid phase appears. A similar kind of criticality
might be expected in the critical region of a spin-liquid phase. In the case of this Gd(OH)3 system,
the low-temperature spin liquid state is realized below a crossover temperature of 20 K and H > 2 T, at which the heat capacity appears as a broad hump structure. As shown in Fig. 3(a) and Figure S4(b), a broad hump structure is observed in the Cp/T2 vs. T 2 curve. Deviations of the experimental data of CP from βT3 are determined using the formula:
ΔCP = CP− βT3, (6)
and ΔCP/T values of these compounds are plotted as a function of temperature in Figure S4(b). The
data clearly reveal the broad hump structure at peak temperature Tpeak = 26 K. The magnitude of the
ΔCP/T peak is about 262.4 mJ /K /mol. As the lattice heat capacities are expressed by the simple
bT3 term around the hump temperature, the ΔCP/T peak reflects the magnetic heat capacity in this
compound. Similar methods have been used in single crystal heat capacity analysis 29 and have shown that this method more accurately estimates the lattice heat capacity in this compound. The hump temperature is consistent with the above susceptibility measurements, as it corresponds to the temperature of the spin fluctuation. Fig. 3(b) also reveals that the hump structure may be enhanced with magnetic field as it increases to 13.5 T.
The gapless or continuum gapped excitations observed in the heat capacity measurements can be discussed qualitatively by assuming finite density of states in spin excitations. The temperature dependence of the magnetic susceptibility has a broad peak around 26 K, which corresponds to strong fluctuation and a weakly frustrated spin chain lattice. Wilson’s ratio has proved to be useful in characterising strongly correlated Fermi liquids. In a Fermi liquid, the low‐temperature electronic specific heat CP is linear with temperature, with a slope γ. The magnetic
susceptibility (T), is independent of temperature for low temperatures. Wilson’s ratio (also known as the Sommerfeld ratio) is defined as the dimensionless quantity:
RW !4 2kB2 (0)!/ 3(gµB)2 ! ! ! ! ! !
(7)
where g is the gyromagnetic ratio in the absence of interactions and B is the Bohr
magneton. For a non‐interacting Fermi gas, RW = 1. In terms of Landau’s Fermi liquid parameters, RW = 1/(1+F0
a
). Wilson showed that for the Kondo model, the impurity contributions to (0) and γ give a universal value of RW= 2, independent of the strength of the interactions 58, 59. From the analysis of inverse magnetic susceptibility, extrapolating the temperature dependence of the spin susceptibility down to T = 0 gives a residual magnetic susceptibility of χ(0) in the H ≥ 2 T quantum regime or within the present spin-liquid temperature range. The χ(0) values are calculated from the above data on 1/χ(0). Using the γ value determined from the heat capacity in the linear Ð T range under different fields (H ≥ 2T) in Fig. 3(a), the Wilson ratio, RW , is evaluated to be 1.12, 1.05, 1.5, 2.1, and 2.16 for field of 2, 5, 7, 9, and 13.5 T,
respectively, as shown in Fig. 3(b). RW has very similar values (~1) under fields from 2 T to 5 T, but
SUPPLEMENTARY INFORMATION
Wilson ratio on the order of unity is typical for a Fermi liquid with nearly free electrons, however, it shows that the magnetic field hardens electron spin, and reductions in temperature have the same effects as well. With decreasing temperature and increasing field, the increasing spin hardness or stiffness (for aligning spin) may enhance the spin interaction (dipolar interaction) from which spin flipping subsequently emerges, or spin hardening may increase the spin frequency, giving rise to the resonating-valence-bond state. These discussions are consistent with the susceptibility the inset of Fig. 1(a) and Fig. S3(d)), thermal magnetization (Fig. 2(b)) measurements, and moreover here, the heat capacity. As shown in Fig 3(a) and (b), there are inflexion points in the Cp /T – T2 curve (Fig.
S4(b)) or more clearly in the Cp / T2Ð T curve (Fig. 3(b)), and we have denoted them as TSFHC. They
are the points of emerging spin flipping and/or resonating-valence-bond behavior. The inflexion points TSFHC are consistent with the above TC* and TSF determined from susceptibility and
magnetisation measurements, which will be discussed later.
All the phenomena discussed above may have benefits in terms of the magnetocaloric effect because they makes the spins in the system easier to align under external magnetic field, and especially in the spin liquid regime, the low lying energy and even gapless spectrum creates a high entropy ground state, while at the same time, the system can be easily put into a lowered entropy or lowered energy state and then may gain large entropy changes under external field, and this, plus the large spin potential (S = 7/2) of the Gd3+
ions, may achieve very high MCE. Consequently we conducted a series of magnetic measurements and analysis the magnetocaloric effect properties in the Gd(OH)3 nanowire system. Based on the local magnetic moment model, the greatest possible
magnetic entropychange for the material would be (from the classical model):
ΔSM = R ln(2S+1) ≈ 34.5 J / mol K, (8)
or in the quantum approach,
ΔSM = N kB ln(2J+1) ≈ 166 J / kg K, (9)
where R is the gas constant, S is the total spin angular momentum, N is the number of spins, J the quantum number of the spin, and kB the Boltzmann constant, which indicates that the system
may achieve a large MCE in the low temperature range.
The magnetic entropy change ∆SM was evaluated from the calculated isothermal magnetic
entropy change ∆SM(T, H) from the isothermal magnetization curves in the measured temperature
range, according to Equation (10) below.
(
)
dH T H P T M H P T S HH H p
p H
M
∫
∂ ∂ = Δ Δ 2 1 , , , , ) , , ( (10)
We now re-examine the data from the above isothermal magnetization curves of the Gd(OH)3
nanowires, as shown in Fig. 3(a), which are plotted as a function of the applied magnetic field (ranging from µ0H= 0 to 11 T) in the temperature range between 2.2 and 30 K. Under high
magnetic field values (up to 11 T), the variation of the isothermal magnetisation (over the whole temperature range) becomes gradual, with a saturation being observed. We note that the peak magnetic moment reaches as high as 7.12 µB / Gd3+ emu/g at 2.1 K and under field of 8.42 T,
SUPPLEMENTARY INFORMATION
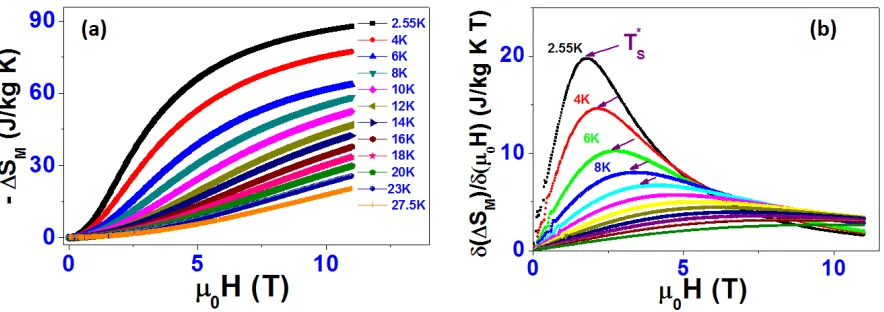
According to Equation (10), the magnetic entropy changes (−ΔSM) can be calculated as a
function of temperature for magnetic field changes from 0 Ð 1 to 0 Ð 11 T, and the −ΔSM results are
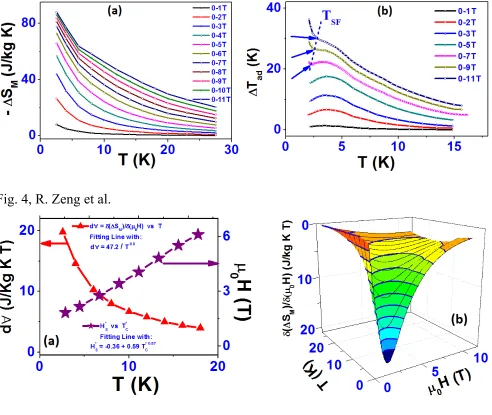
displayed in Fig. 4(a). The curves present a characteristic shape with no peak over the entire temperature range, indicating that there is no transition or no long range ordering of the Gd moments either, and the −ΔSM appears to have no maximum and simply shows a linear increase
with decreasing temperature. The maximum magnitude of −ΔSM over the studied temperature range
increases with increasing magnetic field change up to 27.8 J /kg K, 66 J / kg K, and 88 J / kg K at 2.55 K for field changes of 2 T, 5T, and 11 T, respectively. The magnetisation hysteresis loop at 2.1 K (not shown here) indicates that there is no hysteresis loss and also indicates fully reversible behaviour.
Employing the above heat capacity data (Fig. S4(a)) under external field from 0 to 13.5 T and in the temperature range from 2 to 15 K, we can calculate the adiabatic temperature change
∆Tad (T, H) under external magnetic field change ΔH and at the temperature T0 according to
Equation (11) below:
(
T P H)
C H P T S T H P T T P p H M p H ad , , ) , , ( ) , , ( 0 , 0 , 0 Δ Δ Δ ≅ Δ (11).
Since the heat capacity strongly depends on the external magnetic field, especially in the low temperature range 60, in order to relatively precisely calculate ∆Tad(T, H), we re-calculated the ΔSM(T, ΔH) (ΔH = 0 to 1, 1 to 2, áááá, 10 to 11 T) for every one Tesla magnetic field change, and the
results are shown in Fig. S5(a). We then calculated the ∆Tad(T, ΔH) according to Eq. (11) using the
measured CP data under relatively different external fields (as shown in Fig. S4(a)), and the results
for ∆Tad(T, ΔH) are shown in Fig. S5(b). Finally, we can obtain the ∆Tad(T, H) data under external
field change of 0 to H, as shown in Fig. 4(b). The maximum adiabatic temperature change (ΔTad) =
6.7, 17.6, and 36.4 K at 2.55 K for field changes of 2, 5, and 11 T, respectively. It is also interesting to note that the spin-flipping will generate a very large additional magnetocaloric effect in the system, as shown in Fig. 4(b). Moreover, the Gd(OH)3 nanowires show extremely high ΔTad, which
satisfies one of the important criteria for selecting magnetic refrigerants, a large adiabatic temperature change.
The values of −ΔSM obtained in the Gd(OH)3 system are extremely large, with no magnetic/heat
hysteresis, and are fully reversible. −ΔSM is higher than in any reported reversible MCE
magnetocaloric material (excluding the colossal or giant MCE materials with large hysteresis, as these materials normally exhibit confirmed maximum values of < 30 J/ kg K under a field change of 0 Ð 5 T at the ordering temperature). In comparison with the paramagnetic salts or nanosized garnets
21, 22
, and well-designed molecular nanomagnets 20, 21 for ultra-low temperature application, which exhibit second order or first order paramagnetic to ferromagnetic (or antiferromagnetic) phase transitions at a few degrees Kelvin, the ΔSM of the present material is 3 times higher than for those
materials over the whole temperature range (2 to 20 K). In addition, a recent cytotoxicity investigation 61 has indicated that there are no cytotoxic effects from gadolinium hydroxide nanorods. These properties make Gd(OH)3 nanorods a promising candidate as a refrigerant at
SUPPLEMENTARY INFORMATION
Re-analyzing the magnetic entropy change (ΔSM) data by differentiating ΔSM with magnetic
field, we obtained the δ(ΔSM) /δ(µ0Η) values as functions of magnetic field at different temperatures. We define the δ(ΔSM) /δ(µ0Η) value as Òd∀Ó − the systemÕs ability to support change in the magnetic entropy under finite environmental conditions (field and temperature):
d∀ = δ(ΔSM) /δ(µ0Η) (12).
Magnetic entropy (SM) represents the degree of spin order in the spin system, while the magnetic
entropy change (ΔSM) represents the degree of change in spin order, so that d∀ represents the
change in the velocity and strength of spin order changes under finite magnetic field changes.
Fig. S6(a) shows the magnetic entropy changes −ΔSM at fields from 0 T to 11 T as a function
of field for temperatures from 2.55 to 27.5 K. Differentiating the curves in Fig. S6(a), we can obtain d∀ values at definite temperatures. Fig. S6(b) shows the d∀ values at fields from 0 T to 11 T as a function of field for temperatures from 2.55 to 27.5K. The maximum value of d∀ at a definite temperature (Ts*) and field (HC*) can be determined, as such values appear at critical points and
under boundary conditions. In fact, maximum d∀ appears at the saturation field 62of aligned spins near the saturated moment and the crossover points of the spins from classical to quantum behavior
63
. Fig. 5(a) shows the points of maximum value of d∀ as a function of temperature (red triangle symbol line) and the boundary line (purple star symbol line) of aligned spins near the saturated moment temperature (Ts*) and critical field (HC*) where the maximum value of d∀ emerges. By
fitting the two lines, the result can be obtained:
d∀ = 47.2 × T −0.8
(13)
for the red triangle symbol line, and
HC* =1.3603 Ð 0.31 × Ts*0.87
(14)
From Eqs. (13) and (14), it can be seen that the d∀ →∞ and HC* ≈ 1.36 T when the temperature T → 0 K. We thus obtain the quantum critical point HQC≈ 1.36 T, which is very consistent with above
determined 1.4 T. At the quantum critical point, d∀ → ∞, and this means that the system will generate enormous entropy changes when there is a small variation in the external field, according to Eq. (12), e.g., d∀ ∝ Veff, δ(ΔSM)∝ Meff, andδ(µ0Η)∝Εeff. Veff , Meff,andΕeff are the electron (spin) systemÕs effective velocity, effective mass, and effective energy, respectively. The system will generate enormous velocity and strength in its variation of change in the degree of spin order when there are small changes in energy. Following EinsteinÕs formula, E = M×C2, here it may need modify that the d∀ ∝ Veff2, when the system effective mass Meff → ∞, we seem to be observing
SUPPLEMENTARY INFORMATION
T to 11 T) and temperature T (from 2.55 to 27.5 K). The shape of the 3D d∀ plot in Fig. 5(b) is the cross-section at 2.55 K of the Òblack-holeÓ. It will be closed at T = 0 K and it is a line when d∀ → ∞ at the QCP. We note that some experiments have observed Òzero pointÓ entropy 64-66, as they show a macroscopic entropy at zero temperature. It has been predicted by anti de Sitter conformal field theory (AdS-CFT) that the black hole would be unstable and would eventually suck up ÒstuffÓ from its surroundings, covering its horizon with ÒhairÓ 5, 67. In the electron spin system, out of the spin liquid state and at a quite low temperature, some unexpected order will set in that removes the ground-state entropy, giving it a unique ground state. Our experimental observations indicated that the spin-flip / fractional RVB / fractional superconducting-like state gives rise to a unique ground-state under ultra-cooled and high field conditions. Moreover, we may observe the above-mentioned Òblack holeÓ at the quantum critical point with d∀ →∞, for this understanding of the Òblack holeÓ is that when there is a small amount energy change (here, e.g., δ(µ0Η) = small value), the system will generate enormous entropy change, and this will cause the system to suck up huge energy from its surroundings.
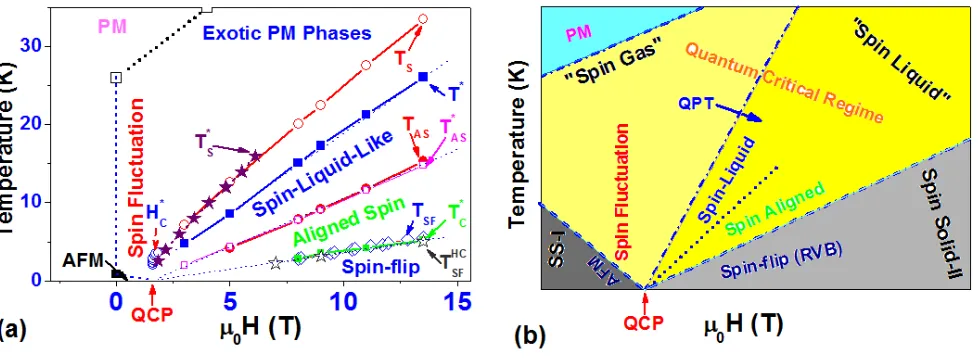
Following the above cross-checking of the magnetic measurements and analysis, we can plot a phase diagram, as shown in Fig. 6(a). The spin state boundary lines are determined from reference29 and from the above thermodynamic susceptibility, heat capacity, magnetization, and magnetocaloric measurements and analysis. The AFM line only connects TN (the solid black square point) from Ref.
[22] and the quantum critical point. The QCP was determined by analyzing susceptibility data Hc*
in Fig. 1(a) and the magnetization data H* in Fig. S3(d). The red open circle line was determined by analyzing the susceptibility data TS in Fig. S2(e), and the purple solid star line was determined by
analyzing the susceptibility data TS in Fig. S2(e). The solid blue square symbol line T* was
determined from Fig. S2(b). The solid red circle line TASand the open pink square line TAS*were
determined from Fig. S2(c) and S2(e). The solid green square line TC* is from the inset of Fig.
S2(b), the open blue diamond TSF line was determined from analyzing the magnetization curves of
Fig. 2(a), and the open dark green star line is from Fig. 3(a). The above phase boundary lines were determined by different measurements, but they are very consistent with each other, which indicates that the methods we used confirm each other. Analyzing this phase diagram, we obtained the image of the electron spin interaction that is plotted in Fig. 6(b).
SUPPLEMENTARY INFORMATION
with enhancement of the strength of correlation of the spins. With H increasing and T cooling down, aligned spins in a high energy state are not stable, and Òspin-flipÓ behavior emerges in the system, forming an RVB or even a superconducting-like state. We visualize the randomly ordered (or free direction) large spins (S = 7/2) with strong fluctuations as the ÒSpin GasÓ region (light yellow), similar to the Fermi-gas regime. We visualize the state with short range ordered spins and aligned spins, but obviously not long-range ordered state, as the ÒSpin LiquidÓ region (yellow). We visualize the spontaneously ordered AFM state as the ÒSpin Solid IÓ (SS-I shown in figure) region (grey). We visualize the spin-flip or RVB ordered state as the ÒSpin Solid IIÓ region (light grey). It is easy to see that the QCP separates the two solid spin states.
To summarize, high purity and highly uniform single crystal Gd(OH)3 nanowires were
synthesized by a facile hydrothermal method, and microstructural features were characterized by XRD, SEM, TEM, and HRTEM. Systematic magnetic susceptibility, magnetization, and heat capacity measurements, along with magnetocaloric analysis in magnetic fields up to 13.5 Tesla and temperatures down to 2 K indicated that, (1) the system presents strong fluctuation in its weak frustration and weakly antiferromagnetic nearest-neighbor quasi-1D chains; (2) the magnetic field enhances the thermal and local spin fluctuations, which suppress the long-range spin ordering (LRO), and LRO is not present within the measured temperature range in this system; (3) however, we observed possible field-induced, exotic spin-liquid-like, aligned-spin, and spin-flip states, exotic paramagnetic phases, and transitions in the low temperature and high field range, and determined the likely quantum critical point and quantum phase diagram; (4) we observed extremely large, fully reversible MCE (magnetic entropy change (-ΔSM)= 27.8, 66 and 88 J / kg K, adiabatic temperature
change (ΔTad) = 6.7, 17.6 ,and 36.4 K at 2.55 K for field changes of 2, 5, and 11 T, respectively, in
this continuous range of quantum phase transitions in this system; (5) moreover, careful experiments and analysis may determine the quantum critical point (QCP) of this system; (6) analyzing the magnetocaloric effects close to the QCP, we get very large d∀ = δ(ΔSM)
/δ(µ0Η) values, e.g. d∀ →∞ at the QCP, so it is possible to obtain large MCE and even exceed the theoretical value of MCE in the QCP system; (7) moreover, d∀ → ∞ at the QCP indicates the existence of a Òblack holeÓ; (8) at high field, the spins show a spin-flipping phenomenon and may form resonating-valence-bond (RVB) singlets, and the magnetization and magnetocaloric effect measurements indicated that at this point, the emergence of RVB led to the observation of superconducting-like susceptibility behavior in this system.
The magnetic-entropy change monotonically increases with decreasing temperature, and this system exceeds the strength of the magnetocaloric effect (MCE) by 2 to 3 times in any other known low temperature reversible MCE material. The extremely large magnetic entropy change may be attributed to the large amount of weakly interacting spins that can be easily aligned in the low lying energy quantum critical regime and close to the QCP in our nanosized materials, since there is large MCE in the spin-liquid-like (low energy excitation and even gapless state) range. These indicate that the material is a promising MCE candidate for low temperature application, and possibly could make ultra-low temperatures easily achievable for most laboratories and for space application as well.
SUPPLEMENTARY INFORMATION
A single crystalline nanowire sample of Gd(OH)3 was prepared by a facile hydrothermal method. The starting
reagents, GdCl3 (99.99%) and ammonia hydroxide (28-30%) solution, were purchased from Sigma-Aldrich. 0.6 g GdCl3
was dissolved in 20 ml double-distilled water. Diluted NaOH solution was then added into the solution, and the pH was maintained at 9-10. The mixture was placed in a Teflon-lined autoclave and then heated up to 150 ¡C. This temperature was maintained for 24 h. The as-prepared sample was centrifuged and washed with distilled water 5 times, and then dried in vacuum oven at 50 ¡C. The x-ray diffraction (XRD) pattern was collected to confirm the crystallization on a GBC MMA diffractometer with Cu Kα radiation. The morphologies were characterized by using scanning electron microscopy (SEM, JEOL JSM-6460A) and transmission electron microscopy (TEM, JEOL 2010). The magnetization (M) and heat capacity (CP) were measured under applied magnetic field of 0 Ð 13.5 Tesla (T), using the vibrating sample
magnetometer (VSM) option of a Quantum Design 14 T Physical Property Measurement System (PPMS) in the temperature range of 2 Ð 300 K.
References
1. Sachdev, S., Quantum Phase Transitions, Cambridge Univ. Press, New York, (1999).
2. Greiner, M., Mandel, O., et al., Quantum phase transition from a superfluid to a Mott insulator in a gas of ultracold atoms, Nature 415, 396 (2002).
3. Coleman, P., Schofield, A. J., Quantum criticality, Nature 433, 226 (2005).
4. Sachdev, S., Quantum Criticality: Competing Ground States in Low Dimensions,Science 288, 475 (2000).
5. Cubrovic, M., Zaanen, J., Schalm, K., String Theory, Quantum Phase Transitions, and the Emergent Fermi Liquid, Science 325, 439 (2009).
6. Pfleiderer, C., McMullan, G. J., Julian, S. R., and Lonzarich, G. G., Magnetic quantum phase transition in MnSi under hydrostatic pressure,Phys. Rev. B 55, 8830 (1997).
7. Bollinger, A. T., Dubuis, G., Yoon, J., et al., SuperconductorÐinsulator transition in La2-xSrxCuO4 at the pair
quantum resistance, Nature 472, 459 (2011).
8. Zhu, L., Garst, M., Rosch, A., Si, Q. M., Divergence of the Gruneisen ratio at quantum critical points in heavy fermion metals, Phys. Rev. Letter 91, 066404(2003).
9. Pecharsky, V. K., Gschneidner, Jr., K. A., Giant magnetocaloric effect in Gd-5(Si2Ge2), Phys. Rev. Lett.78,
4494 (1997).
10. Tegus, O., BrŸck, E. J., Buschow, K. H., and de Boer, F. R. Transition-metal-based magnetic refrigerants for room-temperature applications, Nature415, 150 (2002).
11. Wada H., Tanabe, Y. Giant magnetocaloric effect of MnAs1-xSbx, Appl. Phys. Lett. 79, 3302 (2001).
12. Hu, F. X., Shen, B. G., et al. Influence of negative lattice expansion and metamagnetic transition on magnetic entropy change in the compound LaFe11.4Si1.6, Appl. Phys. Lett. 78, 3675 (2001).
13. Provenzano, V., Shapiro, A. J., and Shull, R. D., Reduction of hysteresis losses in the magnetic refrigerant Gd5Ge2Si2 by the addition of iron, Nature429, 6994 (2004).
14. Krenke, T., Duman, E.,et al., Inverse magnetocaloric effect in ferromagnetic Ni-Mn-Sn alloys, Nature Materials, 4, 450 (2005).
15. de Campos, A., Rocco, D. L., et al., Ambient pressure colossal magnetocaloric effect tuned by composition in Mn1-xFexAs, Nature Mater.5, 802 (2006).
16. Hagmann, C., Benford, D. J., Richards, P. L., Paramagnetic salt pill design for magnetic refrigerators used in-space applications, Cryogenics 34, 213 (1994).
17. Kushino, A., Aoki, Y., et al., Erbium-doped yttrium aluminum garnet as a magnetic refrigerant for low temperature x-ray detectors, J. Appl. Phys. 90, 5812 (2001).
18. Barclay J. A., Steyert, W. A., Materials for magnetic refrigeration between 2 K and 20 K, Cryogenics22, 73 (1982).
19. Sessoli, R., Gatteschi, D., et al., Magnetic bistability in a metal-ion cluster, Nature 365, 141-143 (1993).
20. McMichael, R. D., Ritter, J. J., Shull, R. D., Enhanced magnetocaloric effect in Gd3Ga5-xFexO12, J. Appl. Phys.
73, 6946 (1993).
SUPPLEMENTARY INFORMATION
22. Phan, M. H., Morales, M. B., et al., J. Phys. D: Appl. Phys.42, 115007 (2009).
23. Zhang, X. X., Wei, H. L., et al., Anisotropic magnetocaloric effect in nanostructured magnetic clusters, Phys. Rev. Lett. 87, 157203 (2001).
24. Evangelisti, M., Candini, A., et al., Spin-enhanced magnetocaloric effect in molecular nanomagnets, Appl. Phys. Lett. 87, 072504 (2005).
25. Manoli, M., Johnstone, R. D. L., et al., A ferromagnetic mixed-valent Mn supertetrahedron: Towards low-temperature magnetic refrigeration with molecular clusters, Angew. Chem., Int. Ed.46, 4556 (2007).
26. Manoli, M., Collins, A., et al., Mixed-valent Mn supertetrahedra and planar discs as enhanced magnetic coolers, J. Am. Chem. Soc.130, 11129 (2008).
27. Karosis, G., Evanelisit, M., et al., A Calix[4]arene 3d/4f Magnetic Cooler, Angew. Chem., Int. Ed.48, 9928 (2009).
28. Zhitomirsky, M. E. Enhanced magnetocaloric effect in frustrated magnets, Phys. Rev. B67, 104421 (2003).
29. Skjeltrop, A. T., Catanese, C. A., Meissner, H. E., Wolf, W. P., Magnetic and thermal properties of Gd(OH)3,
Phys. Rev. B7, 2062 (1973).
30. Wolf, W. P., Meissner, H. E., Catanese, C. A., Magnetic properties of rare earth hydroxides, J. Appl. Phys. 39, 1134 (1968).
31. Cochane, R. W., Wolf, W.P., Gd3+-Gd3+ Exchange coupling in ionic rare earth insulators, Solid State Commun.
9, 1997(1971).
32. Moon R. M., Koehler, W. C., Magnetic properties of Gd2O3, Phys. Rev. B11, 1609 (1975).
33. Werlang, T., Trippe, C., et al., Quantum Correlations in Spin Chains at Finite Temperatures and Quantum Phase Transitions, Phys. Rev. Lett.105, 095702 (2010).
34. Ramirez, A. P., Thermodynamic measurements on geometrically frustrated magnets, J. Appl. Phys. 70, 5952(1991)
35. Chandra, P., Doucot, B., Possible spin-liquid state at large S for the frustrated square Heisenberg lattice, Phys. Rev. B38, 9335 (1988).
36. Balents, L., Spin liquids in frustrated magnets, Nature,464, 199 (2010).
37. Sokolov, D. A., Aronson, M. C., Gannon, W., Fisk, Z., Critical Phenomena and the Quantum Critical Point of Ferromagnetic Zr1-xNbxZn2, Phys. Rev. Lett. 96, 116404 (2006).
38. Nakatsuji, S., Nambu, Y., Tonomura, H., Sakai, O., Jonas, S., Broholm, C., Tsunetsugu, H., Qiu, Y., Maeno, Y., Spin disorder on a triangular lattice, Science 309, 1697 (2005).
39. Custers, J., Gegenwart, P., Geibel, C., Steglich, F., Coleman, P., Paschen, S., Phys. Rev. Lett. 104, 186402 (2010).
40. Lake, B., Tennant, D. A., Frost, C. D., Nagler, S. E., Quantum criticality and universal scaling of a quantum antiferromagnet, Nature Mater. 4, 329-334 (2005).
41. Kohno, M., Starykh, O. A., Balents, L. Spinon and triplons in spatially anisotropic frustrated antiferromagnets, Nature Phys. 3, 790-795 (2007).
42. Bocquet, M., Essler, F. H. L., Tsvelik, A. M., Gogolin, A. O. Finite-temperature dynamical magnetic susceptibility of quasi-one-dimensional frustrated spin-1/2 Heisenberg antiferromagnets, Phys. Rev. B 64, 094425 (2001).
43. Starykh, O. A. Katsura, H., Balents, L., Extreme sensitivity of a frustrated quantum magnet: Cs2CuCl4, Phys.
Rev. B 64, 014421 (2010).
44. Moriya, T. Spin Fluctuations in Itinerant Electron Magnetism (Springer-Verlag, Berlin, 1985).
45. Lonzarich, G. G. The magnetic equation of state and heat-capacity in weak itinerant ferromagnets, J. Magn. Magn. Mater. 54Ð57, 612 (1986).
46. Anderson, P. W. The resonating valence bond state in La2CuO4 and superconductivity, Science 235, 1196Ð1198
(1987).
47. Anderson, P. W., Baskaran, G., Zou, Z., Hsu, T. Resonating-valence-bond theory of phase transitions and superconductivity in La2CuO4-based compounds. Phys. Rev. Lett. 58, 2790Ð2793 (1987).
SUPPLEMENTARY INFORMATION
49. Radovan, H. A., Fortune, N. A., et al., Magnetic enhancement of superconductivity from electron spin domains, Nature 425, 51 (2003).
50. Movshovich, R., et al., Unconventional superconductivity in CeIrIn5 and CeCoIn5: Specific heat and thermal
conductivity studies. Phys. Rev. Lett. 86, 5152Ð5155 (2001).
51. Fisk, Z., Pines, D., Superconductivity: The ghost of magnetism, Nature 394, 22 (1998).
52. Monthoux P., Pines, D., Lonzarich, G. G., Superconductivity without phonons, Nature450, 1177 (2007).
53. Monthoux, P., Lonzarich, G. G. Magnetically mediated superconductivity in quasi-two and three dimensions. Phys. Rev. B 63, 054529 (2001).
54. Singh, R. R. P., et al., Dimer order with striped correlations in the J1-J2 Heisenberg model, Phys. Rev. B 60,
7278 (1999).
55. Yamashita, S. et al.,Thermodynamic properties of a spin-1/2 spin-liquid state in a κ-type organic salt. Nat. Phys. 4, 459Ð462 (2008).
56. Schiffer, P., Ramirez, A. P., Huse, D. A., Valentino, A. J., Investigation of the field induced antiferromagnetic phase transition in the frustrated magnet: gadolinium gallium garnet, Phys. Rev. Lett. 73, 2500Ð2503 (1994).
57. Lšhneysen, H. V., et al.,Non-Fermi-liquid behavior in a heavy-Fermion alloy at a magnetic instability. Phys. Rev. Lett. 72, 3262Ð3265 (1994).
58. Vollhardt, D., Normal 3He: an almost localized Fermi liquid, Rev. Mod. Phys. 56, 99 (1984).
59. Wilson, K. G., The renormalization group: Critical phenomena and the Kondo problem, Rev. Mod. Phys. 47, 773 (1975).
60. Tishin, A. M., Spichkin, Y. I., The Magnetocaloric Effect and Its Applications, Institute of Physics, Bristol, 2003.
61. 25 Hemmer, E. Kohl, Y., Colquhoun, V., Thielecke, H., Soga, K., Mathur, S., Probing Cytotoxicity of Gadolinium Hydroxide Nanostructures, J. Phys. Chem. B 114, 4358Ð4365 (2010).
62. Honecker, A., Wessel. S., Magnetocaloric effect in quantum spin-s chains, Cond. Matt. Phys.12, 399 (2009).
63. Parkinson, J. B., Bonner, J. C., Spin chains in a field: Crossover from quantum to classical behavior, Phys. Rev. B32, 4703 (1985).
64. Ramirez, A. P., Hayashi, A., Cava, R. J., et al., Zero-point entropy in Ôspin iceÕ, Nature 399, 333 (1999).
65. Fisk, Z., et al., Thermodynamics of Quantum Critical Points, Science325, 1348 (2009).
66. Rost, A., et al., Entropy Landscape of Phase Formation Associated with Quantum Criticality in Sr3Ru2O7,
Science 325, 1360 (2009).
67. Hartnoll, S. A., Herzog, C. P., Horowitz, G. T., Holographic superconductors, J. High Energy Phys. 12, 015 (2008).
Acknowledgements
SUPPLEMENTARY INFORMATION
Figure Captions
Figure 1 (a) inverse susceptibility (1/χ) −T curves, which are upturned with increasing applied field; the inset is the plot of the 1/χ−T curve with a 13.5 T field applied; (b) field dependence of inverse T→ 0 K susceptibility (1/χ0), with the upper left inset showing 1/χ −T curves for applied field from 200 Oe to 1 T and the lower inset showing 1/χ−T curves for applied field from 2 T to 13.5 T.
Figure 2 (a) detailed magnetisation versus H curves for Gd(OH)3 nanowires at temperatures from
2.1 K to 4.1 K; a magnified view of the low field region is presented in the left inset, and a magnified view of the high field region in the right inset; (b) low field and high field susceptibility determine the slope of the straight line parts of M Ð H curves in the insets to Fig. 3(a), so the fitting lines and equations are presented for both the low and the high field ranges, respectively.
Figure 3 (a) Cp / T vs. T 2 data in the low-temperature region; (b) χ(0) ≈χ0 (T → 0 K), finite
electronic heat capacity coefficient γ, and Wilson ratio RW determined by using low temperature
data from 2.3 K to 15 K (see text) as a function of magnetic field (H > 2 T).
Figure 4 (a) Magnetic entropy change −ΔSM (calculated from isothermal M-H curves) of the
Gd(OH)3 single crystal nanowires at temperatures from 2.3 K to 30 K as a function of temperature
for magnetic field changes from 0 Ð 1 to 0 Ð 11 T; (b) ΔTad at temperatures from 2.3 K to 30 K as a
function of temperature for magnetic field changes from 0 Ð 1 to 0 Ð 11 T.
Figure 5 (a) points of maximum value of δ(ΔSM)/δ(µ0Η) as a function of temperature (red triangle symbol line) and the boundary line (purple star symbol line) of aligned spin near the saturated moment temperature (Ts*) and the critical field (HC*); at the maximum value of δ(ΔSM) /δ(µ0Η),
δ(ΔSM) /δ(µ0Η) = 47.2 / T
0.8
for the red triangle symbol line and HC* =1.3603 Ð 0.31 T × Ts,* and
by fitting the two lines, it can be seen that δ(ΔSM) /δ(µ0Η) → ∞ and HC
* ≈
1.36 T when the temperature T → 0 K; (b) 3-dimensional image of δ(ΔSM) /δ(µ0Η) as a function of field (from 0 T to 11 T) and temperature T (from 2.55 to 27.5 K).
Figure 6 The spin state and quantum phase transitions diagram for the Gd(OH)3 nanowire system;
SUPPLEMENTARY INFORMATION
Figures
Fig. 1, R. Zeng et al.
SUPPLEMENTARY INFORMATION
[image:23.595.61.553.116.531.2]Fig. 3, R. Zeng et al.
Fig. 4, R. Zeng et al.
SUPPLEMENTARY INFORMATION
SUPPLEMENTARY INFORMATION
Supporting Information
for
Extremely Large Magnetic Entropy Changes, Quantum Phase
Transitions and Diagram in Gd(OH)
3Single Crystal
Nanowires Quasi-One-Dimensional Large Spin (
S = 7/2
) Chain
Antiferromagnet
R. Zeng 1, 2, C.F. Zhang1, J.C. Debnath1, P. Shamba1, J.L. Wang1, Z.X. Chen1, Z.P. Guo1, S.X. Dou1
1
Institute for Superconducting and Electronic Materials, University of Wollongong, NSW 2522, Australia
2
School of Computing, Engineering and Mathematics, University of Western Sydney, Campbelltown, NSW 2560, Australia
Address for Correspondence:
Dr. R. Zeng
Solar Energy Technologies
School of Computing, Engineering and Mathematics University of Western Sydney
SUPPLEMENTARY INFORMATION
I. Microstructure of highly uniformity Gd(OH)3 nanowires:
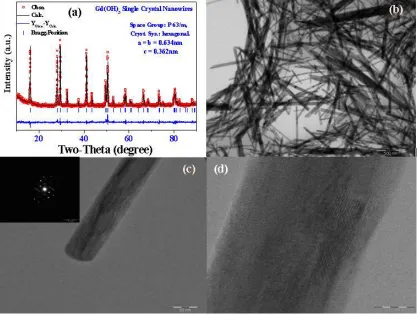
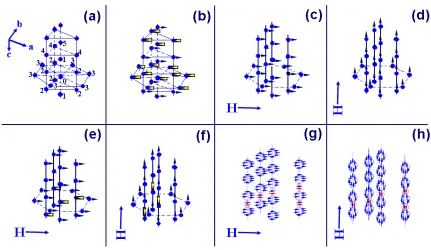
Fig. S1 (a) XRD pattern (symbols) and Rietveld refinement (solid line) of the Gd(OH)3 nanowires; the short
vertical lines mark the line positions in the standard, and the difference spectrum between experimental and calculated results is shown at the bottom; (b) FESEM image; (c) TEM image and SAED pattern (inset); and
(d) HRTEM image of Gd(OH)3 nanowires.
Fig. S1(a) displays the x-ray diffraction (XRD) and Rietveld refinement patterns of the Gd(OH)3 nanowires. Fig. 1(b) is a field emission scanning electron microscope (FESEM) image of
the Gd(OH)3 nanowires, (c) contains a transmission electron microscope (TEM) image and the
corresponding selected area electron diffraction pattern (SAED), and (d) shows a high resolution TEM (HRTEM) image of the Gd(OH)3 nanowires. The above observations of the microstructure
indicate that the nanomaterials show highly uniformity, high phase purity and are in single crystal nanowire form, with diameters of 25-35 nm and an average length of 800 nm. From the HRTEM image in Fig. 1(d), it appears that the nanowires are single crystals. The powder XRD refinement confirms the hexagonal crystal structure with space group P 63/m symmetry and lattice parameters a = b = 0.635 nm and c = 0.364 nm. In this structure, the Gd atoms form an array as infinite linear chains parallel to the c-axis. The distance between two neighboring Gd atoms is 0.364 nm, and each chain is surrounded by three other chains, so that they form hexagonal tunnels where the OH groups are inserted. The rings in the SAED pattern in the inset of Fig. 1(c) can be indexed as (100), (110), (200), (111), (201), and (002) reflections of hexagonal Gd(OH)3; no extra reflections are observed,
[image:27.595.91.508.94.409.2]SUPPLEMENTARY INFORMATION
II. Susceptibility:
Fig. S2 (a) Temperature dependence of the magnetic susceptibility (χ) and inverse susceptibility (1/χ) under zero field
[image:28.595.80.514.77.632.2]SUPPLEMENTARY INFORMATION
(TAS) and the spin flip state (TSF) to be determined; (d) δ(1/χ)/δT −T curve for applied 13.5 T field, with the transition
points at this field TAS = 15.4 K and TSF = 3.6 K; (e) temperature dependence of χT under ZFC in an external magnetic
SUPPLEMENTARY INFORMATION
[image:30.595.70.515.109.432.2]29 III. Magnetization
Fig. S3(a) Field dependence of the magnetisation (M) measured at indicated temperatures from 2.1 K to 30 K;
(b) Arrott-plot curves of M2 versus H / M for Gd(OH)3 nanowires at temperatures from 2.1 K to 30 K; (c) Modified Arrott-plot curves of M4 versus H / M for Gd(OH)3 nanowires at temperatures from 2.1 K to 30 K; (d)