Mining Movement Patterns from Video Data to
Inform Multi Agent Based Simulation
Muhammad Tufail1, Frans Coenen1, and Tintin Mu2
1
Department of Computer Science, The University of LiverPool, Liverpool, L69 3BX, UK;2Department of Electronics and Electrical Engineering, The University of
LiverPool, Liverpool, L69 3BX, UK
Abstract. Multi-Agent Based Simulation (MABS) is concerned with the utilisation of agent based technology for the purpose of running sim-ulations of real world scenarios. The challenge is in encoding the agents so that they operate as realistically as possible. The work described in this paper is directed at the mining of movement information from video data which can then be used to encode the operation of agents operating within a MABS framework. More specifically mechanisms are described to firstly mine “movement patterns” from videos of rats contained within in closed environment and secondly to utilise this information in the con-text of a simple MABS to support the study of animal behaviour.
Keywords:Pattern Mining, Multi Agent Based Simulation,Movement Pattern
1
Introduction
(machine learning) techniques so that MABS agent behaviour can be learnt. The suggestion is that this provides a much more realistic encoding than that typically achieved when agent behaviour is handcrafted. The work described in this paper is thus directed at using pattern mining techniques to extract “agent” behaviour (movement patterns) from video data and then to use these patterns to direct the operation of a MABS. To date the authors have been predominantly concerned with the pattern extraction element of the work and have thus only conducted “proof of concept” scenarios using a single MABS agent. However, as will become clear later in this paper, the mechanism will scale-up to encompass greater numbers of agents. To act as a focus for the work the authors have used videos of rats held in laboratory conditions within 1.2 m2boxes such that a video camera can be suspended over the centre of each box. The motivation for this application domain was to support animal behaviour studies; a domain where computer simulation, despite the advantageous offered, is not typically avail-able. Animal behaviourists have traditionally operated by physical observation and/or by using tagging mechanisms (electronic tagging in more recent times); mechanisms that of course have their place but tend to be extremely time and resource consuming [?].
The rest of this paper is organised as follows. Section 2 presents an overview of previous work related to that described in this paper. Section 3 reviews the nature of the raw video data used with respect to this paper. Section 4 presents the proposed learning framework, grid representation and movement pattern representation. The operation of the proposed mammalian behaviour MABS, founded on the mined movement patterns, is then described in Section 5. An evaluation of the proposed approach Section 6 and a case study in Section 8. The paper is concluded in Section 8 with a summary of the main findings.
2
Previous Work
There has been substantial work conducted within the data mining community directed at the application of data mining techniques to video data, so called video mining [?]. One example in the context of mouse and rat video data, can be found in [?] where a trainable, general purpose automated system is described to support the behavioural analysis of mice in cages. The system is designed to generate a classifier, using hand labelled training data, that can then be used to label fragments of previously unseen video data.
is suggested that move movement within a radio frequency environment may cause unnatural behaviour. In [?] a computer vision program is used to analyse Audio Video Interleave (AVI) files to capture the behaviour of mice with respect to a particular challenge known as the Morris Water Maze. The system accepts input video in AVI format and uses a computer vision based technique to extract rat movement information such as elapsed time, average velocity and total dis-tance to support behavioural analysis of rats. In [?] a mechanism is introduced, called mice profiler, that uses geometrical primitives to model and track (two) mice. The mechanism allows for the capture of information concerning the posi-tion, orientaposi-tion, distance and speed of each mouse and can distinguish between mice in close proximity of each other. However, the system requires that the mice are manually located. To this end an interface is provided that allows the user to “circle” the head and body of each mouse. Once identified tracking can commence, but each time a mouse is “lost” the user must relocate the mouse. However, none of these systems are directed at the identification of “movement patterns” such as envisioned in this paper, and none are designed to provide input to support the realisation of mice and/or rat behaviour MABS.
In the context of MABS for animal behaviour simulation there have been a number of reported studies. Of note in this context is the work described in [?] and [?] where the Mamalian Behaviour MABS (MBMABS) framework is introduced. In MBMABS everything is an agents including the “players”, the environment (the “playing area”) and obstructions contained within the environ-ment. MBMABS operates using the concept of a behavioural graph that com-prises vertices representing states and edges indicating possible state changes. The framework also encompasses the concept of desires which can be either static or dynamic. Agents conceptually move around this behaviour trees according to these desires. In [?] and [?] a number of case studies are presented using a variety of environments (including a maze environment). The work described in [?] and [?] is of interest with respect to the work described in this paper because: (i) it is directed at rodent behaviour simulation and (ii) it uses a MABS framework. However, a disadvantage of MBMABS, which the system described in this paper seeks to address, is that the behaviour graph requires manual construction based on observation; a time consuming process that is also error prone.
3
Raw Data
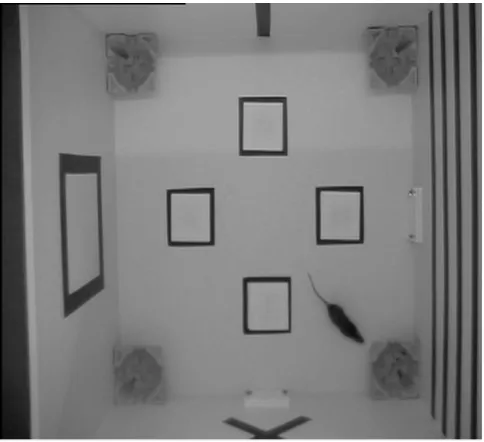
realistic simulation. A “still” from one of the videos is given in Figure 1. From the figure it can be seen that this scenario includes four “nest boxes”, located at each corner of the playing area. It also includes some markings on the base of the box that were ignored for the purpose of experiments considered in this paper.
Fig. 1.Still form rat video data
The video processing was conducted using the “Blob tracking” mechanism described in [?]. This mechanism processes the video frame by frame. At start up the mechanism will attempt to identify one or more “blobs” by considering the first two frames. First the video content of the frames will be converted to gray scale then “foreground-background” detection will be conducted by comparing frame 1 to frame 2. Pixel values that have changed between frames then define the “foreground”. Groups of connected foreground pixels then define “blobs”. We then continue to frame 2 and 3 and repeat process and so on. On each iteration we record the identified blob locations (as described in section 4). Periodically it may be the case that a blob is lost, in which case we will stop recording locations, but continue the frame comparison process until the blobs are rediscovered.
4
Learning Frame Work
terms of the mouse behaviour MABS described in [?,?], was conceived of as a grid across which rats could be tracked. More detail concerning the grid repre-sentation used is presented in Sub-section 4.1. The patterns we are interested in aremovement patternsdescribing the movement of the subject (rats in the case of our experiments) between each time t and time t+i where i is some inter-val measured in terms of a number of “video frames”. We experimented with a variety of values fori but found that an interval of 25 frames (approximately 1 second) seemed to produce best results. Thus movement patterns were extracted by processing the video data and recording locations using a sample interval of i. Through out the process frequency counts were maintained so that at the end of the process each pattern had a support value (v) associated with it (a frequency count). The identified patterns were initially stored in the form of a tupleha, bi
where a represented the “from” location at time t and b the “to” location at time t+i(of course it is possible that a==b). The collected data was stored in a tabular format. Each pattern in the task had a support countv associated with it (essentially an occurrance count). Two mechanisms were considered for representing the movement patterns of interest: (i) absolute and (ii) relative. Both mechanisms are described in further detail in Sub-section 4.2. The support value for each movement pattern was then used to identify the probability (like-lihood of occurrence) associated with each individual pattern. Knowledge of the extracted movement patterns and their associated probabilities then provided the source information with which to drive our desired mammalian behaviour MABS. The operation of this MABS is presented in Section 5.
4.1 Grid Representation
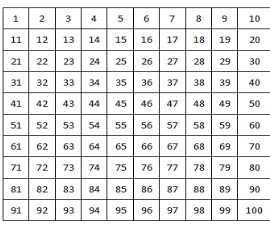
As noted above the playing area of interest was divided into an×ngrid to give a collection ofn2cells. The valuen= 10, was selected so that it equated to the approximate size of a rat (note that experiments, not reported here, have been conducted by the authors using different values,n={5,10,20}), butn= 10 was found to give the best result. Each cell was given a sequential number so as to linearise the space. The effect of this is that to move (say) one cell to the north is achieved by applying a constantkto the current cell number; similarly to move (say) one cell to the south-west requires the application of another constant
Fig. 2.Example of a grid numbered usingtesseral addresses
4.2 Movement Pattern Learning
As noted above movement patterns were identified, extracted and stored using a sample interval of i = 25 frames. The collected data was stored in a tabular format. Two mechanisms for recording movement patterns were considered: (i) absolute and (ii) relative. In the case of absolute patterns the “to” and “from” location IDs (aandb) were stored in the form of tesseral addresses as shown in Table 1, where each record comprises afrom-tolocation tuple, the support count for the pattern (v) and the associated probability of occurrence (p) calculated using Equation 1.
p= v
φ (1)
whereφrepresents total number of visits for a cell; for example with reference to table 1, in the case of cell 1,φ= 25 (8 + 5 + 1 + 1 + 2 + 5 + 1 + 1 + 1 = 25) and in the case of cell 2,φ= 22 (3 + 3 + 1 + 2 + 1 + 3 + 2 + 1 + 1 + 1 + 1 + 1 + 1 + 1 = 22).
From ID To ID Support (v) Probability (p)
1 1 8 0.32
1 2 5 0.20
1 4 1 0.04
1 5 1 0.04
1 11 2 0.08
1 12 5 0.20
1 32 1 0.04
1 33 1 0.04
1 47 1 0.04
2 1 3 0.13
2 2 3 0.13
2 4 1 0.04
2 7 2 0.09
2 8 1 0.04
2 12 3 0.13
[image:7.612.208.407.112.324.2]. . . .
Table 1.Examples ofabsolutemovement patterns
the o location type is there as a“ catch all”. Clearly when considering more sophisticated scenarios additional location types can be added.
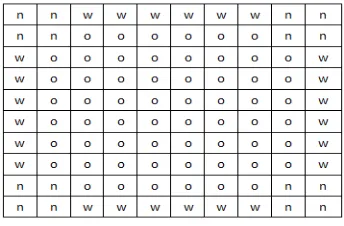
An example of a grid labeled with location types is presented in Figure 3. Note that this labeling will work regardless of the nature of the grid size or the playing area size provided that no further location types are introduced (for example a feeding point or an obstruction location type). Once we have a set of location
Fig. 3.Playing area grid annotated with location type labels taken from the set
L
[image:7.612.221.393.463.576.2]location was then described in terms of a nine character “descriptor” generated using a “top-left to bottom-right” lineraistaion of the neighbourhood. Using this spatial representation some neighbourhoods would encompass locations (cells) that were outside of the playing area, we indicated this location type using the symbol −, thus L ={n, w, o,−}. In this manner individual locations were described in relative terms. In the context of the rat in a box scenario under consideration with respect to the work described in this paper the 45 different potential descriptors are listed in Table 2. Thus using the relative representation fewer location patterns are required than the number of cell labels; thus the relative representation, in addition to being more generic, also offers storage advantages over the absolute representation. It is acknowledge, with respect to work presented in this paper, these descriptors are currently rotation variant, for future work we intend to derive descriptors that are rotation invariant in which case the number of required descriptors will be decreased further. Note also, with respect to Table 2, that pattern numbers have ben included simply to facilitate discussion, not because they are required by the pattern mining process or the eventual operation of the desired MABS. Thus, considering descriptor 1 this represents the cell in the top left hand corner of Figure 3 which in turn represents a nest location (see Figure 1). The location for this cell is described by the descriptor− − − −n n−n nindicating that five of the neighbourhood locations are outside of the playing area.
Num. Descriptor Num. Descriptor Num. Descriptor
1 - - - -nn-nn 2 - - -nn-nn- 3 nnnn
-4 nn-nn- - - - 5 nn-nn-ow- 6 -nn-nn-wo
7 nnonnw- - - 8 nnowoowoo 9
nn-ow-ow-10 - - -nnwnno 11 nnwnnowoo 12 -nn-wo-wo
13 noonww- - - 14 noooooooo 15 - - -nwwnoo
16 nwwnooooo 17 onnoowoow 18 onnwnn
-19 oonoooooo 20 oonwwn- - - 21 ooonoonww
22 ooooonwwn 23 oooooonoo 24 oooooooon
25 ooooooooo 26 oooooowww 27 ooowww
-28 oowonnwnn 29 oowoowonn 30 oowoowoow
31 ow-nn-nn- 32 ow-ow-nn- 33
ow-ow-ow-34 - - -wnnonn 35 wnnonnoow 36 -wo-nn-nn
37 woonnonnw 38 woowoonno 39 woowoowoo
40 -wo-wo-nn 41 -wo-wo-wo 42 - - -wwnoon
43 wwnoonooo 44 - - -wwwooo 45 wwwoooooo
Table 2. The complete set of location descriptors with respect to the rat in a box scenario
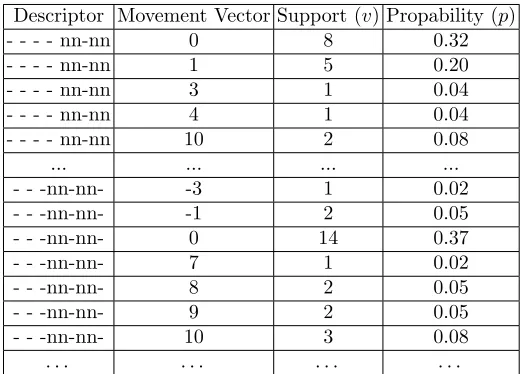
of times. In each case it has a movement vector associated with it describing a movement pattern, a vector of 0 indicates no movement, a vector of 1 a movement of one cell to the east, and so on as described in Sub-section 4.1 above. Each record also has a support count (v) for the associated movement pattern descriptor-movement vector pair and the associated probability (p) of the descriptor-movement pattern pair occurring; again calculated using equa-tion 1 although in this casev is the support value for the associate descriptor-movement-movement vector pair and φ is the total number of occurrences for the pair. Thus in the case of the movement pattern − − − −n n−n n the probability is 0.32 (v= 8 andφ= 25 )
Descriptor Movement Vector Support (v) Propability (p)
- - - - nn-nn 0 8 0.32
- - - - nn-nn 1 5 0.20
- - - - nn-nn 3 1 0.04
- - - - nn-nn 4 1 0.04
- - - - nn-nn 10 2 0.08
... ... ... ...
- - -nn-nn- -3 1 0.02
- - -nn-nn- -1 2 0.05
- - -nn-nn- 0 14 0.37
- - -nn-nn- 7 1 0.02
- - -nn-nn- 8 2 0.05
- - -nn-nn- 9 2 0.05
- - -nn-nn- 10 3 0.08
[image:9.612.177.437.257.444.2]. . . .
Table 3.Examples of relative movement patterns
5
MSBS Operation
placed at some (legal) location within the environment and then allowed to move round the playing area (environment) according to knowledge of the collected movement patterns. At each step of the simulation information concerning the possible next location (which might be the current location) was extracted from the movement pattern table and the associated probabilities used to define a weighted random selection of the next location. In the case of the absolute rep-resentation the cell IDs were used while in the case of the relative reprep-resentation the cell descriptors were used. In the latter case movement was indicated by the associated movement vector. The simulation time used was set to be equivalent to the video time (25 frames per second), and the update interval the same as the sample intervali(recall thati= 25 frames in the context if the work presented in this paper).
6
Evaluation
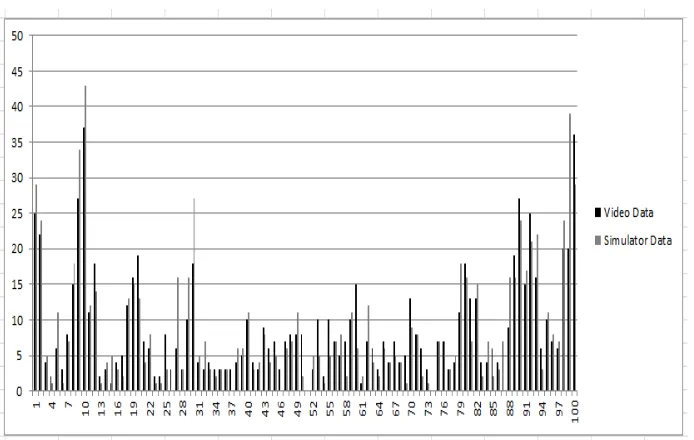
It is difficult to evaluate the operation of MABS with respect to any kind of “gold standard”, however in our case we can compare the operation of our MABS with the video data to establish whether our MABS operates in a realistic manner. We did this by mining the simulator data in the same manner as the original video data was mined and extracting movement patterns from the simulator data. We could then compare the nature of the support counts associated with the simulated data with that associated with the video data. Some sample results using the absolute representation for three runs of the MABS is presented in Figure 4. In the figure the horizontal axis shows the cell identification number (tesseral address) while the vertical axis shows the number of visits at each location. The black bars indicate the frequency that each grid cell was visited in the video data and the gray bars the frequency abstracted from the simulation. From the figure it can be observed that the behaviour of the rat in the case of the simulation is similar to that captured from the video data. In other words we can conclude that the MABS operates in a realistic manner. Reference to Figures 2 and 3 indicate that: (i) cell numbers 1, 2, 11 and 12 represent the north-west nest box, (ii) cell numbers 81, 82, 91 and 92 represents south-west nest box, (iii) cells 9, 10, 19 and 20 the north-east nest box, and (iv) cells 89, 90, 99 and 100 the south-east box. Thus from Figure 4 it can be noted that cells representing nest boxes, as might be expected, are the most visited location.
A similar experiment was conducted using the relative representation. Again the frequency counts were found to be similar, again indicating a realistic MABS operation as shown in figure 5. Of course on each MABS run the recorded fre-quency counts will not be the same but our experiments have indicated that consistent results are obtained.
7
Case Study
multi-Fig. 4. Comparison of Simulation Movement with Real Movement using the absolute representation
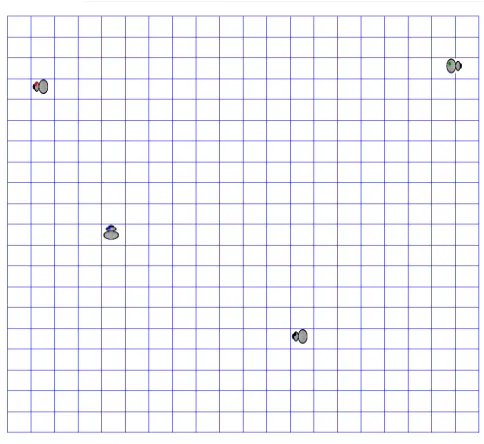
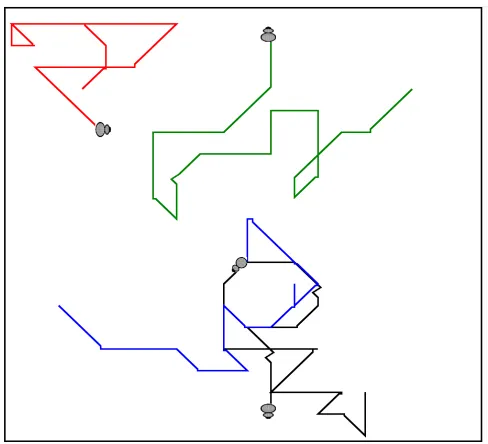
[image:11.612.135.482.397.617.2]agent setting. The objective of the case study was to demonstrated that the relative pattern based approach could be scaled up to encompass: (i) more than one agent and (ii) playing areas of differing size to that on which the training was conducted. The case study thus comprised four agents and a 20×20 grid as shown in Figure 6. Figure 7 demonstrates the movement of the agents over the first 60sec (iterations) of the simulation. The movement lines are comparable with those recorded with respect to the training data. From the evidence provided by this case study it is suggested that the technique can be used to run even larger simulations.
Fig. 6.Case Study (timet= 0)
8
Conclusion
Fig. 7.Case Study with movement trails (timet= 60 sec)