This is a repository copy of Reporting the sensitivity of laser-induced fluorescence
instruments used for HO2 detection to an interference from RO2 radicals and introducing a novel approach that enables HO2 and certain RO2 types to be selectively measured. White Rose Research Online URL for this paper:
http://eprints.whiterose.ac.uk/87628/ Version: Accepted Version
Article:
Whalley, LK, Blitz, MA, Desservettaz, M et al. (2 more authors) (2013) Reporting the sensitivity of laser-induced fluorescence instruments used for HO2 detection to an interference from RO2 radicals and introducing a novel approach that enables HO2 and certain RO2 types to be selectively measured. Atmospheric Measurement Techniques, 6 (12). 3425 - 3440. ISSN 1867-1381
https://doi.org/10.5194/amt-6-3425-2013
[email protected] https://eprints.whiterose.ac.uk/
Reuse
Unless indicated otherwise, fulltext items are protected by copyright with all rights reserved. The copyright exception in section 29 of the Copyright, Designs and Patents Act 1988 allows the making of a single copy solely for the purpose of non-commercial research or private study within the limits of fair dealing. The publisher or other rights-holder may allow further reproduction and re-use of this version - refer to the White Rose Research Online record for this item. Where records identify the publisher as the copyright holder, users can verify any specific terms of use on the publisher’s website.
Takedown
If you consider content in White Rose Research Online to be in breach of UK law, please notify us by
1
Reporting the sensitivity of Laser Induced Fluorescence
1
instruments used for HO
2detection to an interference from
2
RO
2radicals and introducing a novel approach that
3
enables HO
2and certain RO
2types to be selectively
4
measured
5
6
L. K. Whalley1,2, M. A. Blitz1,2, M. Desservettaz1, P.W. Seakins1,2 & D. E. Heard1,2 7
[1] School of Chemistry, University of Leeds, Leeds, LS2 9JT, UK 8
[2] National Centre for Atmospheric Science, University of Leeds, Leeds, LS2 9JT, UK 9
10
Abstract 11
Laboratory studies have revealed that alkene-derived RO2 and longer-chain alkane-derived
12
RO2 (>C3) radicals rapidly convert to HO2 and then to OH in the presence of NO in a
13
Fluorescence Assay by Gas Expansion (FAGE) detection cell (Fuchs et al., 2011). Three 14
different FAGE cells that have been used to make ambient measurements of OH and HO2 in
15
the University of Leeds ground-based instrument have been assessed to determine the 16
sensitivity of each cell, when operating in HO2 detection mode, to RO2 radicals. The
17
sensitivity to this interference was found to be highly dependent on cell design and operating 18
parameters. Under the operating conditions employed during fieldwork undertaken in the 19
Borneo rainforest in 2008, an OH yield of 17% was experimentally determined for both 20
ethene- and isoprene-derived RO2 radicals. The high pumping capacity of this system,
21
resulting in a short residence time in the cell, coupled with poor mixing of NO into the 22
ambient air-stream for the titration of HO2 to OH effectively minimised this potential
23
interference. An OH yield of 46% was observed for ethene-derived RO2 radicals when a
24
smaller detection cell was used, in which the mixing of NO into the ambient air was 25
improved and the cell residence times were much longer. For a newly developed ROxLIF
26
cell, used for detection of HO2 and RO2 radicals, when running in HO2 mode an OH yield of
27
95% was observed for ethene-derived RO2 radicals.
2 In experiments in which conditions ensured the conversion of RO2 to OH was complete, the
1
yields of OH from a range of different RO2 species agreed well with model predictions based
2
on the Master Chemical Mechanism version 3.2. For ethene and isoprene derived RO2
3
species, the relative sensitivity of FAGE was found to be close to that for HO2, with an OH
4
yield of 100% and 92% respectively. For the longer-chain or cyclic- alkane-derived RO2
5
radicals (> C3), model predicted OH yields were highly dependent upon temperature. A
6
model predicted OH yield of 74% at 298 K and 36% at 255 K were calculated for 7
cyclohexane derived RO2 radicals, and an experimental yield of 38% was observed indicating
8
that the temperature within the cell was below ambient owing to the supersonic expansion of 9
the airstream in the low pressure cell. 10
These findings suggest that observations of HO2 by some LIF instruments worldwide may be
11
higher than the true value if the instruments were sensitive to these RO2 species. If this is the
12
case, it becomes necessary to compare atmospheric chemistry model simulations to HO2*
13
observations, where HO2* = [HO2]+i i[RO2i] and i is the mean fractional contribution of
14
the RO2 species that interferes (RO2i). This methodology, however, relies on model
15
simulations of speciated RO2 radicals, as instrumentation to make speciated RO2
16
measurements does not currently exist. Here we present an approach that enables the 17
concentration of HO2 and RO2i to be selectively determined by varying the concentration of
18
NO injected into a FAGE cell. Measurements of [HO2] and [RO2i] taken in London are
19
presented. 20
1 Introduction 21
OH and HO2 radicals, collectively termed HOx, together with RO2 radicals, control the
22
oxidative chemistry in the atmosphere, being responsible for the transformation of primary 23
emissions into secondary pollutants such as NO2, O3 and particulates. OH radicals control the
24
lifetime of some greenhouse gases (e.g. CH4), the production of acidic species (e.g. H2SO4)
25
and aerosol precursors such as oxygenated volatile organic compounds. Understanding the 26
behaviour of free-radicals in the atmosphere is of paramount importance in understanding the 27
lifetimes of pollutants and hence the spatial scales of their transport. Predictive models for 28
future air quality and climate change contain complex chemical schemes, and comparison 29
with measurements of free-radicals (the concentrations of which are controlled only by local 30
chemistry and not by transport) in the present atmosphere constitutes one of the best 31
validations of these schemes (Heard and Pilling, 2003). OH and HO2 radicals in the
3 troposphere have been measured since the early 1990s using laser induced fluorescence (LIF) 1
spectroscopy at low pressure (Fluorescence Assay by Gas Expansion, or the FAGE 2
technique) originally developed by Hard et al. (1979), (1984). The technique employs 308 nm 3
radiation, produced using a variety of laser technologies, to excite OH radicals, which 4
fluoresce; this emission (also at 308 nm) is detected and used to quantify OH. It is also 5
possible to simultaneously detect HO2 in a second fluorescence cell, by chemical conversion
6
to OH through reaction with NO and subsequent detection by LIF. The technique has been 7
employed by several groups worldwide for the detection of OH and HO2 (Hofzumahaus et al.,
8
1996; Mather et al., 1997; Kanaya et al., 1999; Creasey et al., 2001; Faloona et al., 2001; 9
Hanisco et al., 2002; Holland et al., 2003; Heard and Pilling, 2003; Stone et al., 2012). 10
Specific to this work, the Leeds ground-based FAGE instrument has been operational since 11
1996 and has detected OH and HO2 under a variety of conditions ranging from urban (Heard
12
et al., 2004) to clean marine (Whalley et al., 2010). Although the FAGE technique represents 13
an extremely sensitive (typical OH detection limits are in the low to mid 105 molecule cm-3) 14
(Heard and Pilling, 2003) and selective method for OH and HO2 detection, ambient HOx
15
concentrations are themselves extremely low (OH concentrations are typically a few 106 16
molecule cm-3) (Stone et al., 2012), thus, care needs to be taken to ensure that any 17
measurement is not biased by any chemical or spectral interference. 18
A well-documented example of an OH interference comes from the earliest tropospheric LIF 19
instruments (Davis et al., 1981; Ortgies et al., 1980; Shirinzadeh et al., 1987), which used off-20
resonant pulsed laser excitation of the OH radical at 282 nm, via the 21
A2 +( =1) 2 i( ’’=0) transition. These instruments were found to suffer from a
22
considerable interference from laser-generated OH formed by the laser photolysis of ambient 23
ozone and subsequent reaction of O(1D) with ambient water vapour: 24
2 1
hv
3 O( D) O
O (R1)
25
2OH O
H D)
O(1 2 (R2)
26
The use of OH detection at lower pressure (reducing [H2O] and hence the rate of R2), lower
27
laser energy per pulse (the OH artefact signal depends on the square of the laser energy) and 28
switching to excitation at 308 nm (the H2O/O3 interference is 30 times lower than at 282 nm)
29
4 interference in the presence of ozone and water vapour that appeared to be a dark reaction on 1
the walls of their detection cell which produced a source of HO2 radicals; the authors report a
2
signal equivalent to 5.4×10⁷ molecule cm-3 of HO2 in the presence of 50 ppbv O3 and at a
3
relative humidity of 60%. This interference has been characterised in detail and is subtracted 4
from their ambient HO2 measurements.
5
In the presence of the added NO used to convert HO2 to OH inside the fluorescence cell, and
6
hence enable HO2 to be measured, organic peroxy radicals (RO2) also have the potential to be
7
chemically converted to OH also via: 8
2
2 NO RO NO
RO (R3)
9
O R HO O
RO 2 2 H (R4)
10
2
2 NO OH NO
HO (R5)
11
Due to the low pressure employed in FAGE detection, however, R4 is slow (~12 s-1 for CH3O
12
at 1 Torr) and, given the very short residence time in FAGE between NO injection and the 13
detection region of typically just a few milliseconds or less (Creasey et al., 1997b), it was 14
assumed, until recently, that RO2 radicals were not converted to OH to any large extent. In
15
support of this, Ren et al. (2004) reported no interference upon introduction of C1– C4 alkane
16
derived RO2 radicals in the Penn. State FAGE system, and concluded that there was no
17
evidence of any significant interferences for OH or HO2 measurements in the atmosphere,
18
including in highly polluted urban environments. Only recently has an interference from 19
alkene and aromatic derived RO2 species been reported (Fuchs et al., 2011). Unlike
alkane-20
derived RO2 species which are formed via H-atom abstraction from the parent alkane and
21
subsequent addition of O2 (R6), the major pathway to alkene-derived RO2 formation is via
22
OH addition across the double bond followed by O2 addition (R7):
23
O H RO OH
RH 2 2
O2
(R6)
24
2 O
O R' R(OH) OH
R'
R 2 (R7)
25
2 2 NO R(OH) R'O NO O
R'
R(OH) (R8)
26
2 H
2 R(OH) R' O HO O
O R'
R(OH) (R9)
5 OH
R' O R O
R'
R(OH) Decomp. (R10) 1
2
2 R O HO
O OH
R' (R11)
2
The -hydroxyalkylperoxy radical formed reacts with NO to form the -hydroxyalkoxy 3
radical (R8) which can either react with O2 (R9) or decompose to a hydroxyalkyl radical
4
(R10) which then reacts rapidly with O2 to form a carbonyl and HO2 (R11). Compared to the
5
slow RO + O2 reaction (k = 1.65 × 10⁻¹⁵ cm3molecule-1s-1, for R = CH3, R9 (Orlando et al.,
6
2003)), decomposition and subsequent reaction of the hydroxyalkyl radical (CH2OH) with O2
7
is fast (k = 9.6 × 10⁻¹² cm3molecule-1s -1 (Atkinson et al., 1997)). Fuchs et al. (2011) found, 8
due to this rapid decomposition pathway, that RO2 species formed from alkene and aromatic
9
precursors were detected as OH with relative sensitivities greater than 80% with respect to 10
that for detection of HO2 in their FAGE system. The level of the interference was found to be
11
highly dependent upon the NO concentration injected and reaction time between injection 12
and OH detection, which was varied by Fuchs et al., suggesting that other FAGE instruments 13
with different cell designs and operational parameters may display different sensitivities 14
towards this interference. FAGE cells used for airborne HO2 measurements tend to have
15
longer inlets to extend through the fuselage of the aircraft and, hence, sampled air tends to 16
have longer residence times in these cell types compared to cells used solely for ground 17
measurements. Very recently, Mao et al. (2012) reported an average RO2 sensitivity of ~60%
18
with respect to that for HO2 for a selection of alkene-derived RO2 species in the Penn. State
19
FAGE instrument, whilst Vaughan et al. (2012) reported a sensitivity to ethene-derived RO2
20
radicals of 40% with respect to that for HO2 for the University of Leeds aircraft FAGE
21
instrument (Commane et al., 2010). Ultimately, the measurement bias on the HO2
22
concentrations reported from past field studies will depend upon the individual FAGE 23
instruments utilised (because of variations in key operating parameters such as residence 24
time) and the concentration and speciation of RO2 present. Many FAGE groups now report
25
HO2* for comparison with atmospheric chemistry box models (Lu et al., 2012) where HO2*
26
= [HO2]+i i[RO2i], and i is the mean fractional contribution of the RO2 species that
27
interfere (RO2i) in a particular instrument which has been determined experimentally.
28
Together with an HO2 interference, FAGE measurements of OH are reported to have an
29
interference for one instrument type in forested environments (Mao et al., 2012). The authors 30
6 with laser-generated OH within the cell being ruled out. Similar to the HO2 interference
1
reported here, this OH interference may be dependent upon the particular design of this 2
FAGE cell, for example the residence time between sampling and detection and, as such, the 3
extent that other OH measurements suffer from this interference is unknown, meaning that it 4
is critical that a set of standardised experiments are performed on different FAGE cell types 5
used for ambient detection of OH to assess the extent of any interference. Good agreement 6
between two independent OH measurements made using Differential Optical Absorption 7
Spectroscopy (DOAS) and LIF was observed during a series of experiments performed in the 8
SAPHIR atmospheric simulation chamber under a range of atmospheric conditions (Fuchs et 9
al., 2012;Fuchs et al., 2013) suggesting that the Julich FAGE system, at least, does not suffer 10
an interference when detecting OH under the conditions studied. 11
12
In this paper we report results from interference studies performed using the University of 13
Leeds ground-based FAGE instrument (Creasey et al., 1997a, Whalley et al., 2010) 14
measuring in HO2 mode (NO added to the detection cell) and discuss the likely impact of the
15
RO2 interference on previous field studies. We also compare absolute yields of OH from
16
alkene-derived and higher alkane-derived RO2 species in the presence of NO with MCMv3.2
17
recommendations, where experimental conditions allowed reactions to proceed to 18
completion. . 19
2 Experimental 20
HO2 and RO2 radicals were generated prior to FAGE detection by two different methods: a
21
steady-state turbulent flow tube reactor calibrated for absolute radical concentrations and a 22
time-resolved laser flash photolysis system. Each method will be described in turn. 23
2.1 Steady state experiments 24
The FAGE calibration system (described in detail by Commane et al. (2010)) acts as a 25
turbulent flow reactor and generates known and equal quantities of OH and HO2 radicals by
26
the 184.9 nm photolysis of H2O vapour by a Hg penray lamp in a humidified air stream (R12
27
– 13): 28
29
OH H hv O
H2 (R12)
30
2 M
2 HO
O
H (R13)
7 1
With knowledge of the product of the lamp flux and irradiation exposure time past the lamp 2
(determined by N2O actinometry (Commane et al., 2010)) the concentration of OH and HO2
3
may be determined; typical radical concentrations generated by this method range from <107 4
– 109 molecule cm-3. RO2 radicals (in the presence of HO2 from R13) were generated by
5
introducing the parent hydrocarbon into the FAGE calibration system approximately 2.5 cm 6
after the penray lamp. The OH generated in the calibration photolysis region reacted rapidly 7
with the hydrocarbon introduced, (R6), generating RO2 radicals. To assess the magnitude of
8
any HO2 interference suffered during previous ambient field measurements, a number of
9
individual peroxy radical species were generated and introduced into three different 10
fluorescence cells (Fig. 1) which have been used during field deployments by the Leeds 11
group (further details on the fieldwork FAGE detection cells tested are given in section 2.1.1 12
below). The peroxy radicals tested were derived from methane, propane, ethene, isoprene, 13
toluene, cyclohexane and methanol. A small flow (~10 - 150 Standard Cubic Centimetre per 14
Minute, SCCM) of a dilute (0.1 – 5%) hydrocarbon mix in N2 (ethene, isoprene, toluene,
15
cyclohexane or methanol) or a 100% hydrocarbon flow of propane (10 SCCM) or methane 16
(500 SCCM) was introduced into a 20 – 40 Standard Litre per Minute (SLM) humidified air-17
stream approximately 5 cm before the exit of the calibration tube. The residence time within 18
the calibration flow tube (~ 10 ms at 40 SLM) was sufficient to ensure complete conversion 19
of OH to RO2 before being sampled in the fluorescence cells. In the case of ethene, at an
20
initial concentration of 3.1×10¹⁴ molecule cm-3, it takes ~1 ms for complete conversion of OH 21
to RO2, using a rate coefficient,kC2H4OH, equal to 2.86×10 -11
molecule-1cm3s-1 (Cleary et al., 22
2006). This could be experimentally verified by observing the complete loss of the OH signal 23
upon addition of the hydrocarbons when no NO was added to the FAGE expansion cells; this 24
complete loss of OH signal was observed even for the slowest reacting hydrocarbon species, 25
methane. 26
27
2.1.1 FAGE detection cells 28
The University of Leeds ground-based FAGE instrument described in detail elsewhere 29
(Whalley et al., 2010) was assessed to determine the magnitude of the HO2 interference from
30
selected RO2 species under configurations employed in two recent field studies. The first, the
31
8 in the Borneo rainforest (Whalley et al., 2011) and the second, the Hill Cap Cloud Thuringer 1
– 2010 (HCCT-2010) (Whalley et al., 2013) which aimed to quantify the loss of radicals to 2
cloud droplets. 3
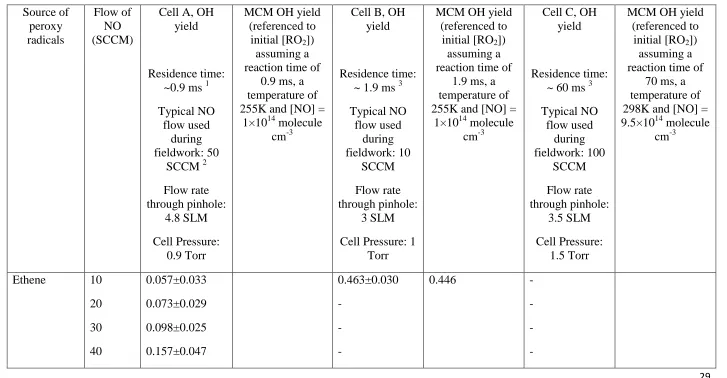
The operational parameters of the different FAGE fluorescence cells considered are quite 4
different and are summarised in Table 1. During OP3, one 22 cm internal diameter 5
cylindrical, stainless steel fluorescence cell (cell A) was used to make sequential 6
measurements of OH and HO2 (Fig. 1a). Air was drawn into the cell via a 5 cm tall, 2.54 cm
7
diameter turret through a 1 mm diameter pinhole nozzle in a flat plate (0.1 mm thickness). 8
The cell was maintained at approximately 0.9 Torr using a Roots blower backed by a rotary 9
pump (Leybold). The cell was connected to the pump system via a 10 cm ID, 5 m length 10
stainless steel flexible hose. NO was injected into the cell 7.5 cm below the nozzle via a 11
custom-built injection ring containing four injection points, spaced 4 cm apart, and made 12
from 1.6 mm (ID) tubing in a square arrangement located around the air stream. 50 SCCM 13
NO was injected into the cell via a computer-controlled solenoid valve (Metron 14
Semiconductors) and calibrated mass flow controller (MKS 1179A, range 0 – 50 SCCM) 15
during the second half of the collection period when the laser was tuned to the OH transition. 16
As only one cell was used for sequential detection of OH and HO2, the conditions were
17
optimised to maximise the sensitivity towards OH. Under these conditions the conversion of 18
HO2 to OH was only ~ 10%, most likely due to poor mixing of the NO into the ambient air
19
flow caused by the particular flow characteristics created by the combination of the 1 mm 20
diameter pinhole nozzle and the pressure and pumping speeds employed. The 10% 21
conversion of HO2 to OH determined assumes that there is no preferential loss of either
22
radical in the calibration system, i.e. that the concentration of OH and HO2 are equal as they
23
enter the FAGE detection cell. This assumption has previously been verified by addition of 24
sufficient CO to the calibration system so as to rapidly convert all the OH to HO2 (R16) and
25
the HO2 signal was observed to double in the presence of CO. The radicals sampled, or
26
converted from HO2, were electronically excited at 308 nm, approximately 13 cm below the
27
sampling nozzle using a tuneable, 5 KHz pulse repetition frequency laser (Nd:YAG pumped 28
Ti:Sapphire, Photonics Industries) with the fluorescence at the same wavelength detected 29
perpendicular to the laser axis by a filtered (Barr Associates filter, transmission > 50% at 308 30
9 During the HCCT-2010 campaign a single FAGE fluorescence cell was used to measure both 1
radical species (Cell B). The cell was operated from the top of a 22 m high tower to co-locate 2
with hill-cap cloud measurements and ensure that the radical measurements were performed 3
in full cloud when it had formed. As a result of these requirements a smaller cell, based on 4
the University of Leeds aircraft FAGE fluorescence cell (Commane et al., 2010), was used to 5
make sequential measurements of OH and HO2 (Fig. 1b); operational details are provided in
6
Table 1. NO (10 SCCM) was injected into this cell via 3.2 mm ID stainless tubing inserted 7
into the centre of the ambient air stream. This configuration resulted in a high conversion of 8
HO2 to OH (~90%). Ambient air was drawn into the cell through a 1 mm diameter pinhole
9
nozzle into a 4.5 cm (ID) stainless steel cylinder. The cell was held at 1 Torr and was 10
connected to the roots-rotary pump system described above via 30 m of flexible hosing (5 cm 11
ID). Laser light was delivered from the Nd:YAG pumped Ti:Sapphire laser system to the cell 12
via a 30 m fibre optic. The distance between sampling nozzle and detection was 18 cm with 13
the NO injected ~8 cm below the nozzle. 14
15
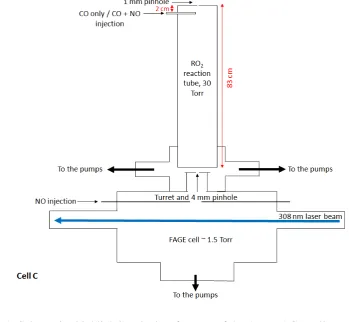
The third FAGE cell (Cell C) tested for an RO2 interference was a recently developed
16
fluorescence cell designed for the detection of RO2 radicals, alongside OH and HO2, using
17
the ‘ROxLIF’ methodology outlined by Fuchs et al. (2008). The RO2 cell is operated in two
18
modes, providing a measurement of the sum of OH+HO2 in HOx mode and the sum of
19
OH+HO2+RO2 in ROx mode. Experiments were run on this third FAGE cell to determine the
20
magnitude of the HO2 interference suffered from a variety of RO2 species in the HOx mode.
21
A similar FAGE fluorescence cell as the one described above (Fig. 1a, cell A) was modified 22
by coupling it to a differentially pumped reaction tube (held at approximately 30 Torr) to 23
allow for conversion of RO2 radicals to OH (Fig. 1c). The reaction tube is an 83 cm high, 6.4
24
cm diameter aluminium tube which has been coated with halocarbon wax to minimise radical 25
wall losses. Ambient air (7.5 SLM) is drawn into the reaction tube through a 1 mm diameter 26
pinhole drilled into a thin (1 mm thickness), flat plate aluminium inlet nozzle. In HOx mode,
27
250 SCCM of CO (5% in N2, BOC) is flowed into the centre of the reaction tube just beneath
28
the inlet (~ 2 cm below) via a 6.4 mm (ID) stainless steel tube. Hydroxyl radicals are 29
converted to HO2 by reaction with CO (R14) as they pass through the reaction tube. Air (~ 5
30
SLM) from the reaction tube is sampled by the FAGE detection cell (held at approximately 31
1.5 Torr) via a 4 mm diameter pinhole nozzle sat on a 5 cm tall turret. Ambient HO2 (and
10 ambient OH which was converted to HO2 in the reaction tube) is titrated to OH by NO
1
injected into the cell 7.5 cm below the nozzle and detected by LIF; 100 SCCM of NO was 2
injected into this fluorescence cell to maximise the conversion of HO2 to OH. In ROx mode,
3
25 SCCM of a 500 ppmv NO standard in N2 (BOC) was added to the CO flow to promote
4
conversion of RO2 to OH (R3 – R5); the excess CO present rapidly converts OH to HO2
5
(R14) and helps to minimise the overall loss of the radicals to the walls of the reaction tube. 6
Ambient RO2, HO2 and OH radicals (converted to HO2 in the reaction tube) enter the FAGE
7
detection cell, are reconverted to OH by NO and detected as described above. 8
2 2
O
CO HO
CO
OH 2 (R14)
9
2.2 Time-resolved experiments using laser flash photolysis 10
The time-resolved setup was based on a laser-induced pump and probe OH reactivity 11
technique developed by Sadanaga et al. (2004) which uses pulsed 266 nm light to photolyse 12
ozone in a flow tube to generate O(1D) and, by the subsequent reaction of O(1D) with H2O
13
vapour, OH radicals (R1 – 2). The flow tube used here was 173 cm in length with an internal 14
diameter of 5 cm; a schematic of the experimental set-up is shown in Figure 2. The total flow 15
was typically 11 SLM and the pressure in the flow tube was 300 Torr, which was controlled 16
by a valve throttling a rotary pump (Leybold xxx). It should be noted that at the pressures 17
employed in the experiments, the high pressure limit of any pressure-dependent reactions 18
taking place in the flow tube will have been reached and the results presented will be 19
applicable to atmospheric conditions. A FAGE cell was located approximately halfway along 20
the flow tube, held perpendicular to the flow tube, and sampled the gas flow through a 1 mm 21
diameter pinhole nozzle that was located within 1 cm of the central axis of the flow tube. At 22
the flow rates and pressure employed, the residence time in the flow tube before sampling 23
was ~ 4 s. A YAG laser (Spectron SL803) was used to generate ~10 mJ pulse-1 of 266 nm 24
photolysis radiation with a 10 ns pulse width. The laser beam profile was shaped using a 25
Galilean telescope to produce a collimated beam with a diameter of ~2 cm and directed along 26
the flow tube such that the outer edge just illuminated the pinhole – gauged by the silhouette 27
of the beam profile at the end of the tube. 28
The FAGE expansion cell was pumped by a rotary / roots blower pump combination 29
(Leybold xxx/yyy), which reduced the pressure in the expansion cell to 1 Torr, and typically 30
11 the flow tube via the rotary pump. The expansion cell was 4.5 cm in internal diameter with 1
the fluorescence detection axis ~ 23.5 cm from the pinhole. An excimer (Lambda Physik 2
LPX105) pumped dye laser (Lambda Physik FL3002) operating on Rhodamine 6G generated 3
visible light which was frequency doubled to 307.844 nm and used to probe the OH radical 4
via the Q1(1) (A-X) (0-0) transition; typical pulse energies and pulse lengths were 0.2 mJ
5
pulse-1 and 20 ns respectively. The radiation was directed into the detection axis via a baffled 6
entrance arm and the fluorescence was captured by a filtered (Barr Associates), gated CPM 7
(Perkin Elmer) mounted at right-angles to the laser beam. The pump and probe lasers were 8
typically operated with a pulse repetition frequency of 2.5 Hz. 9
A LabViewTM program controlled the experiment via a GPIB interfaced to a delay generator 10
(Berkley Nucleonics Corporation, BNC 555) and an oscilloscope (LeCroy LT264). The time 11
between the photolysis and probe lasers was controlled by the delay generator, and OH time 12
profiles were built-up by scanning the delay between the lasers over 200 points. At each time 13
point the OH fluorescence signal was integrated across its entire decay on the oscilloscope 14
before being transferred for storage on the computer. 15
Gases were introduced to the flow tube via calibrated mass flow controllers (MKS). Nitrogen 16
(10 SLM), was passed through a water bubbler (HPLC grade) and then into a manifold to mix 17
with oxygen (1 SLM), ozone (≤ 10 standard cubic centimetres - SCCM) and a reagent gas (≤ 18
40 SCCM), before admission into the flow tube. Although the O2 mixing ratio of the total
19
flow was only ~0.1, this was sufficient to drive completely RO2 formation in the flow tube
20
(and OH formation within the FAGE cell in the presence of NO), and so behaves in the same 21
way as an O2 fraction of 0.2. Ozone from an ozone generator (Easelec, ELO-3G) was used
22
directly to fill a 5 L Pyrex bulb, and then pressurized with nitrogen (up to 2 bar) to give 23
concentrations between 1 – 3%. The reagent gases, methanol, n-butane, n-pentane, ethene, 24
isoprene and cyclohexane were degassed by freeze pump thawing, and known concentrations 25
were prepared in Pyrex 5 L bulbs. Pressure gauges (MKS) were used to determine the bulb 26
concentrations and the pressure in the flow tube and FAGE cell. 27
The OH generated (approximately 1010 molecule cm-3) via the photolysis of ozone in the 28
presence of H2O vapour (R1 – 2) reacted rapidly with the added reagents (at a rate of >1000
29
s-1) in the presence of O2 forming peroxy radicals (R6) or in the case of methanol, HO2
30
12 O
H OH CH OH
CH
OH 3 2 2 (R15)
1
O CH HO
O OH
CH2 2 2 2 (R16)
2
or 3
O H O CH OH CH
OH 3 3 2 (R17)
4
O CH HO
O O
CH3 2 2 2 (R18)
5
OH reacts with methanol, predominantly forming CH2OH (reported yields of 0.75 – 0.85
6
(Atkinson et al., 2004)) (R15) which then rapidly reacts with O2 (9.6 × 10⁻¹² cm3 molecule-1 s
-7
1
) (Atkinson et al., 2004) to form HO2 (R16). The other, minor, abstraction channel produces
8
CH3O, which reacts slower with O2 (1.92 × 10⁻¹⁵ cm3 molecule-1 s-1) (Atkinson et al., 2004)
9
to produce HO2 (R17, 18). HO2 generated in the system was detected by adding nitric oxide
10
(NO – 99.95%, BOC) to the FAGE expansion cell (Fig. 2) to titrate to OH for subsequent 11
detection (R5). The NO flow, controlled by a mass flow controller (Brookes) (0 – 50 SCCM), 12
was injected into the centre of the FAGE cell, via 3.2 mm stainless steel tubing, 13
approximately 13.75 cm below the pinhole. The fluorescence signal observed when NO was 14
added to the expansion cell derived from OH and converted HO2 (OH + HO2), where is
15
equal to the titration efficiency of reaction R5, which is a function of the amount of NO 16
added and the contact time in the expansion cell. For complete conversion of HO2 to OH in
17
the detection cell will equal 1. If this is the case, in the presence and absence of methanol 18
there should be no overall change in the initial fluorescence signal when NO was added as the 19
OH lost in reaction R15 is rapidly converted to HO2 in reaction R16 and then back to OH via
20
reaction with NO. In the time-resolved experiments, a 6 SCCM flow of NO was found to 21
provide the maximum conversion of HO2 to OH (close to 100%).
22
2.3 Model comparison 23
The measured HO2 yields from the different RO2 species studied have been compared with
24
model predictions based on the Master Chemical Mechanism (MCM) version 3.2 25
(http://mcm.leeds.ac.uk/MCM/home.htt) (Jenkin et al., 1997; Carslaw et al., 1999b; Saunders
26
et al., 2003; Jenkin et al., 2003; Bloss et al., 2005). The chemical reactions which convert the 27
various VOC tested to OH that were incorporated in the model are listed explicitly in the 28
13 react with O2 to form a carbonyl species and HO2 or decompose (or in the case of the >C3
1
alkane-derived alkoxy radicals, isomerise) to form a hydroxyalkyl radical. Within a low 2
temperature FAGE expansion, however, in the presence of NO, the reaction of alkoxy 3
radicals and NO may begin to compete as the rate of decomposition and isomerisation slows 4
considerably at reduced temperatures (as discussed further in Section 4, temperatures may 5
drop as low as 25 K within the jet and remain below ambient temperatures in the region 6
between NO injection and detection (Creasey et al., 1997b)). To account for this, (R19) has 7
been included in model predictions with all rate coefficients for the reaction of various RO 8
radicals with NO taken from the review paper by Heicklen (2007). 9
RONO NO
RO M (R19)
10
For reactions between alkoxy radicals and NO which do not have reported rate coefficients, 11
NO RO
k 3.3 × 10⁻¹¹ cm3molecule-1s-1, (average rate coefficient for reaction of C3 – C5 RO
12
radicals with NO) was assumed. The model was initialised with the radical concentrations 13
used and [NO] and [O2] which encompassed experimental conditions within the FAGE
14
expansion cell. The concentrations of all other intermediate species or products were 15
initialised as zero. [NO] was varied between 1 × 10¹³ – 1 × 10¹⁵ molecule cm-3 depending 16
upon the NO flow rates introduced to each of the FAGE detection cells. For the large FAGE 17
detection cell (of the style cell A), good agreement between the model and experiment is only 18
achieved if the concentration of NO in the jet is lower than that calculated from the initial NO 19
injection flow rate suggesting that the mixing within the jet is poor for this cell (see section 20
4.2 for further details). The simultaneous rate equations were solved using an Excel based 21
integrator, Kintecus (Ianni, 2002). The model runs were 80 ms in duration, which provided 22
sufficient time for complete conversion of peroxy radicals to OH under the time-resolved 23
experimental conditions discussed above. 24
3 Results 25
3.1 RO2 interferences in HO2 measurements using fieldwork FAGE 26
instrumentation 27
A variety of RO2 species were generated in the turbulent flow reactor and introduced into the
28
three FAGE cells, A-C (Fig. 1) described in section 2.1.1. The yield of OH from the different 29
RO2 species for the different cells is given in Table 1. The flow reactor produces OH and
14 HO2 in equal quantities in the absence of a hydrocarbon (Fuchs et al., 2011). Upon addition
1
of a hydrocarbon all the OH generated is quickly consumed (on a timescale of the order of 2
1×10⁻⁴ s) and RO2 radicals form. In the case of propane or methane, the RO2 formed does not
3
yield appreciable OH (via the formation of HO2) in the FAGE expansion cells in the presence
4
of NO (as shown by the time-resolved experiments, section 3.2, the OH yield from propane 5
was <4%), and so any fluorescence signal observed upon NO addition relates solely to the 6
co-generated HO2. The yield of OH from RO2i species can be determined by comparing the
7
fluorescence signal observed when a RO2i species was present (HOx signal(reagent)) with the
8
OH yield from HO2 alone (HO2 signal in the propane or methane experiments, which have no
9
interference) using Eq. 1: 10
signal HO
signal HO
signal HO
yield OH Relative
2
2 (reagent)
x
(1)
11
The flows of hydrocarbons were adjusted so that equivalent OH reactivities (kHC+OH[HC]) for
12
each of the hydrocarbons tested were used to ensure that any other loss of OH in the turbulent 13
flow reactor (e.g. loss to walls) did not bias the relative yields determined. 14
In a number of experiments the NO concentration added to detection cell A was varied and 15
the ratio of the OH signal observed for propane-derived RO2 radicals relative to
ethene-16
derived RO2 radicals were compared and are shown in Table 1 and Figure 4. As the NO
17
concentration was reduced the interference from alkene-derived RO2 radicals decreased. By
18
varying [NO], it becomes possible to discriminate ambient RO2 radicals from ambient HO2
19
radicals and this is discussed further in Section 4.2. 20
3.2 Time-resolved experiments 21
To determine the absolute yield of OH from different RO2 radicals in the presence of NO, a
22
range of RO2 radicals (or HO2 in the case of methanol) were generated by the addition of
23
different parent hydrocarbons to the flow tube described in Section 2.2 coupled to a FAGE 24
cell in which there was sufficient time for complete conversion of RO2 to OH. The
time-25
resolved flow tube experiments were not performed on a field instrument used for ambient 26
HO2 detection and so the purpose of these experiments, rather than gauge the level of
27
interference suffered, was to experimentally determine the yield of OH from a range of RO2
28
15 experiments enabled long reaction times to be reached, allowing the conversion of RO2 to
1
OH to proceed to completion, and providing a measure of the asymptotic yields of HO2.
2
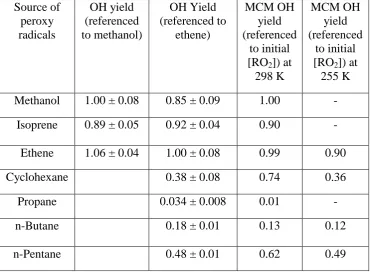
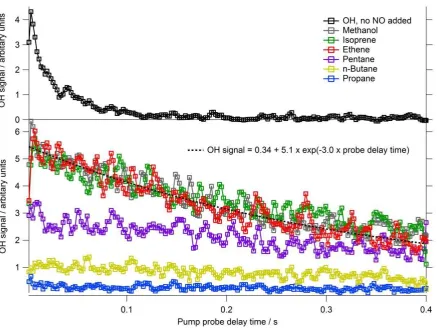
The time-resolved OH signals observed for a selection of RO2 species tested are shown in
3
Figure 3, and Table 2 summarises the OH yields for all RO2 investigated. In the absence of
4
reagent, an OH signal was observable (upper panel, Fig. 3) which decayed at a rate of ~25 s-1. 5
This loss can be attributed to reaction of OH with ozone that was present and diffusion of the 6
radical out of the photolysis beam area. Upon addition of a reagent to the flow tube, OH was 7
converted to RO2 at >1000 s-1. This rapid conversion ensured that the different RO2 generated
8
were present at the same concentration as each other (allowing relative yields to be 9
determined) and that all the OH initially generated was consumed in the flow tube (given the 10
residence time of 4 s) thus allowing a single exponential fit to be applied to the RO2 signals
11
displayed in the lower panel of Figure 3. The slow decay (~5 s-1) of the radical signal, 12
displayed in the lower panel of Figure 3, may be attributed primarily to diffusion of the 13
radicals out of the photolysis beam area and, to a lesser extent (no greater than 1 s-1), to 14
radical-radical reaction. 15
As the initial OH concentration generated and subsequent HO2 or RO2 concentration
16
generated within the flow tube were uncalibrated, the absolute OH yields within the FAGE 17
expansion cell from the different RO2 species were determined by comparing with the OH
18
signal observed from HO2 generated in the methanol experiments which has a 100% yield.
19
An exponential function of the form: OHsignal y0 Aexp(-Bprobedelay time) was 20
fitted to each OH temporal profile associated with the different RO2 species investigated. To
21
determine the relative yields of OH, the ratio of the A factor for each fit relative to the A 22
factor determined for the methanol fit was calculated using Eq. 2: 23
(methanol) (reagent):A factor factor
A yield OH
Relative (2)
24
In agreement with Fuchs et al. (2011), a large OH yield from alkene-derived RO2 radicals
25
was observed (see Table 2) when NO was present in the FAGE cell. Smaller, but still 26
significant, OH yields were also observed for RO2 radicals derived from cyclohexane,
n-27
butane and n-pentane (Table 2); the OH signal observed for propane-derived RO2 radicals
28
16 In several experiments, it was found that ethene-derived RO2 radicals when compared to HO2
1
from methanol had OH yields greater than one. The formation of -hydroxy peroxy radicals 2
is fast in the flow tube, and, if complete RO2 titration to HO2 and ultimately to OH was
3
occurring in the FAGE cell then the ratio of the OH signals observed in the presence of 4
ethene and methanol would be expected to equal one; a value greater than one suggests 5
incomplete conversion of methanol to HO2 in the flow tube. It was observed in experiments
6
where the Pyrex bulb containing methanol was left for a full day before use to allow for 7
mixing rather than just a couple of hours, that yields closer to one were obtained indicating 8
that in several of the experiments there may have been insufficient methanol reaching the 9
flow tube owing to extremely slow mixing of the gas bulb. To ensure that the results are not 10
biased by a possible problem with methanol, column 2, Table 2 only includes relative OH 11
yields calculated when the methanol bulb had been left for a day or longer. As this constraint 12
limited the amount of data available, a third column which presents the OH yields referenced 13
with respect to ethene (calculated using Eq. 3) is also provided: 14
(ethene) (reagent):A factor factor
A yield OH
Relative (3)
15
4 Discussion 16
4.1 Time-resolved experiments. Measured and modelled HO2 yields following 17
complete conversion of RO2 18
Under conditions optimised for complete conversion of RO2 radicals to OH in a FAGE cell
19
with added NO, i.e. very long reaction times, the yield of HO2 from a number of
alkene-20
derived RO2 species compares favourably to the MCMv3.2 predictions of the OH yield
21
determined using Eq. 4 after a reaction time of 9.8 ms, as shown in Table 2, suggesting that 22
the yield of HO2 from other RO2 species not measured here can be derived with some
23
confidence from MCM predictions for this particular experimental set-up. 24
] [RO d initialise model
generated [OH]
modelled yield
OH M CM
2
(4)
25
For >C3 alkane-derived RO2 species, the MCM also predicts a non-zero HO2 yield. For these
26
species, reaction with NO produces an alkoxy radical which can react with O2 or isomerise
27
forming a -hydroxyalkylperoxy radical in the presence of O2, which for the case of n-butane
28
17 2
9 4 2
9
4H O NO C H O NO
C (R20)
1
8 4 isom.
9
4H O (HO)C H
C (R21)
2
2 8 4 2
8
4H O (HO)C H O
(HO)C (R22)
3
The alkoxy radical, C4H9O, may also react with NO under FAGE conditions:
4
ONO H C NO O H
C4 9 4 9 (R23)
5
As shown in reactions (R8 – R11) the -hydroxyalkylperoxy radical can react further with 6
NO and decompose rapidly in the presence of O2 to form HO2. However, as seen in Table 2,
7
the MCM over-predicts the yield of HO2 at 298 K from n-pentane and cyclohexane derived
8
peroxy radicals, and under-predicts the OH yield from n-butane-derived alkanes. The 9
modelled to measured agreement for n-pentane and cyclohexane derived RO2 radicals can be
10
improved if the rate coefficient for isomerisation (R21) is reduced by assuming a lower 11
temperature; it was found by varying the temperature in the model that 255 K provided the 12
best agreement for all RO2 species considered (Table 2). In the case of cyclohexane, the rate
13
coefficient for isomerisation (taken from the MCMv3.2) decreases from 6.3 × 10⁴ s-1 to 2.1 × 14
103 s-1 as the temperature was reduced from 298 K to 255 K. Stevens et al. (1994) report a 15
temperature of 245 K within the Penn State FAGE instrument as an airstream enters the 16
detection cell and accelerates to velocities of >300 ms-1; at the laser detection axis the 17
velocity is reduced to ~50 ms-1 and the air temperature increases to ambient levels once more. 18
Similarly, measurements of rotational temperatures and computational fluid dynamic (CFD) 19
calculations performed to determine the temperature and density profiles of an airstream 20
within a Leeds FAGE detection cell, type A (Fig 1a), suggest that air temperatures drop as 21
low as 25 K in the first 2 cm in the detection cell beneath the pinhole as the airstream 22
expands supersonically and reaches velocities of 750 ms-1 before slowing and increasing back 23
to ambient temperatures at the detection axis (Creasey et al., 1997b). Taking these 24
temperature profiles into account, it is expected that the mean temperature experienced 25
between pinhole and the detection axis will be below ambient and if this is the case the rate 26
coefficient for isomerisation will slow considerably (Orlando et al., 2003). At lower 27
temperatures the reaction between an alkoxy radical and NO (R19) can begin to compete with 28
the isomerisation reaction (R21) and can, as a result, lower the overall OH yield observed 29
from these RO2 radicals. This effect reduces the agreement between the experimental and
18 modelled OH yield from n-butane-derived RO2 further suggesting that the rate coefficient for
1
isomerisation of the C4H9O alkoxy radical may actually be faster than assumed in the model.
2
There is very little information on the temperature dependence associated with the rate of -3
hydroxyalkoxy decomposition in the literature. A theoretical temperature dependence for the 4
rate of decomposition of ethene-derived -hydroxyalkoxy radical has been reported (Kukui 5
and Le Bras, 2001): 6
RT ole] 41.84[KJ/m 1
13 decomp. 1.1 10 [s ].e
k (5)
7
When this temperature dependence is included in model calculations, assuming a temperature 8
of 255 K, the OH yield predicted is reduced by ~ 10% from calculations assuming a 9
temperature of 298 K (Table 2) as the rate coefficient for decomposition decreases from 5.1 10
× 105 s-1 to 3.0 × 10⁴ s-1. Although likely to be similar to that of the ethene-dervied alkoxy 11
radical, no information on the temperature dependence of isoprene-derived alkoxy radical 12
decomposition exists in the literature so the impact on the OH yield at reduced temperatures 13
is not considered here. 14
4.1.2 Magnitude of the interference for fieldwork instruments 15
For the three fieldwork FAGE cells tested (Fig. 1) which have different residence times and, 16
hence reaction times for RO2 conversion to OH, the yield of OH from the alkene-derived RO2
17
radicals was variable. For cell A, CFD calculations have demonstrated that the air stream is 18
significantly accelerated within the cell (and, in turn, is significantly cooled), owing to the 19
supersonic expansion after the small diameter, 1 mm, pinhole. Similar acceleration and 20
cooling may be assumed for cell B as a 1 mm pinhole was again used. In cell C, air entered 21
the FAGE cell through a 4 mm pinhole and so the same level of acceleration or cooling, as 22
predicted in cell A, is not expected. For cell C, it may be expected that NO should mix 23
reasonably well with the ambient air stream also. The best agreement between the MCM 24
predictions and experimental results occurs if a contact time (and [NO]) of ~0.9 ms (and 25
1×10¹⁴ molecule cm-3), ~1.9 ms (and 1×10¹⁴ molecule cm-3) and ~ 70 ms (and 9.5×10¹⁴ 26
molecule cm-3) is assumed for cell A, cell B and cell C (Fig. 1) respectively at a temperature 27
of 255 K for cells A and B and 298 K for cell C. For cell A, a residence time from pinhole to 28
detection region of <1 ms has been calculated using CFD (Creasey et al., 1997b) and 29
19 which the modelled yields best agree with the experimental relative yields, Table 1). As it is 1
difficult to calculate the cell residence absolutely, due to the free-jet expansion that occurs, 2
comparison of the yields with model predictions provides a means to gauge the time spent 3
between the NO injection region and detection region experimentally. Uncertainty in the 4
residence time may arise, however, if the NO injected into the cell does not fully mix with the 5
sampled air stream or if the mean temperature of the airstream is not considered or known. 6
Qualitatively, the extent of the interference suffered is directly proportional to residence time 7
within the jet and inversely proportional to the mean temperature experienced by the jet (Eq. 8
6). At ambient temperatures, increasing the NO concentration will lead to an increase in the 9
interference; at reduced temperatures, however, the impact of NO becomes more complex: 10
Increasing the concentration of NO will increase the rates of reactions R3 and R5 but also 11
increases the rate of reaction R19. For alkoxy radicals which display a strong temperature 12
dependence with respect to isomerisation, as is the case for the alkoxy radical derived from 13
cyclohexane (CHEXO), increasing NO concentrations beyond a certain concentration may 14
actually lead to a reduction in the level of interference observed as R19 begins to compete 15
effectively with R21. Model simulations looking at the yield of OH from cyclohexane-16
derived RO2 radicals at 255 K predict that at a residence time of 9.8 ms (time over which
17
time-resolved experiments were run) the yield of OH will increase with increasing [NO] until 18
a NO concentration of 1.2 × 10¹⁴ molecule cm-3 is reached and then the yield will begin to 19
decrease as [NO] increases further. Note, if the residence time is increased, less NO is 20
required to achieve the maximum yield and vice versa. Under the experimental conditions 21
discussed in this paper the OH yield should have been directly proportional to [NO]: 22
e Temperatur
[NO] time
Residence
ce
Interferen (6)
23
Fuchs et al. (2011) observed a large under-prediction of the OH yield from cyclohexane-24
derived RO2 radicals in the presence of NO and suggested that the model under-prediction for
25
the yield of OH from this species may reflect a missing ring opening mechanism in the MCM 26
which could promote further HO2 formation. Fuchs et al.(2011) used MCMv3.1 which did
27
not contain a ring opening mechanism to estimate the expected level of interference in the 28
Julich FAGE system. An additional degradation pathway for CHEXO which includes a ring 29
opening route, is included in MCMv3.2 leading to the yield of HO2 (and ultimately OH,
20 following further reaction) from cyclohexane-derived RO2 radicals approximately doubling
1
when switching from MCMv3.1 to MCMv3.2 chemistry. 2
4.2 Minimising the RO2 interference further 3
As highlighted in Table 1, a decrease in the amount of NO injected into cell A reduces the 4
OH yield from ethene-derived RO2 radicals. Reducing the sensitivity of the instrument to the
5
interference, however, leads to a concomitant reduction in HO2 sensitivity. As only one NO
6
molecule is required to titrate one HO2 radical to OH, whilst two or more are required for
7
RO2 to OH titration, it is possible to begin to discriminate between HO2 and RO2 by reducing
8
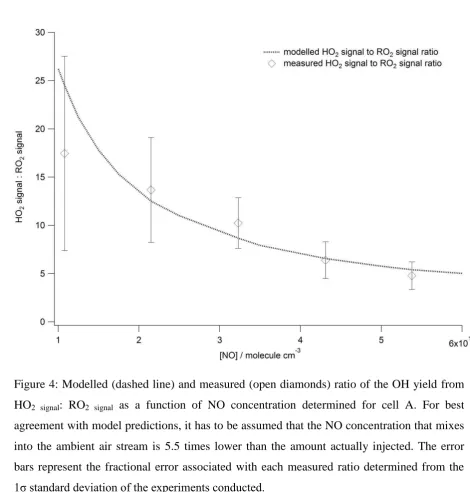
the amount of NO mixed into the jet as shown in Figure 4. For cell A, at an NO concentration 9
of 1 x 10¹³ molecule cm-3, approximately twenty HO2 radicals titrate to OH for one RO2i
10
radical conversion to OH; determined from the ratio ‘relative OH yield (propane) : relative 11
OH yield (ethene)’ with ‘relative OH yield’ calculated using Eq. 1. At this NO concentration 12
the 5 minute limit of detection of the instrument for HO2 will be ~ 4 x 10⁶ molecule cm-3 and,
13
although higher than detection limits from earlier campaigns (e.g. the HO2 LOD during the
14
SOAPEX campaign which took place in Cape Grim in Australia was 5.4 x 10⁵ molecule cm-3 15
for 2.5 minute integration time) (Creasey et al., 2003), the instrument remains sufficiently 16
sensitive for ambient HO2 detection with minimal RO2 interference (~5%). It should be noted
17
that agreement between the MCMv3.2 model and observations can only be achieved if it is 18
assumed that 5.5 times less NO is mixed fully into the air sample within the FAGE cell than 19
is actually injected. Even when a reduced [NO] is assumed, the model predicted HO2:RO2
20
ratio vs [NO] is not wholly consistent with the ratio observed experimentally. As displayed in 21
Figure 4, the observed ratio increases slower than the model predicts as [NO] decreases (most 22
apparent at the lowest [NO]) suggesting an enhanced RO2 OH conversion relative to HO2
23
OH conversion. This observation may indicate that HO2 is preferentially lost in the cell
24
compared to RO2 radicals, potentially, by more efficient removal of HO2 relative to RO2 by
25
H2O clusters (Creasey et al., 2001). This finding only serves to further highlight the need to
26
experimentally determine the level of interference for each individual FAGE system and 27
specific experimental conditions. 28
As demonstrated by Figure 4, by varying the amount of NO injected it is possible to switch 29
from conditions where certain RO2 types are efficiently converted to OH (NO > 5×10¹³
30
21 knowledge of the conversion efficiency of RO2 and HO2 at different NO concentrations,
1
changing the NO flow during ambient measurements can selectively provide a measurement 2
of the concentration of RO2i and HO2 by solving simultaneous equations (E7 and E8):
3
i]) [RO ]
([HO C
signal
HOx low[NO] HO ,low[NO] 2 low[NO] 2
2
(7)
4
i]) [RO ]
([HO C
signal
HOx high [NO] HO ,high [NO] 2 high [NO] 2
2
(8)
5
where HOx signal is the fluorescence signal observed in cts s-1 mW-1, CHO2is the sensitivity 6
of the instrument to HO2 (determined by calibration) at a particular NO flow in units of cm3
7
molecule-1 ct s-1 mW-1and is the mean fractional contribution of RO2i at a selected [NO].
8
During a recent field project, the Clean air for London campaign (ClearfLo), this approach 9
was adopted during ambient measurements. The NO concentration injected into a FAGE cell 10
(cell type A) used during the campaign for sequential measurements of OH and HO2 was
11
varied between ~1 and 9×10¹³ molecule cm-3; a measurement of the total [RO2] was
12
determined simultaneously using the ROxLIF cell C operating in ROx mode. The campaign
13
average diurnal profile of HO2, alkene/aromatic or long-chain alkane-derived RO2 and
short-14
chain alkane-derived RO2 radicals selectively measured is provided in Figure 5. The [HO2]
15
(red) and [RO2i] (mustard, alkene and aromatic RO2 species)) have been derived using
16
Equation 7 and 8 (i.e. from HO2* signal observed when using cell A at high and low NO
17
flows; with the sensitivity to HO2 and RO2i determined experimentally at the two NO flows
18
used). The C1-C3 alkane-derived [RO2] (green) was determined from cell C detection of total
19
[ROx] with the derived [HO2] and [RO2i] subtracted.In generating Figure 5, it was assumed
20
that all RO2i had the same conversion efficiency ( ) as ethene-derived RO2. This assumption,
21
whilst reasonable for other RO2 radicals derived from other alkenes or aromatic VOC, may
22
positively bias the [RO2i] and negatively bias [HO2] calculated if longer-chain alkane-derived
23
RO2 ( C4) which have a lower were present at significant levels. Preliminary box
24
modelling studies run for the ClearfLo project, which were constrained by the measurements 25
of a wide range of VOCs of various classes, demonstrate that aromatic and alkene RO2
26
species do dominate RO2i, with C4 alkane-derived RO2 species only contributing 7 % to all
27
RO2i identified on average. For this particular environment at least (and likely applicable to
28
many others), determining HO2 and RO2i by the methodology discussed here may provide
29
22 An alternative approach to partial speciation of RO2 radical classes would be to use two
1
FAGE cells in which the RO2 interference is minimised in the first (e.g. cell A, run at a low
2
[NO]) and maximised in the second (e.g. cell C, HOx mode, run at a high [NO]).
3
4.3 Impact on previous field studies 4
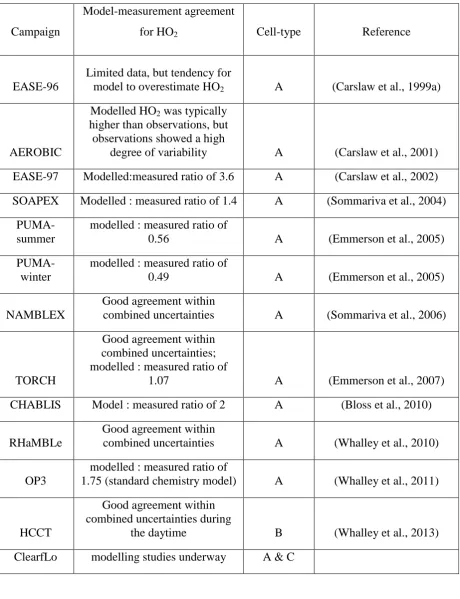
The University of Leeds ground-based FAGE instrument has been operational since 1996 and 5
has taken part in 17 campaigns with HO2 measurements made during 13, see Table 3 for
6
further details. In some of the earlier campaigns good conversion of HO2 to OH was achieved
7
as two independent cells were used (Smith et al., 2006), with the conditions of one cell 8
optimised for HO2 detection, and so a significant portion of interfering RO2i, if present, may
9
also have been titrated to OH, constituting an interference. Many of the previous campaigns 10
took place under relatively clean, unpolluted conditions, for example EASE-96 (Carslaw et 11
al., 1999a), EASE-97 (Creasey et al., 2002; Carslaw et al., 2002), SOAPEX (Creasey et al., 12
2003; Sommariva et al., 2004), NAMBLEX (Sommariva et al., 2006), CHABLIS (Bloss et 13
al., 2010), RHaMBLe (Whalley et al., 2010) where the concentrations of RO2i are likely low
14
and methyl peroxy radicals, which do not give an interference (Ren et al., 2004), were 15
expected to be the dominant RO2 species; e.g. during EASE-96 the model predicted that 92%
16
of peroxy radicals present were either HO2 (53%) or CH3O2 (39%) during unpolluted
17
conditions (Carslaw et al., 1999a). Similarly, for the SOS project (Vaughan et al., 2012), 18
which took place in Cape Verde, models predicted that ~90% of peroxy radicals were either 19
HO2 or CH3O2. In general, models run for these campaigns tended to over-predict HO2
20
despite additional HO2 loss mechanisms such as reaction with halogen oxides and/or
21
heterogeneous loss to aerosol surfaces in the model description. In contrast, under polluted, 22
urban conditions (e.g. PUMA (Heard et al., 2004), TORCH-1(Emmerson et al., 2007)) 23
models either significantly under-predicted HO2 observations (PUMA) (Emmerson et al.,
24
2005) or were in relatively good agreement (TORCH-1 ) (Emmerson et al., 2007). If elevated 25
concentrations of alkene-derived, aromatic-derived and higher-alkane derived RO2 species
26
were present, the true ambient HO2 concentrations, as opposed to HO2*, were likely lower
27
than reported. It is possible, although difficult to verify without observations of speciated 28
RO2, that the conclusions drawn from these observations, for example, that additional HO2
29
23 Under the operating conditions employed during the OP3 campaign, the instrument was 1
relatively insensitive to detection of RO2 species. The experiments presented here reveal a
2
17% yield of OH due to the decomposition of ethene-derived RO2 in the presence of NO in
3
the FAGE detection cell under OP3 conditions. This provides an upper limit to the HO2 yield
4
from RO2 species during OP3 as, under conditions in which the interference signal was
5
maximised (Section 3.2), ethene-derived RO2 species provided the largest HO2 yield
6
compared with other RO2 species. Model simulations (Whalley et al., 2011) suggested that up
7
to 2.1 × 10⁸ molecule cm-3 of potentially interfering RO2 species were present at solar noon
8
during OP3 (with isoprene derived peroxy radicals contributing ~60% to this total), and thus 9
up to 3.5 × 10⁷ molecule cm-3 of the HO2 concentration may be attributed to these species
10
(~10% of the total HO2 signal observed (Whalley et al., 2011)). Model comparisons with the
11
radical measurements made during the campaign demonstrated a large missing OH source 12
and over-predicted the HO2 observations. The small positive bias on the HO2 observations,
13
owing to the small yield of HO2 from RO2 species, only serves to reduce the modelled to
14
measured agreement further. For the HCCT-2010 campaign, the potential impact of the 15
interfering RO2 species is greater (Table 1) owing to the smaller cell (with a longer inlet) and
16
longer residence time employed. The campaign took place in a pine forest, close to the 17
summit of Mount Schmücke in the Thüringer Wald mountain range in East Germany, during 18
September and October 2010. VOC measurements were made downwind of the measurement 19
site. Only low concentrations of isoprene (50 pptv) were detected, however, suggesting that 20
the concentration of RO2i were also low.
21
5 Conclusions and further work 22
Recent studies conducted on a number of different fluorescence cells used in the FAGE 23
instrument at Leeds have demonstrated that alkene- and aromatic-derived RO2 species can
24
yield appreciable quantities of OH upon addition of NO in FAGE detection cells and, 25
therefore, positively bias HO2 observations if left uncorrected. Many FAGE groups now
26
report HO2* for comparison with atmospheric chemistry box models to include any
27
interference from RO2i. As demonstrated in this study, the magnitude of this interference is
28
critically dependent on the cell design, quantity of NO used in the titration, the residence time 29
and mean temperature of the air stream within the FAGE cell. The interference may be 30
minimised by reducing NO concentrations and/or residence time, and although such a 31
reduction will also reduce the sensitivity of the instrument to HO2 (albeit to a lesser extent
24 than the reduction in the sensitivity to RO2 radicals) it will still be possible to detect ambient
1
levels HO2 using FAGE.
2
In laboratory, laser-flash photolysis experiments, under conditions optimised for complete 3
conversion of RO2 radicals to OH in a FAGE cell, the yield of HO2 from a number of
alkene-4
derived RO2 species could be measured, and compared favourably with MCMv3.2
5
predictions. This suggests that the yield of HO2 from other alkene-derived or
aromatic-6
derived RO2 species not tested here, but which are expected to exhibit high yields, could be
7
determined from MCM predictions. The ability to discriminate between HO2 and RO2i
8
radicals, as illustrated for the ClearfLo project, is not only of great value for field 9
measurements (and subsequent model comparisons), but such instrumentation may be used to 10
selectively determine the yield of HO2 in laboratory experiments under conditions where RO2
11
radicals may also be present. Important applications, for example, would be the experimental 12
verification of a significant prompt HO2 yield from OH initialised isoprene oxidation, as
13
proposed by Peeters et al. (2009) or prompt HO2 yields from OH initialised oxidation of
14
aromatics (Nehr et al., 2012). 15
This study demonstrates that some of the previous HO2 measurements that depend upon
16
chemical titration to OH by NO may suffer an interference due to partial detection of RO2
17
radicals. Under conditions where there are significant alkene, aromatic or long-chain alkanes 18
present, the HO2* concentration which was measured will have been higher than the HO2
19
concentration that was actually present. Models have over-estimated HO2 concentrations
20
under such conditions, and this over-estimation would only increase if the observations of 21
HO2 were corrected for the interference suggesting there is a major gap in our understanding
22
of the chemistry controlling these radicals. 23
24
Acknowledgements 25
We would like to thank the National Centre for Atmospheric Science (NCAS) for financial 26
support and EUROCHAMP is acknowledged for PWS. 27
References 28
Atkinson, R., Baulch, D. L., Cox, R. A., Hampson, R. F., Kerr, J. A., Rossi, M. J., and Troe, J.: Evaluated 29