This is a repository copy of The equalisation hypothesis and changes in geographical inequalities of age based mortality in England, 2002-2004 to 2008-2010.
White Rose Research Online URL for this paper: http://eprints.whiterose.ac.uk/84160/
Version: Accepted Version
Article:
Green, M.A. (2013) The equalisation hypothesis and changes in geographical inequalities of age based mortality in England, 2002-2004 to 2008-2010. Social Science & Medicine, 87. 93 - 98. ISSN 0277-9536
https://doi.org/10.1016/j.socscimed.2013.03.029
[email protected] https://eprints.whiterose.ac.uk/ Reuse
Unless indicated otherwise, fulltext items are protected by copyright with all rights reserved. The copyright exception in section 29 of the Copyright, Designs and Patents Act 1988 allows the making of a single copy solely for the purpose of non-commercial research or private study within the limits of fair dealing. The publisher or other rights-holder may allow further reproduction and re-use of this version - refer to the White Rose Research Online record for this item. Where records identify the publisher as the copyright holder, users can verify any specific terms of use on the publisher’s website.
Takedown
If you consider content in White Rose Research Online to be in breach of UK law, please notify us by
1
The equalisation hypothesis and changes in geographical inequalities of age based
mortality in England, 2002-2004 to 2008-2010
Abstract
The equalisation hypothesis argues that during adolescence and early adulthood, inequality in
mortality declines and begins to even out. However the evidence for this phenomenon is
contested and mainly based on old data. This study proposes to examine how age-specific
inequalities in mortality rates have changed over the past decade, during a time of widening
health inequalities. To test this, mortality rates were calculated for deprivation quintiles in
England, split by individual ages and sex for three time periods (2002-2004, 2005-2007 and
2008-2010). The results showed evidence for equalisation, with a clear decline in the ratio of
mortality rates during late adolescence. However this decline was not accounted for by
traditional explanations of the hypothesis. Overall, geographical inequalities were shown to
be widening for the majority of ages, although there was some narrowing of patterns
observed.
2
Introduction
The processes which create and maintain inequalities in mortality vary across a wide plateau
of social, individual and geographical factors. How these factors interact can be observed
through measuring inequalities by age. It is frequently assumed that social gradients are
consistent throughout the life course; however this is simply not true. Levels of inequality
vary in strength by age and do not always follow traditional social gradients. An often
ignored concept in the inequality literature regards the equalisation hypothesis. At any one
time during adolescence and early adulthood, the level of inequality in health outcomes
appears to attenuate between social groups and areas. This results in an apparent evening out
of geographical inequalities in health at those ages.
Evidence for this concept in England and the UK has so far been varied, with full (Dibben
and Popham, 2013; Macintyre & West, 1991; West, 1988; 1997), partial (Spencer, 2006;
West and Sweeting, 2004) and little support (Emerson et al., 2006) for such processes found.
An explanation is that support for the hypothesis tended to be stronger when mortality
measures were used, as opposed to morbidity or self-rated measures (although see West,
1997). This would suggest that using measures of mortality to research the hypothesis would
be better to assess its existence. Nevertheless evidence for the hypothesis outside of England
and the UK remains less supportive (c.f. Engström et al., 2003; Starfield et al., 2002;
Torsheim et al., 2004).
The phenomenon of apparent equalisation of mortality rates during these ages is not
necessarily due to greater improvements in health amongst the poor. Rather, those from the
less deprived areas have, in some cases, experienced increases in relative mortality risks,
bringing their rates more in line with the rates for disadvantaged areas. With adolescence
3 across social differences, flattening inequalities (Chen et al., 2006; West, 1997; West and
Sweeting, 2004). This has been mostly explained by reference to a few external causes of
mortality, especially road traffic accidents, as the more affluent are more likely to afford a car
when young (Dibben and Popham, 2013; Laflamme et al., 2004; West and Sweeting, 2004).
It helps explain why the equalisation hypothesis is more strongly associated with mortality
than compared to morbidity (although see Williams et al., 1997). However, this possible
increased risk taking is not apparent for other external risks such as drug-related deaths or
intentional self-harm, despite both causes of mortality being high among younger age groups
(Dibben and Popham, 2013).
Evidence surrounding the hypothesis and other information regarding varying levels of
inequality by age has been constrained by data limitations, resulting in out-dated studies. The
most recent study which found evidence of equalisation focused on the period of 1997 to
1999 (Dibben and Popham, 2013). However the England that existed over a decade ago is in
some key ways different to the society that currently exists. The release of the ‘Marmot
Review’ (Department of Health, 2010) once again highlighted the vast social gradients that
have become entrenched in the UK, to the extent that whilst life expectancy has continued to
rise throughout the 2000s, health based inequality has also continued to widen. As such,
those in the poorest areas will die on average seven years before those in the most affluent
areas, as well as experiencing greater levels of disability (ibid). These trends have been
replicated in mortality studies. Although mortality rates by area were widening during the
1990s (when most of this research was conducted) and have continued to widen since
(Langford and Johnson, 2010; Thomas et al., 2010), we still have to carefully check each
subsequent year’s data for any signs of a change in the trends. This combined with rising
levels of income inequality since the 1980s (OECD, 2011) and an economic recession with
4 the effect of mortality equalisation during adolescence might be diminishing. This is
especially the case since societal changes are more likely to be felt amongst the youth.
However to date there has been no attempt in the literature to examine the direction of these
trends and hence it is unknown whether this widening of geographical inequalities has
occurred for all ages. Based on this framework, the following hypotheses are proposed:
1. There is a decline in the level of inequality of mortality rates during late adolescence.
2. There are higher rates of mortality for land transport accidents in the least deprived
areas during late adolescence, unlike for the other main external causes of mortality.
3. Inequality in mortality rates has increased over time for all ages.
Methods
A similar framework to Dibben and Popham’s (2013) recent study was employed for this
analysis. To capture deprivation, the latest Indices of Deprivation (2010) measure for
England was used. Only the ‘income’ domain was used to differentiate between areas, to
avoid circularity issues as the overall index contains information on health and mortality, as
well as it being identified as the most important part of the measure (Department for
Communities and Local Government, 2011). The index is created for the Lower Super
Output Area (LSOA) level, a geographical scale which splits England into 32,482 evenly
sized areas with an average population size of 1500. This allows a detailed analysis through
capturing intricate differences in deprivation. Using the rankings provided, areas were split
into quintiles to differentiate between the types of areas. These areas were kept constant over
5 The mortality data used were gathered from the mortality statistics collected by the Office for
National Statistics (ONS). The database compiles information on each individual death in
England through civil registration records (Griffiths et al., 2005; Rooney and Smith, 2000).
This comprehensive data source contains information on year of death, age, sex, cause of
death and geographical location (postcode). Accessibility to the data set was approved by the
‘ONS Microdata Release Panel’ and ‘Approved Researcher Status’ was also granted,
allowing use of the data for research purposes. The quintiles of deprivation were joined to
the database and each quintile was aggregated, split by age and sex, to gain the total number
of deaths.
To further investigate the overall mortality rates by age and changes in them, data on various
external causes shown to be important in past analyses (Dibben and Popham, 2013;
Laflamme et al., 2004; West, 1997; West and Sweeting, 2004) were extracted from the
database. The relevant ICD-10 (International Classification of Diseases-10) codes to measure
external causes (Northern Ireland Statistics and Research Agency, 2010) were: land transport
deaths (V01-99), drug-related deaths (F11-16, 18, 19, X40-44, X85, Y10-14) and intentional
self-harm (X60-X84). Other causes were examined to explore new avenues for explanation.
Individual aged population data for LSOAs were compiled from mid-year estimates
requested from the ONS (0 to 85 and over). Using this data, totals were aggregated for each
age (split by sex) by each quintile. Data was split into three time periods, each containing
data for three individual years (2002-2004, 2005-2007 and 2008-2010). Rates (per 100,000)
were then compiled for each individual year of age, split by sex and area deprivation quintile.
To measure the level of inequality at each age, the Relative Index of Inequality (RII) was
calculated. This was chosen as it is a robust measure that accounts for the differences in
population sizes (Mackenbach and Kunst, 1997), given the variation of age groups between
6 hypothesis. The measure can be interpreted as the difference in the relative risk of mortality
between the most and least deprived areas. Additionally, the change in the RII between
periods was calculated and also plotted to display the temporal pattern.
Smoothing of the data was employed to reduce the impact of spurious and extreme data
points, to better visualise the general trend. With small quantities of data during younger
ages, the trend line was greatly affected by noise prior to smoothing. It also simplified the
data, moving towards a ‘slow change’ in trends (Hastie et al., 2009). This is more akin to the
hypothesis, which theoretically is less about sharp changes. As such, the results provide
greater focus with regards to this. Smoothing of these results was achieved through using
kernel-weighted local polynomial regression (Fan et al., 1995). It was chosen as the data
approaches the polynomial distribution. A Gaussian kernel, with first degree polynomial was
selected, with bandwidth kept minimal to improve the quality of the results (Hastie et al.,
2009).
Results
Figure 1 shows the smoothed RII for mortality rates by sex. For both sexes, there is a
distinct decline in inequality beginning in late adolescence, before flattening out and later
rising again in the mid-20s. This contrasts with the wide geographical inequalities observed
earlier in the life course. Although this pattern is similar to the equalisation hypothesis, the
scale shows whilst inequalities begin to narrow after age 15, the trend line does not reach true
equalisation (i.e. a value of zero). Despite evidence of equalisation, a social gradient remains
7 Figure 1: The smoothed relative index of inequality of mortality rates for deprivation
quintiles in England, 2008 to 2010.
After the age period of youth, inequalities begin to rise consistently for both sexes. As the
trend lines reach the age of 30, the gradient begins to differentiate itself between the sexes
slightly. For males the gradient continues at a high rate, whereas for females it begins
decline. Both trends peak at around a relative risk of mortality of three times higher in the
most deprived quintile than compared to the least, with this level of inequality being slightly
higher for males. For males, the trend falls at a greater rate than for females (later in the life
course), eventually converging around the 70s where it is consistently lower than for females.
As the trend lines approach the later stages of life, inequality finally begins to equalise
8
Males Females
(a) Drug Misuse (b)
(c) Land Transport (d)
(e) Intentional Self-Harm (f)
[image:9.595.72.527.72.687.2]
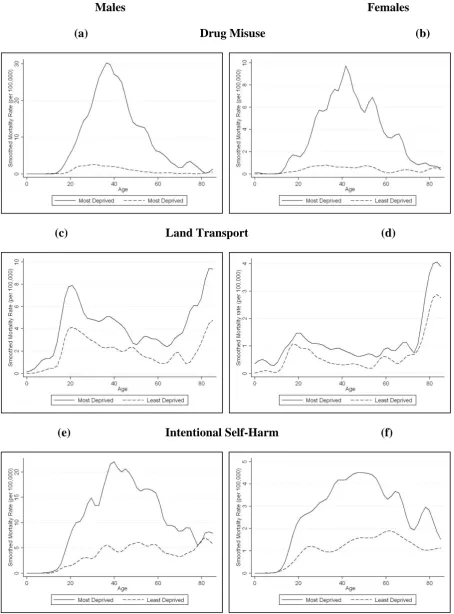
Figure 2: Variations in smoothed rates (per 100,000) of external causes of mortality by sex in
England, 2008-2010. (a) Male drug-related mortality rates; (b) Female drug-related
9 related mortality rates; (e) Male intentional self-harm mortality rates; (f) Female intentional
self-harm mortality rates.
Figure 2 shows the smoothed mortality rates in the most and least deprived quintiles for the
main causes of death for young people; land transport accidents, drug-related deaths and
intentional self-harm. The patterns follow similar paths for both genders and although
mortality rates are higher for males, the relative differences between quintiles are fairly
analogous. Mortality rates for the three causes are consistently higher across the life-course
within the most deprived quintile. During adolescence, there is no evidence for any of the
causes that this pattern reverses. Indeed for both intentional self-harm and drug-related
deaths, it is during adolescence that the trend lines begin to separate. For land transport
accidents, the relative difference is less in this period. The second hypothesis should
therefore be rejected.
However for each subgroup, the total mortality attributable to external causes of death never
exceeds 50 per cent of all deaths between the ages 16 and 21 (chosen to both incorporate the
period of risky behaviour, as well as where the equalisation period exists in Figure 1), for the
period 2008-2010. Examining the other causes which account for this will also help aid our
understanding of this period of declining inequalities. Many of these other causes, even once
aggregated into larger groups, did not contain useful numbers of deaths to make meaningful
comparisons. Comparing the ratio between the most and least deprived quintiles consistently
gave either an even value or was slightly higher in the most deprived areas. Only for
‘Hodgkin Lymphoma’ (C81) in males did the gradient reverse, but the numbers of deaths
involved were too small to be useful. Furthermore this did not hold for ‘Haematological
Cancers’ (C81-96) as a whole (where the rate for males in the most deprived areas (1.46 per
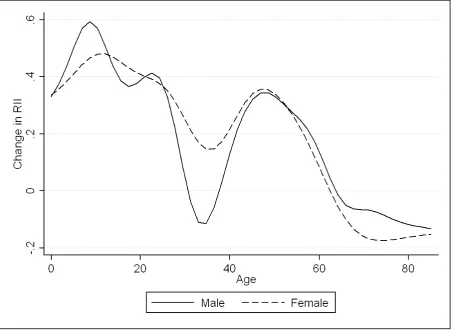
10 Figure 3: The smoothed change in the relative index of inequality of mortality rates for
England attributed to all causes between 2002-2004 and 2008-2010 (RII for 2008-2010
minus the RII for 2002-2004).
Calculating the same statistics in exactly the same way for the period 2002 to 2004 allowed
the examination of the changing trend in inequalities (Figure 3). What is found is that the
direction for the trend of inequality varies by age, with the majority of ages reporting
widening trends. The increase has been greatest during youth, which would indicate that the
process of equalisation is being eroded. There is a small decline for the ages between 30 and
40, where inequality was also shown to be widest, although this was only observed for males
(although the pattern for females does mirror this trend). Yet this decline in inequality is only
small and soon reverses. There is a more consistent narrowing of inequality late in the life
11 2008-10 (albeit with smaller changes) and when the 2004 Index of Multiple Deprivation for
grouping areas was used instead (results not shown).
The analyses were also performed using the full version of the Indices of Deprivation 2010
and also a different inequality measure (the ratio of mortality rates between the most and least
deprived quintiles). This was to check that the patterns remained stable and were not
sensitive to methodological differences. Overall, patterns remained the mostly the same, with
evidence found for the equalisation hypothesis and widening inequality over time (results not
shown). However one difference was that with using the full index, during adolescence the
mortality rate for land transport accidents (as a result of car-related deaths) was slightly
higher in the least deprived areas for both genders than compared to the most deprived areas.
Therefore it may be important, although given the circularity issues involved with the
measure (as it includes a measure of premature mortality rates), this finding should not be
taken.
Discussion
Health inequalities in England have been long reported, including how they vary by age
(Department of Health and Social Security, 1980). These findings have provided further
support to what is known, showing the wide social inequalities that persist throughout the life
course. Health inequalities are not evenly distributed through the life course; rather they vary
by age (Dibben and Popham, 2013; Dorling, 2013; Smith et al., 2010). Whilst the analysis
finds no evidence that absolute equalisation occurs during mid- to late-adolescence, there is a
marked decline in inequality during this period. This shows strong support for the existence
12 (Emerson et al., 2006; Spencer, 2006; West and Sweeting, 2004). It may be though that the
hypothesis is only apparent when using mortality data.
Unlike previous studies, external causes of mortality have not been shown to be important for
explaining the partial equalisation of mortality rates in early adulthood. Although the
evidence surrounding intentional self-harm and drug-related causes has been mixed, support
for the existence of an inverse social gradient for land transport has been recently shown
(Dibben and Popham, 2013). Rather what is shown here is that land transport currently
displays a traditional social gradient during youth, whereby there is an increased mortality
risk in the most deprived areas. The mortality rate in the least deprived quintile is, however,
higher than for the other external causes, reflecting the increased risky behaviour during this
period of the life course in this regard.
Further examination of how these causes have changed over the time period in question aids
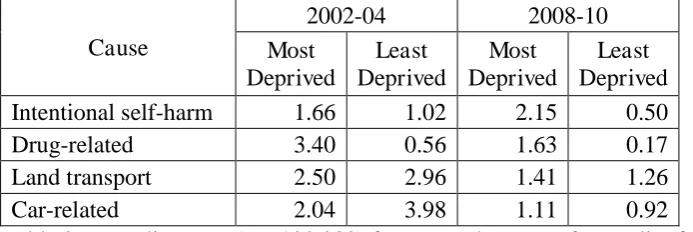
our understanding of this contrasting finding. Tables 1 and 2 show the mortality rates for the
external causes (with car-related accidents (ICD-10 codes V40-49) included separately) for
the ages 16 to 21 for 2002-2004 and 2008-2010. Mortality rates were higher in the least
deprived areas for car-related deaths in 2002-2004, however this has now reversed. What
once partially explained this phenomenon has now changed and this would appear to explain
(along with widening inequalities generally) why absolute equalisation no longer exists. For
each sub-group, the relative change over time has always been greater in the least deprived
quintile. Relative (and sometimes absolute) improvements in mortality have been greatest in
those areas of less need, perpetuating inequalities and social injustices. What is particularly
worrying is that mortality rates for intentional self-harm have not improved in the most
13 Cause
2002-04 2008-10
Most Deprived Least Deprived Most Deprived Least Deprived Intentional self-harm 5.99 4.38 5.70 1.44
Drug-related 6.59 1.90 4.10 0.30
Land transport 15.61 14.46 7.83 3.63
[image:14.595.70.418.71.189.2]Car-related 7.95 9.50 3.80 1.81
Table 1: Mortality rates (per 100,000) for external causes of mortality for males aged 16-21.
Cause
2002-04 2008-10
Most Deprived Least Deprived Most Deprived Least Deprived Intentional self-harm 1.66 1.02 2.15 0.50
Drug-related 3.40 0.56 1.63 0.17
Land transport 2.50 2.96 1.41 1.26
Car-related 2.04 3.98 1.11 0.92
Table 2: Mortality rates (per 100,000) for external causes of mortality for females aged
16-21.
The patterns for both intentional self-harm and drug-related mortality are more important
later in the life course. They both contribute to explaining why there is an excess of mortality
in the most deprived quintile (as shown in Figure 1), albeit not completely. This contrasts
with the pattern for land transport accidents, where the gap between the most and least
deprived quintiles remains fairly even across the life course. Whilst patterns are similar for
both males and females, the scale of deaths due to external causes is much higher for males.
Despite their mortality rates not being as high as for other causes, which are more important
during the middle part of the life course, these external causes represent an important and
achievable policy option.
Few other specific causes of mortality can help offer an explanation for the narrowing of
inequalities as part of the equalisation hypothesis. This is problematic for understanding
what is happening, as there are no clear avenues for further investigation. A factor in
[image:14.595.71.418.224.340.2]14 Adolescence represents one of the safest parts of the life course. Therefore the observed
equalisation may instead be a statistical artefact, due to the lack of differences between
quintiles. This would fall in line with the lack of evidence for the hypothesis when
examining morbidity or self-reported measures during these ages, where a traditional social
gradient persists (Emerson et al., 2006; Engström et al., 2003; Starfield et al., 2002).
The incorporation of change over time has added a new dimension to research into the
equalisation hypothesis. The widening of inequality in mortality is the dominant trend over
time. This supports past research, showing the general widening of inequalities by area in
health (Langford and Johnson, 2010; Thomas et al., 2010). It also explains the difference in
results from past studies which have shown evidence for the existence of absolute
equalisation (Dibben and Popham, 2013; West, 1997), as whilst the pattern remains similar,
the scale of inequality shown in Figure 1 has increased. However it is not consistent across
the life course, a new and important finding. There has been some improvement in
middle-aged males, although the smoothed gains were only slight. With these occurring when
inequalities are widest (Figure 1), this represents some useful (albeit small) gain. Rather the
decline late in the life course is much more consistent. These are, however, the only times
where a narrowing is observed.
Changes in mortality rates help to explain this. Mortality rates have declined consistently for
the majority of ages in both the least and most deprived quintiles. However, whilst the
decline in absolute terms has been much greater in the most deprived areas, the decrease in
the least deprived areas has been large enough (relatively) to result in a widening of the gap.
Where mortality rates declined less in the most deprived quintile, than compared to the least
deprived area, this was mostly at younger ages. This would explain why the largest temporal
15 improvement. Nevertheless it is also possible that this is a factor of the small numbers
involved.
A cohort effect could be a possible explanatory factor in explaining the narrowing of trends.
With the morbidity and self-rated health data showing consistent social gradients throughout
this period (although see West, 1997), it is plausible that the observed decline between the
ages of 30 and 40 is caused by a cohort effect. This is especially the case as there was a
widening of the RII either side of these ages and the pattern was only shown for males. This
is similar for the pattern for the elderly. The wide geographical inequalities that persist
earlier in the life course result in an excess of mortality in the most deprived areas. As such a
cohort effect will present itself at later ages, as the damaging effects of social influences
decline, bringing rates towards those found in the least deprived areas. With the narrowing
being more consistent, this would appear a stronger possible explanatory factor here. It also
helps explain the observed decline in Figure 1, not just changes over time.
Limitations to this study mostly pertain to data quality issues. The population data that are
used are based upon modelled ONS estimates. Given that our spatial scale of analysis was
small (both in terms of single years and geographical scale), the accuracy of these values may
have an effect. Mortality data may not also be the best way to research this topic, due to the
rarity of the event at younger ages (West, 1997; West and Sweeting, 2004). For example,
between the ages of 16 and 21, the mortality rate for males was 27.5 per 100,000 in the least
deprived areas, compared to 49 per 100,000 in the most deprived quintile. This was even
more problematic when individual years or specific causes were considered, as death counts
were often in single figures during adolescence (also see Figure 2). Yearly fluctuations
therefore make the results fairly sensitive to change, although smoothing of the data
16 of data, when compared to past morbidity studies. With death being the worst possible health
outcome, this has a greater policy importance as well.
The analysis is based upon ecological data, which may be poor at conceptualising the concept
of deprivation. The individual characteristics of those who died in a deprived area may not
relate to the social characteristics of that area (Winkleby et al., 2006). For example the
location of retirement or care homes could affect our results through increasing the level of
inequality, or masking any decrease at older ages (Lock and Higginson, 2005). The
deprivation quintiles were kept constant, which assumed areas remained fixed in terms of
whether they are deprived or not. Though theoretically false (as areas can change), this was
required to be able to compare different time periods. Otherwise changes over time could be
the result of differences in the composition of the measure used, as past iterations of the
Index of Deprivation have changed methodologically. However the results for change over
time remained consistent when the 2004 Index was also used, showing it to be less of an
issue.
In conclusion, this study helps provide further support for the equalisation hypothesis. Social
inequality is not consistent across the life course and during adolescence there is a clear
decline in the level of inequality. However there still exists some extent of a social gradient
in mortality during this period, a result of widening inequality over the past decade which has
eroded the effect. The scale of inequalities is evident across the whole life course and
equalisation is only truly evident amongst the very elderly population, where social factors
begin to possibly have less of an influence, or where only the fittest survive to. These
geographical inequalities in mortality have continued to widen for most ages. However there
were two periods in the life course where inequalities have narrowed, a result that may have
not been expected. Considerable policy attention is required to tackle and reverse this
17
Conflict of Interest
None declared.
References
Chen, E., Martin, A., & Matthews, K. (2006) Socioeconomic status and health: Do gradients
differ within childhood and adolescence? Social Science & Medicine, 62(9), 2161-2170.
Department for Communities and Local Government (2011) The English Indices of
Deprivation 2010. http://www.communities.gov.uk/documents/statistics/pdf/1871208.pdf.
Department of Health and Social Security (1980) Inequalities in health: report of a research
working group (The Black Report). London: DHSS.
Department of Health (2010) Fair society, healthy lives (the Marmot review). London:
Department of Health.
Dibben, C., & Popham, F. (2013) Are health inequalities evident at all ages? An ecological
study of English mortality records. European Journal of Public Health, 23(1), 39-45.
Dorling, D. (2013) Unequal Health: the scandal of our times. Bristol: Policy Press.
Dorling, D., & Thomas, B. (2011) Bankrupt Britain: An atlas of social change. Bristol:
Policy Press.
Emerson, E., Graham, H., & Hatton, C. (2006) Household income and health status in
18 Engström, K., Laflamme, L., & Diderichsen, F. (2003) Equalisation of socioeconomic
differences in injury risks at school age? A study of three cohorts of Swedish children and
adolescents. Social Science & Medicine, 57(10), 1891-1899.
Fan, J., Heckman, N., & Wand, M. (1995) Local Polynomial Kernel Regression for
Generalized Linear Models and Quasi-Likelihood Functions, Journal of the American
Statiatical Association, 90(429), 141-150.
Gehlke, C., & Biehl, H. (1934) Certain effects of grouping upon the size of the correlation
coefficient in census tract material. JASA, 29(185), 169-170.
Griffiths, C., Rooney, C., & Brock, A. (2005) Leading causes of death in England and Wales
– how should we group causes? Health Statistics Quarterly, 28, 6-17.
Hastie, T., Tibshirani, R., & Friedman, J. (2009) The Elements of Statistical Learning, New
York, NY: Springer.
Laflamme, L., Engström, K., & Huisman, M. (2004) Is there equalisation in socioeconomic
differences in the risk of traffic injuries in childhood? A study of three cohorts of Swedish
school children. International Journal of Adolescent Medicine and Health, 16(3), 253-263.
Langford, A., & Johnson, B. (2010) Trends in social inequalities in male mortality, 2001-08.
Intercensal estimates for England and Wales. Health Statistics Quarterly, 47,1-28.
Lock, A., & Higginson, I. (2005) Patterns and predictors of place of cancer death for the
oldest old. BMC Palliative Care, 4(6).
Macintyre, S., & West, P. (1991) Lack of class variation in health in adolescence: An artefact
19 Mackenbach, J., & Kunst, A. (1997) Measuring the magnitude of socio-economic inequalities
in health: An overview of available measures illustrated with two examples from Europe,
Social Science & Medicine, 44(6), 757-771.
Northern Ireland Statistics and Research Agency (2010) Drug related deaths and deaths due
to drug misuse registered in Northern Ireland (1999-2009):
http://www.nisra.gov.uk/archive/demography/publications/drug_deaths/DrugDeaths09.pdf.
OECD (2011) Divided We Stand: Why Inequality Keeps Rising. OECD Publishing:
http://dx.doi.org/10.1787/9789264119536-en.
Rooney, C., & Smith, S. (2000) Implementation of ICD-10 for mortality data in England and
Wales from January 2001. Health Statistics Quarterly, 8, 41-50.
Smith, L., Manktelow, B., Draper, E., Springett, A., & Field, D. (2010) Nature of
socioeconomic inequalities in neonatal mortality: population based study. BMJ, 341:c6654.
Spencer, N. (2006) Social equalization in youth: evidence from a cross-sectional British
survey, European Journal of Public Health, 16(4), 368-375.
Starfield, B., Riley, A., Witt, W., & Robertson, J. (2002) Social class gradients in health
during adolescence. Journal of Epidemiology and Community Health, 56(5), 354-361.
Thomas, B., Dorling, D., & Davey Smith, G. (2010) Inequalities in premature mortality in
Britain: observational study from 1921 to 2007. BMJ, 341:c3639.
Torsheim, T., Currie, C., Boyce, W., Kalnins, I., Overpeck, M., & Haugland, S. (2004)
Material deprivation and self-rated health: a multilevel study of adolescents from 22
20 West, P. (1988) Inequalities? Social class differentials in health in British Youth, Social
Science & Medicine, 27(4), 291-296.
West, P. (1997) Health inequalities in the early years: Is there equalisation in youth? Social
Science & Medicine, 44(6), 833-858.
West, P., & Sweeting, H. (2004) Evidence on equalisation in health in youth from the West
of Scotland. Social Science & Medicine, 59(1), 13-27.
Williams, J., Currie, C., Wright, P., Elton, R., & Beattie, T. (1997) Socioeconomic status and
adolescent injuries, Social Science & Medicine, 44(12), 1191-1881.
Winkleby, M., Cubbin, C., & Ahn, D. (2006) Effect of Cross-Level Interaction Between
Individual and Neighbourhood Socioeconomic Status on Adult Mortality Rates. American