Attackers
.
White Rose Research Online URL for this paper:
http://eprints.whiterose.ac.uk/75047/
Version: Submitted Version
Article:
Chivers, Howard Robert orcid.org/0000-0001-7057-9650, Clark, John Andrew
orcid.org/0000-0002-9230-9739, Nobles, Philip et al. (2 more authors) (2010) Knowing
Who to Watch : Efficiently Identifying Subtle Attackers. Information Systems Frontiers. pp.
17-34. ISSN 1387-3326
https://doi.org/10.1007/s10796-010-9268-7
[email protected] https://eprints.whiterose.ac.uk/
Reuse
Items deposited in White Rose Research Online are protected by copyright, with all rights reserved unless indicated otherwise. They may be downloaded and/or printed for private study, or other acts as permitted by national copyright laws. The publisher or other rights holders may allow further reproduction and re-use of the full text version. This is indicated by the licence information on the White Rose Research Online record for the item.
Takedown
If you consider content in White Rose Research Online to be in breach of UK law, please notify us by
(will be inserted by the editor)
Knowing Who to Watch: Identifying attackers whose actions are hidden
within false alarms and background noise
Howard Chivers · John A. Clark · Philip Nobles · Siraj A. Shaikh · Hao Chen
the date of receipt and acceptance should be inserted later
Abstract Insider attacks are often subtle and slow, or pre-ceded by behavioral indicators such as organizational rule-breaking which provide the potential for early warning of malicious intent; both these cases pose the problem of iden-tifying attacks from limited evidence contained within a large volume of event data collected from multiple sources over a long period. This paper proposes a scalable solution to this problem by maintaining long-term estimates that indi-viduals or nodes are attackers, rather than retaining event data for post-facto analysis. These estimates are then used as triggers for more detailed investigation. We identify es-sential attributes of event data, allowing the use of a wide range of indicators, and show how to apply Bayesian statis-tics to maintain incremental estimates without global updat-ing. The paper provides a theoretical account of the process, a worked example, and a discussion of its practical implica-tions. The work includes examples that identify subtle attack behaviour in subverted network nodes, but the process is not network-specific and is capable of integrating evidence from other sources, such as behavioral indicators, document ac-cess logs and financial records, in addition to events identi-fied by network monitoring.
1 Introduction
Insider attacks pose a particular threat because of the knowl-edge, access, and authority of their perpetrators (Randazzo
Howard Chivers, Philip Nobles, Siraj A. Shaikh
Department of Informatics and Sensors, Cranfield University, Shriven-ham, UK
E-mail: h.chivers/p.nobles/[email protected]
John A. Clark, Hao Chen
Department of Computer Science, University of York, York, UK E-mail: jac/[email protected]
et al, 2004). Such attacks often involve violations of physi-cal or operational security, or the misuse of authority; they may also involve electronic attacks, in which case the ‘elec-tronic insider’ is as big a threat as a person. It may be safer for a sophisticated external attacker to subvert an electronic system, often via social engineering, than directly subvert an employee.
The literature does not provide a single definition of ‘in-sider’, which may be defined with respect to physical or log-ical boundaries, employment, or degree of access to systems or documents. For the purpose of this work we define an insider to be someone who:
– Is able to operate within a defined boundary; and – Is awarded some degree of privilege or trust within that
boundary.
The boundary is an important feature, since we assume that the first line of defence in most systems - the perime-ter - does not apply to an insider. The boundary may be a national boundary, the physical limits of a place of work, a logical boundary defined by electronic technology, or the combination of physical and logical boundaries that define an organization. Perimeter defences that are avoided by in-siders may include immigration restrictions and constraints on the import of dangerous goods or materials, physical bar-riers, access controls and defences against fire and flood, or electronic mechanisms such as firewalls. Boundaries may be nested or even overlap; for example an accounts clerk may be within a financial department within a company. This does not present a difficulty, since we usually analyze these entities and their risks separately.
basis that their motives are benign; similarly, within an orga-nization insiders will have some degree of physical access, and their work will usually involve authorized use of elec-tronic systems. Examples of security violations by insiders include ‘home grown’ terrorism, espionage, theft of indus-trial secrets, sabotage, and employee fraud.
We also include in our definition of insider a person or element of a system that has been subverted to act for an ex-ternal attacker, because the detection problem is the same: the system cannot be protected at the perimeter, and the at-tacker has acquired some degree of internal authority. Ex-amples of such attacks include the coercion or social engi-neering of employees, including using such techniques to subvert employees’ electronic equipment.
Attacks may involve a single major incident, such as ter-rorist attack, sabotage, or theft, or may take place over a long period. For example, the world’s largest credit card fraud was achieved with a subverted internal system that avoided discovery for over 17 months (Goodin, 2007).
Subtle attackers are unlikely to launch large-scale fraud-ulent financial transactions, or use known electronic exploits; they will seek to avoid any action that can be immediately identified as an attack. However, they are likely to cause mi-nor security events: an attacker may test known passwords, probe for services, or test new exploits, expecting to hide within the background of user errors, mistakes and other ‘noise’. The problem of detecting such an attacker is there-fore one of accumulating relatively weak evidence over a long period. This issue is identified as one of the ‘grand chal-lenges’ of the internal attacker problem: “to combine events from one or more sensors, possibly of various types” while “reduce[ing] data without adversely impacting detection” (Brackney and Anderson, 2004); it is also a long-standing problem for Intrusion Detection Systems (see section 3). This paper provides a solution to this critical problem.
Attackers planning a major incident, or who are predis-posed to such an action, also generate a trail of subtle clues before the attack. For example, Band et al (2006) describe histories of observable rule-breaking, organizational conflict and behavioral deviance as a precursor to espionage and em-ployee sabotage. The ability to correlate a series of subtle clues is potentially as important in identifying the precursor to a major attack, as it is for detecting attackers who are at-tempting to stay below alarm thresholds to avoid discovery. The examples presented here identify subtle attack be-haviour in subverted network nodes. The actions of the sub-verted node or individual may be events that could be identi-fied by an Intrusion Detection System (e.g. network probe), or they may result from marginal use of a system by an au-thorized individual, for example failed login attempts or un-usual patterns of document access. However, the approach to characterizing and combining diverse sources of weak evi-dence is equally applicable to other problems in the insider
space, such as identifying criminal or espionage threats from behavioral indicators, and this is discussed further in section 9.
This paper provides a process for combining evidence from various sources based on the application of Bayesian statistics, identifies attributes that must be available to allow the combination of evidence from different types of sensor, and demonstrates the effectiveness of this approach with a simulated slow-attack on a network.
This paper presents the results of substantially more re-search than its workshop predecessor (Chivers et al, 2009). Although the principles and aims are the same, the hypoth-esis on which the updating algorithm is based has been changed, resulting in a improved updating factor, which is effective at resolving some marginal discrimination ob-served in the previous results. This paper also includes a significantly larger realistic simulation, explicit results on the limits of evidential accumulation, and a discussion on normalization that justifies the stance that it is not necessary to update scores for every individual following each event.
The paper is organized as follows: Section 2 provides an overview of the proposed approach, section 3 describes related work, and the evidential accumulation process is de-veloped and described in section 4. After a brief explanation of the simulation approach in section 5, section 6 shows that the proposed process is well behaved in simple cases, and that it gives the same estimate of behaviour regardless of the size group an individual is associated with; section 7 then explores the effective limits to updating evidence. Section 8 simulates a challenging insider detection problem, contrasts the effectiveness of the evidence accumulation process with a common, but naive, alternative approach, and shows how the results vary with increasing uncertainty of identification of nodes that originate events. Section 9 discusses results and open issues, and the paper is concluded in section 10.
2 Overview
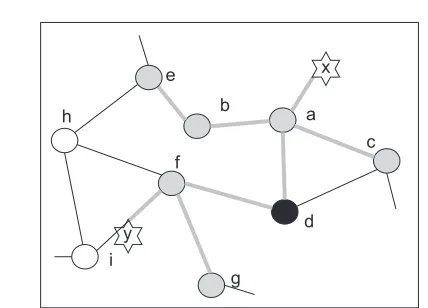
Consider how a human investigator might approach the prob-lem of accumulating evidence in the system of Figure 1. The system consists of a network nodes(a...i)with interconnec-tivity as shown; it may be a social network of people, a net-work of electronic components, or a hybrid netnet-work of indi-viduals where the links between them are mostly electronic. Two minor security events are detectedx,andy; they may be behavioral, perhaps originating from observations of deviant behaviour or abnormal financial statistics, or electronic, for example alerts from an intrusion detection system, or server log.
x
y
a b
c
d f
h
g i
e
Fig. 1 Intersecting weak evidence from several events may be enough to indicate a common source. Event x may have originated from a,b,c,d or e; event y from f,g or d; their intersection, d, suggests a possible common factor.
e. Similarly, whenyoccurs at a much later date the possible originating nodes aref, gandd. Intersecting these observa-tions suggests nodedas a common factor, and this may be sufficient to trigger intensive monitoring to determine if it is behaving maliciously.
The data used to identify these security events and their possible sources is necessarily transient; it may not be pos-sible to record sufficient of the history of interactions be-tween nodes to allow this analysis retrospectively. However, it is initially sufficient to just identify nodes that score differ-ently; from the perspective of the defender in the long slow game it is only necessary to ‘tip off’ a further investigation by identifying one or more nodes whose behaviour may be unusual. It is not essential to record the events, the actions from which they were identified or even the graphs that iden-tify possible sources, provided it is possible to somehow ac-cumulate a ‘score’ for each node in the system.
This approach solves one of the critical issues in identi-fying slow attacks: how to maintain long-term state. Systems that try to model the behaviour of individuals or protocols are forced to retain large amounts of data which limits their scalability. In the approach described here the state size is a small multiple of the number of nodes in the network; this state is readily distributed and its storage is feasible, even for organizations with global networks.
The ‘score’ that we propose for each node is the proba-bility that the node is subverted, based on the application of Bayesian statistics. This naturally allows incremental updat-ing and translation of the problem frame from events which are related to behaviour to individual attackers. Simpler ap-proaches, such as the event counting used to introduce this section, can be shown to be inferior, as demonstrated in sec-tion 8.
In summary, we propose that to identify subtle or inside attackers:
– The primary objective is to identify nodes for further in-vestigation.
– Long-term state is restricted to an incremental estimate of the probability that each node is an attacker.
– Node estimates are updated following every security event, taking account of transient network information that is available at the time of the event.
This process is complementary to conventional intrusion de-tection using signatures or heuristics, or automated fraud detection that identifies large deviations in user behaviour. There is no need to gradually accumulate evidence if the at-tack is evident, in such a case the secondary investigation is concerned with incident management, rather than confirma-tion.
Section 4 describes how scores are calculated and main-tained, following a brief summary of related work.
3 Related Work
The idea of using primary tests or indicators to identify sus-pects who then warrant further investigation is an established financial management practice. Standard texts on fraud man-agement (e.g. (Wells, 2008)) specify tests that can be used to trigger further investigation, based on the likelihood that fraudsters’ behaviour is sufficiently different from that of normal employees to be statistically significant. For exam-ple, employees who have an abnormally high level of cash adjustments (i.e. accounting corrections) may be involved in systematic sales or invoice fraud. Such systems are sup-ported by forensic investigation once a fraud is suspected and statistical triggers are supplemented by checks such as surprise audits to detect and deter systematic low-level fraud. Within the computer forensics community Bradford et al (2004) have proposed a similar process of detection followed by a more detailed forensic investigation. Users are profiled according to their function and statistical tests are used to de-termine if behaviour is anomalous and more intensive data collection should be initiated. However, the authors do not show an implementation of their approach and remark that it could not be carried out for “every user regardless” but itself requires a “triggering process”.
[image:4.595.47.261.81.235.2]Anomalous packets are identified based on heuristics devel-oped from real scans. Other approaches include statistical filtering, primarily to reduce false alarm rates and support vi-sualization (Colombe and Stephens, 2004). In essence, how-ever, all these approaches require the storage of large vol-umes of event data for later analysis, and the authors them-selves identify scalability as a problem (Nguyen et al, 2003).
Aggregation as a means of detecting slow or stealthy at-tacks has been proposed by Heberlein (2002). His assump-tion is that slow attacks are still systematic and the attacker will eventually repeat the attack many times, possibly against different targets. Alerts are classified and displayed on a visualization grid, and any persistent activity which raises alerts of the same type over a long period can be identi-fied. Although similarly motivated our work differs by accu-mulating evidence of attackers, not of incidents, removing the restriction that attackers need to repeat similar attacks. Heberlein’s algorithm is also a counting process, which we show to be inferior to statistical reasoning.
Other work directed toward the insider problem is fo-cussed on characterising an attacker’s behaviour. The se-curity indicators (‘events’) used may range from an indi-vidual’s buying and travel preferences, to electronic alerts. For example, Buford et al (2008) propose a comprehensive framework of ‘observables’ that are used to build a model of individuals’ behaviour via graph theory. Eberle and Holder (2009) develop graphs of behavioral events, such as phone calls, to identify sub-graphs of normal behaviour, which are used to search for similar but anomalous occurrences. These approaches offer the advantage of modeling the potential at-tacker and providing interesting insights into observable be-haviour; however, their application may be limited by the computational cost of graph matching over large datasets, as well as by data scalability.
Most of the work described above is still formative; net-work intrusion detection, however, is established in the lit-erature and supported by both open and propriety products (Bace and Mell, 2001). An intrusion detection system (IDS) uses a behavioral model of a system or protocol and detects anomalous events by either recognizing predefined signa-tures, or by heuristics. Both approaches have strengths and weaknesses, but despite the use of IDSs in practice they are hampered by a lack of scalability and tend to generate large numbers of false positive alerts (Bace and Mell, 2001). From the perspective of this paper, IDSs are an effective way of generating events which may indicate an attack but are un-able to maintain sufficient state to identify slow attacks.
An IDS is not the only possible source of security events; other sources include the behavioral events referenced above, operating system audit trails, document access records, and even Honeypots (Spitzner, 2003), which are security traps with no operational functionality.
In summary, the challenge of integrating information from many sources in a manageable and scalable fashion, in order to identify patient internal attackers, is still an im-portant open question (Brackney and Anderson, 2004).
4 Accumulating Evidence
This section develops the detailed theory necessary to im-plement the method outlined in section 2: to collapse the problem of attacker identification to updating a single score for each network node or user. The section first outlines the evidential scenario and the attributes required to character-ize security events. Standard Bayesian updating is summa-rized, followed by the development of the process for updat-ing evidence of insider attacks. Finally, the practical issue of relating this process to real security events is discussed.
Definitions
Node:This paper uses network terminology, without loss of generality to broader types of human or attack behav-ior. A node is an individual or a system element such as a user’s end system or a router. This theory does not require a graph to accumulate evidence, so edges between nodes are not formally defined. The edges or links between nodes may, however, be needed to estab-lish which nodes are the possible originators of security events; examples of such links include network commu-nications, indirect communication between individuals (e.g via emails or documents), and direct social interac-tion.
Event:An event is an alert that indicates a possible security violation; it may be an anomalous phone call, a financial anomaly, a failed system login, or something more cer-tain, such as a known electronic exploit.
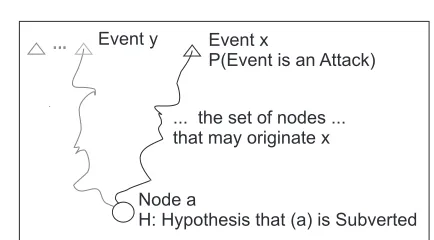
The evidential scenario is presented in Figure 2. Nodeais an individual or network node, andxis an event which is detected somewhere in the system; there is some evidence that identifies the nodes that may have originated the event.
Eventxmay indicate an attack. Some security events are almost certainly attacks; however, there are many more that may be user mistakes, network backscatter, or other forms of ‘noise’. For example, an attempt by a user to obtain a re-stricted document, or connect to a non-existent webserver, may be a simple mistake but could also be a deliberate at-tempt operate outside their legitimate authority.
Event x
P(Event is an Attack)
Node a
H: Hypothesis that (a) is Subverted ... the set of nodes ...
that may originate x Event y
...
Fig. 2 The Evidential Scenario: events are detected that may indicate an attack, it is possible to identify some nodes as possible originators of each event, and the objective is to investigate the hypothesis that a particular node is the attacker.
with a particular event (behavioral indicator) may be identi-fiable, for example, it may be able to identify most of the in-dividuals with access to a ’leaked’ classified document, but only estimate the total number who may have had access. In order to accumulate evidence from a wide range of different sources, events must be characterized by uniform parame-ters that describe these various attributes. We propose that security events can be characterized by three parameters:
– P(Attackx): the probability that a particular event, x, is caused by an intentioned attack.
For an event generated by network intrusion sensors this is the ratio of true positive alerts to all alerts, which is a standard figure of merit. For behavioral indicators (e.g. presence at a street demonstration) and other sys-tem alerts (e.g. failed logins) it is necessary to estimate the value based on likely event frequencies. In some cases the historical rate of occurrence of certain attacks, such as insider fraud, may be known, and this may be used to estimate the probability that certain events derive from such attacks. In a similar way to estimating risk likeli-hoods, it may be sufficient to quantify these frequencies to an accuracy of an order of magnitude.
– Cx: the Causal Node Set, which is the set of nodes or individuals that are estimated to be the possible source of the event.
In a network it may be possible to associate the event with a packet stream that originated from an identifi-able subnetwork or node. This may be a static feature of the sensor’s location, or it may be deduced from the data (the packet source address places it in a particular subnetwork), or from dynamic system information (e.g. current routing tables). In the case of behavioral infor-mation it is likely to be an identifiable set of individuals (e.g. visitors to an internet cafe during a specific period).
– P(Cx):the probability that the event originator is within the causal node set.
It will not always be possible to identify with certainty the set of nodes or individuals that include the event originator: the estimate may be incomplete, or wrong. For example: technical means such as indirection or ad-dress spoofing (CERT Incident Note, 1998) may be used to camouflage the source of an attack; routing tables or traffic records may suggest that most packets came from a specific network, but a few came from elsewhere; the traceability of a packet to a particular subnetwork may depend on the correct functioning of routers and fire-walls, which themselves have a non-zero possibility of being subverted. In the case of behavioral indicators it may be possible to know the number of people involved in an event, but only positively identify a fraction of the individuals; for example, not all the visitors to an In-ternet Cafe during a period in question are positively identified. All these factors suggest the need for a metric that quantifies the extent to which the event originator is known to be within the estimated causal set.
Given a sequence of events characterized by these pa-rameters, we wish to investigate the hypothesis that a partic-ular node is subverted, or acting as the agent of an attacker. We will first summarize the standard approach to Bayesian updating, then show how it can be applied in this case.
4.1 Bayesian updating
Bayesian updating provides an estimate of the probability that hypothesis H is true, given an event,x.
P(H|x) =P(x|H)·P(H)
P(x) (1)
This theorem uses P(x|H), the probability of event(x) given that the hypothesis is true, to update the initial (‘prior’) estimate of the probability that the hypothesis is true,P(H). Simple updating of this type is used in medical diagnosis; given knowledge of the probability of a symptom (the event) given a disease (the hypothesis), it provides a principled es-timate of the likelihood of the disease given the symptom. It is essentially this change of reference frame – from symp-tom to cause – that is needed to identify attackers from their behaviour.
[image:6.595.49.266.82.202.2]Assuming conditional independence (i.e. that the prob-ability of an event is conditioned by the hypothesis, but not by other events that are observed), a further standard result is that the evidence updates from several events (e.g. x,y) are combined as follows:
P(H|x,y) =P(x|H)·P(y|H)·P(H)
N (2)
Where N is a normalizing factor, as described above.
4.2 Combining evidence from security events
The evidential scenario at the start of this section defines three key parameters:P(Attackx),Cx, andP(Cx)which char-acterize an event; in addition, we define the following:
S The set of all nodes in the system. #S The total number of nodes in the system. a,b... Particular network nodes.a,b, ...∈S Ha The hypothesis that we wish to update: that
node (a) is the node which is subverted, or being used to mount an attack within the sys-tem.
x,y... Particular events that may provide evidence of an attack.
#Cx The number of nodes in setCx
The hypothesis,Ha, assumes that only one node in the sys-tem is subverted; this provides improved discrimination and normalization over the alternative hypothesis that several nodes may be subverted. This is a technical issue and does not inhibit the practical use of the resulting scores to identify several attackers. In practice the several-attacker problem can be regraded informally as superposition, and we later illustrate with an example that attackers with high levels of activity do not mask more subtle attacks.
In order to carry out Bayesian updating as specified in equation (2), it is necessary to calculate the update factor P(x|Ha), the prior probabilityP(Ha), and when required to normalize the result in such a way that the probabilities across all nodes sum to unity.
4.2.1 The Bayesian update factor
The update factor P(x|Ha) is the likelihood of the event, given the hypothesis Ha. Given that event x has been ob-served, and the hypothesis thatais the only attacker, then either:
– Eventxoriginates because of an attack, and it came from nodea, or
– Eventxdid not originate because of an attack, and it may have originated from any node.
The probability thatxoriginates because of an attack is the parameterP(Attackx)that characterizes the event, as de-scribed above. The probability that the event did not origi-nate because of an attack (i.e. it is a false positive) is there-fore(1 - P(Attackx)).
Each event is associated with a set of nodes or individu-als,Cx, that is expected to include the originator of the event; we assume that each member of this set has an equal prob-ability of being the event originator. It would be relatively straightforward to extend the theory below to assign likeli-hoods individually to members ofCx; however, we have yet to find evidence that such a distinction would be useful in practical event scenarios.
This set divides the population of nodes in the system into two groups; nodea, the subject of the hypothesis, may be a member ofCxor may fall outside that set. Ifais inCx then the probability thatxoriginated fromais the probabil-ity thatCxincludes the originating node,P(Cx), divided by the number of nodes in the set,#Cx. Ifais not inCxthen the probability thatxoriginated fromais(1 - P(Cx))divided by the number of nodes outsideCx,(#S - #Cx).
This allows us to calculate the probability that x orig-inates because of an attack, and it came from nodea. As described above, we must add the possibility thatxdid not originate because of an attack to obtain the required update factor:
i f a∈Cx:
P(x|Ha) = P(Attackx)·P(Cx)
#Cx
+ (1−P(Attackx)) (3)
i f a∈/Cx:
P(x|Ha) =
P(Attackx)·(1−P(Cx)) #S−#Cx
+ (1−P(Attackx))(4)
These equations provide the Bayesian update factors; in order to complete equation (2) it is also necessary to include prior probabilities and normalize the result.
4.2.2 Normalizing the result and localizing the update factor
By multiplying the prior probability for each node,P(Ha), with the sequence of update factors derived from events it is possible to calculate the numerator of equation (2), which provides a score for each node in the system. The prior prob-ability is a function of the network node, and may be esti-mated in advance for the type of node, or if there is no basis for distinguishing nodes (see section 4.3, below), it can be set to1/#S. The resulting score after two events, x and y, is:
As described in section 4.1, in order to obtain the prob-ability of each hypothesis given the evidence it is necessary to normalize the results such that the sum of the probabili-ties over all possible hypotheses is unity. The working hy-pothesis that there is a single attacker makes this straightfor-ward assuming that nodes in the system are disjoint, since it results in a single hypothesis for every node in the sys-tem, giving a normalisation factor which is the sum of these scores:
P(Ha|x,y) =
Scorea ∑i∈SScorei
(6)
This allows probabilities to be recovered from node scores when required, but it does not meet the need for effi-cient evidence recording, since the updates in equations (3) and (4) require the probability estimate associated with ev-ery node to be updated for each event. For efficiency, and to allow distributed calculation, it is very desirable to update only the estimates of nodes that are withinCx- that is to up-date only the scores of nodes that are indicated as possible originators of a particular event.
It is therefore desirable to localize the updating process; to do this we observe that multiplying all the update fac-tors arising from a given event by a constant has no effect on the normalized probability. This is trivial to prove: mul-tiplyP(x|Hi)in equation (5) by an arbitrary constant,K, for all nodesiinS. This multiplies both the numerator and the denominator of equation (6) by K, which cancel to give the same normalized probability that would result if the constant multiplier had not been used.
Our objective is to avoid updating node scores outside Cx, and this can therefore be achieved by choosing a con-stant K which sets the update factor for these nodes to unity. The required constant is the reciprocal of equation (4); by multiplying equation (3) by this factor we obtain an update factor that is applied to only the scores of those nodes within Cx.
∆x=
P(Attackx)·P(Cx)
#Cx + (1−P(Attackx)) P(Attackx)·(1−P(Cx))
#S−#Cx + (1−P(Attackx))
(7)
4.3 Evidence accumulation in practice
The forgoing sections provide the necessary theory to allow the details of security events to be discarded, while retaining a single score for each node which summarizes the evidence that the node is an attacker. The algorithm to achieve this is:
1. Initialize each node score with its prior probability,P(Ha). 2. For each security event:
(a) Establish the distinguishing parameters: the proba-bility that the event originates because of an attack, the set of nodes that are likely to have originated the event(Cx), and the probability thatCx contains the event originator.
(b) Calculate∆from equation (7).
(c) Multiply the score for each node inCxby∆; do not update the scores for nodes outsideCx.
3. When required, normalize the resulting node scores us-ing equation (6), to obtain the probability that each node is an attacker.
The prior probability is of value if different nodes have significantly different priors. For example, in a net-work there will be a significant difference between a well-configured router and a laptop which is used outside the or-ganizational perimeter; for individuals the prior probabili-ties may vary with degree of background checking, or in the case of large public populations with factors such as social-economic group. In many cases where the priors are signif-icant they can be estimated from survey information; if no such information is available, then the priors can be set to 1/#S.
The three parameters that characterize an event were dis-cussed in the introduction to section 4.
The assumption of event independence (see 4.1) has prac-tical consequences for the choice of event. For example, in a network attack, a particular sequence of actions may be closely related (e.g. a known exploit, followed by an outgo-ing connection that downloads specific malicious software). Such chains of actions are clearly not independent events, but are close enough in time to be correlated by an intrusion system and regarded as a single event with a high certainty that it is an attack. On the other hand, in a network scan, which is a series of probes to different network locations, the individual probes are only interdependent to the extent that addresses scanned will depend to some extent on past his-tory. In these situations the designer has a choice whether to regard them as a separate events, with rather lowP(Attack), or if they occur within a short time interval to regard them as a single event with a much higherP(Attack).
We are primarily concerned with comparative scores in order to identify nodes that are distinctive and require further investigation. In practice, then, it is sufficient to use Loga-rithmic scores, simply addingLog(∆)to each node indicated by an event. Equation (6) can still be reconstructed from this information, but more usually the highest node score or set of scores is chosen for further investigation.
character-izes exactly how much evidence is provided by each event. This important distinction is illustrated in the worked exam-ple presented in section 8.
5 Simulation Approach
The sections that follow evaluate the evidence accumula-tion process described above, partly by further exploraaccumula-tion of equation (7), and partly by simulation. This section briefly describes the simulation rationale and approach.
It is rare to obtain useful network traces from real sys-tems, especially large systems with subtle attackers. There-fore, in order to explore a wide range of different scenarios, we use network simulation. In this paper, simulation is first used to demonstrate properties of the proposed evidence ac-cumulation process, then used to demonstrate its effective-ness in a complex network whose overall structure is typical of those we encounter in practice.
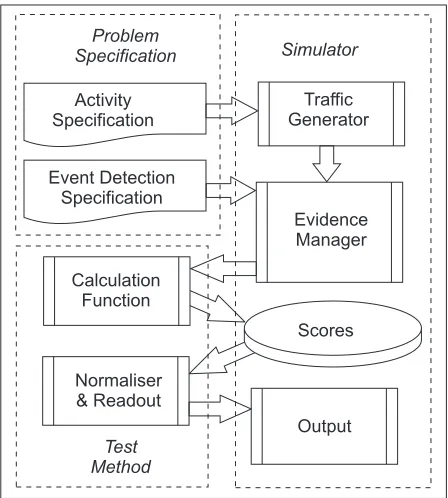
The structure of the simulator is presented in fig 3.
Activity Specification
Event Detection Specification
Traffic Generator
Evidence Manager
Normaliser & Readout
Scores
Output Calculation
Function
Simulator Problem
Specification
Test Method
Fig. 3 The structure of the security event simulator. The modularity allows the direct substitution of calculation methods for comparative testing under identical conditions.
The simulator behaviour is controlled by two inputs: a problem specification and a test method. The problem spec-ification contains two main parts, a description of network traffic including security related events, and a specification for how event detection behaves. Traffic is generated by the simulator at random, within rates set by the specification, and can be typed to allow different sorts of detectors and
traffic to be simulated simultaneously. The event detection section specifies what traffic events can be detected, and how to determine the three key parameters:P(Attackx), Cx,and P(Cx) for each event.
The test method provides score calculation and normal-ization functions. Usually these functions implement equa-tions (7) and (6) respectively, but they can be exchanged with other methods, allowing exactly comparable results to be obtained; this feature is used to contrast the updating pro-cess proposed here with a counting approach in section 8.2, below.
The simulator maintains separation between the calcu-lation method and problem specification. It generates traffic according to the activity specification, which is then screened for events using the rule structure provided by the event de-tection specification. Events detected are provided to the cal-culation method, which updates the associated scores, and when output is required the normalizer can be employed to recover actual probabilities. In all the examples in this paper the normalizer is not used, since Log scores are displayed, as described in section 4.3.
6 Behaviour of Evidential Accumulation
Before showing a representatively difficult example of in-sider attack in which the attacker attempts to hide below the background noise of the system detection (see section 8.1), this section explores if the evidential accumulation process is well-behaved in simpler cases. Two examples are given, the first explores a simple electronic network with variable rate attackers, and the second is concerned with a social net-work with multiple overlapping groups of individuals.
6.1 A simple network
Given a single subnetwork, in which the sender can be read-ily identified, we explore some key questions for evidence accumulation:
– Is it possible to identify an attacker sending at a slightly higher rate than the background of errors from normal nodes?
– If the rate of attack increases, is the process stable, and does it enable the attackers to be identified earlier? – Does the process accommodate multiple attackers with
different rates of attack (i.e. can one node hide behind another’s attack)?
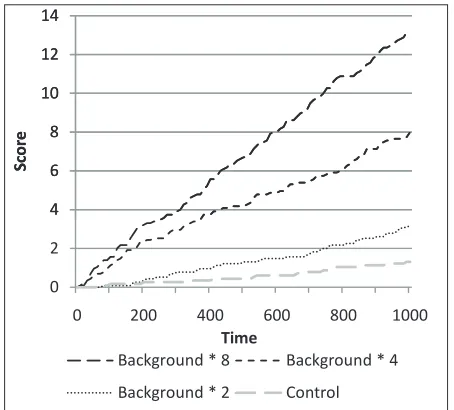
[image:9.595.49.273.360.609.2]choice was to avoid a number that exactly divided the sys-tem topology; we are not aware of any simplification that would result from such a choice, but wished to avoid the possibility.) Time is divided into slots (e.g. single minutes) and the average background rate of random innocent events that may be misinterpreted as attacks is 1/50 per node – in other words, one event per minute. Three nodes within the network are designated attackers, and they generate random attacks at rates of 2, 4 and 8 times the total background rate. Because these parameters identify the originator of an event with certainty, then there is less opportunity for an at-tacker to hide in the ’noise’ of a crowd; this experiment is designed to illustrate that several attackers are treated inde-pendently and that discrimination, or time to detection, im-proves with higher event rates.
4 6 8 10 12 14
S
c
o
r
e
0 2 4 6 8 10 12 14
0 200 400 600 800 1000
S
c
o
r
e
Time
Background * 8 Background * 4
Background * 2 Control
Fig. 4 Scores resulting from three attackers at different rates in a small network. The presence of high rate events from one or more attackers does not interfere with the detection of lower-rate attacks from another.
The scores resulting from this scenario are shown in Fig. 4. All three attacking nodes are well distinguished from the background level of events, which is indicated by the ‘con-trol’ result, which is the score for a typical innocent node. As would be expected, if the attack rate is higher the dis-crimination improves. The accumulation of evidence is well behaved and the higher rate nodes do not interfere with the accumulation of evidence relating to attackers operating at a lower rate.
6.2 Evidence from overlapping groups of individuals
Electronic networks are likely to have stable structures, re-sulting in relatively simple and consistent groups of nodes (i.e. the sets ofCx) that can be identified as the originator of
an event: for example the individual node, the logical sub-network, or a local facility network. Under these circum-stances it is important that the same evidence is accumulated against two nodes whose behaviour is the same, but who are usually identified with different size groups of nodes.
This issue becomes more significant when dealing with social networks where innocent individuals associated with ’events’ (e.g. individuals visiting a specific internet cafe, or taking a flight to a particular destination) are present by ac-cident, rather than a result of a fixed network architecture. These groups of individuals are much more ad-hoc, and the attackers lie somewhere in their many random intersections. The problem of ’false alarms’ occurs equally in the be-havioral modeling of individuals as in the electronic moni-toring of systems or networks. Most of the security breaches recorded by government agencies, integrity lapses recorded by police services, and disciplinary offences noted by com-panies are false alarms, in the sense that they do not neces-sarily indicate that the individual is a potential spy, is cor-rupt, or is unsuitable as an employee.
To investigate how well such disparate groups can be as-sessed we simulate three events that identify three radically different sized groups of individuals (651, 51 and 25). Fig. 5 (a) illustrates the resulting sets of individuals, and the size of two overlaps. All the individuals in the system generate events at the same rate (P(event)=0.014), which results in a total of 10 events per unit of time from the 700 individu-als). The exceptions are the individuals in the overlaps, who generate events in all the groups with which they are iden-tified at the same rate as other group members, so they gen-erate additional events pro-rata to their group memberships. P(Attack)is .099 for all events, and the simulation was run for 100,000 time units. The resulting scores are given in Fig. 5 (b).
14.3
14.2
14.2 625
1 24
25 25
Group A (651)
Group B (51)
Group C (25)
28.5
42.7
Membership Scores
a. b.
Fig. 5 Investigating the scores for individuals in different size groups, with the same behaviour within each group. (a) shows the sizes of the three groups and their overlaps; (b) gives the final accumulated score for representative single individuals. This demonstrates that scores de-pend on activity level, and are indede-pendent of group size.
[image:10.595.48.275.297.502.2] [image:10.595.311.524.535.653.2]pro-cess to different sized groups, receive the same score; the small differences are attributed only to small differences in the random generation of events. This normalization be-tween different group sizes is important because the objec-tive is to identify individual behaviour and avoid identifying individuals simply on the basis of the groups to which they are ascribed. Section 8.2, below, provides a dramatic exam-ple of how badly alternative processes perform if they do not possess this attribute.
In this case the scores for the individuals in the inter-section of these groups is predictable, as it arises simply from the superposition of event rates. The reader should bear in mind that this section is concerned only with basic be-haviour. A real social network problem is likely to iden-tify many more groups, with considerable uncertainty about their membership, making it rather more difficult to identify which individuals are potentially significant.
7 Limiting factors for Event Evidence
The equation for updating evidence can also be used as a measure of effectiveness for event detectors. Specifically, we can enquire under what circumstances does an event add in-formation to our estimate that an individual is an attacker.
The threshold of usefulness of event detection occurs when∆from equation (7) is unity; a value above unity adds evidence to some hypothesis, below reduces evidence against any of the identified nodes. We require:
P(Attackx)·P(Cx)
#Cx + (1−P(Attackx)) P(Attackx)·(1−P(Cx))
#S−#Cx + (1−P(Attackx))
>=1 (8)
Multiplying by the denominator of the left hand side, then subtracting(1−P(Attackx))from both sides gives:
P(Attackx)·P(Cx) #Cx
>=P(Attackx)·(1−P(Cx))
#S−#Cx
(9)
Dividing outP(Attackx), and multiplying out the denomina-tors, we obtain:
(#S−#Cx)·P(Cx)>=#Cx·(1−P(Cx)) (10)
Adding #Cx·P(Cx)to both sides, then re-arranging, gives:
#S>= #Cx
P(Cx)
(11)
This result is valid providedP(Attackx)is not zero. Val-ues ofP(Attackx)close to unity provide most evidence, and asP(Attackx)tends toward zero the update factor approaches
unity, which is to be expected since the weight of evidence is reducing.
Assuming thatP(Attackx)is not approaching zero, then this limit can be regarded as the point at which the whole population is implicated by an event. A practical illustration of this threshold is given in section 8.3, which shows how evidence in a representative network behaves with decreas-ing certainty of event attribution.
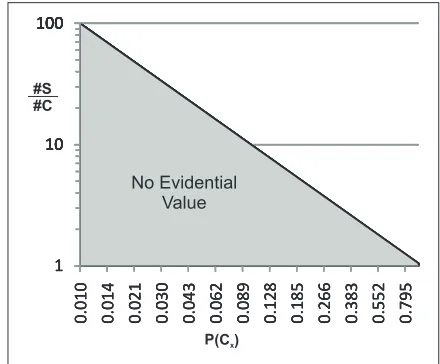
A special case of this result is if #Cx=#S; if an event can only be ascribed to all the nodes in the system, then it does not provide evidence that discriminates between nodes. Alternatively, this limit can be expressed as a ratio be-tween the size of the system and the number of nodes identi-fied as possible originators, compared to the probability that the originator is within these nodes, as shown in Fig. 6.
100 100 10 100 10 100 1 10 100 1 10 100 0 .0 1 0 0 .014 0 .021 0 .030 0 .043 0 .062 0 .089 0 .128 0 .185 0 .266 0 .383 0 .552 0 .795 1 10 100 0 .0 1 0 0 .0 1 4 0 .0 2 1 0 .0 3 0 0 .0 4 3 0 .0 6 2 0 .0 8 9 0 .1 2 8 0 .1 8 5 0 .2 6 6 0 .3 8 3 0 .5 5 2 0 .7 9 5 1 10 100 0 .0 1 0 0 .0 1 4 0 .0 2 1 0 .0 3 0 0 .0 4 3 0 .0 6 2 0 .0 8 9 0 .1 2 8 0 .1 8 5 0 .2 6 6 0 .3 8 3 0 .5 5 2 0 .7 9 5 No Evidential Value
P(C )x
#S #C
Fig. 6 Evidential value is limited by the effective size of the set of individuals that may have originated an event
8 Insider Attacks
This section shows that a subtle insider attack in a represen-tative network can be identified by the proposed evidence accumulation process, contrasts the principled accumulation of evidence with a simple counting scheme, and explores how evidential accumulation behaves as the attribution of nodes that originate events becomes less certain. All the ex-amples in this section use the same network and the same simulation seeds, to provide comparable results.
8.1 A difficult detection problem
[image:11.595.304.524.298.480.2]– Sensors with different capabilities; for example, certainty of detection and ability to identify source nodes. – Attackers whose rate of attack is significantly below the
background rate of false positive alerts for the system. – Attacks that employ address spoofing.
An important practical issue is the estimation of the three parameters that characterize a security event; relating these to actual systems and assessing the need for accuracy is sub-ject to ongoing study. To date it has been possible to achieve realistic results by assigningP(Attack)as a fixed value for a given sensor within a deployment context, and by creating a simple rule-set that maps the network connection associ-ated with an event to a set of nodes, givingCx andP(Cx) depending on the configuration and protocol.
The network used in this example is given in Fig. 7. This network has 3000 nodes, most of which are user sys-tems located in eleven separate client subnetworks in sizes that range from 33 to 500 nodes. Two of these subnetworks have nodes that are subverted and are attacking the sys-tem. The purpose of dividing the clients into several sub-networks (apart from the fact that this is a standard config-uration) is to contrast the detectability of attackers in dif-ferent sized subnetworks, given that in many cases it will be possible to identify only the subnetwork from which an attack originated. This arrangement allows us to investi-gate the scores accrued for an attack node (3 or 403) ver-sus normally-behaving nodes in the same subnetwork, and nodes in a control subnetwork which is larger (hence higher false alarm rate) but has no attackers.
Most of the traffic in the system is between the clients and servers via the core network. Router and firewall detail is not shown, and because the object is to investigate evi-dence accumulation rather than event generation we model two unspecified types of security event: those that can be detected within client subnetworks, and events in the server farm. For example, an event could be an attempt to connect to an exploitable network port.
Attackers are expected to generate security events at a rate that is much lower than the background rate of ‘mis-takes’ by normal clients, in order to remain undetected. In the simulation below time is measured in arbitrary clocks (e.g. minutes), and the probability of a normal client gen-erating a security alert in any time slot is 1/20; in other words the system suffers an average of 150 false alarms ev-ery minute. In contrast, attackers generate events at a rate of 1/10; one event every 10 minutes.
In addition to the low attack rate, to further avoid de-tection, attackers use address spoofing. Events detected out-side the subnetwork containing the attacker can only be assigned to the whole subnetwork. Only events identified within the subnetwork containing the attacker (i.e. directed toward nodes within that subnetwork) can be traced to a spe-cific node.
An outline calculation illustrates the difficulty of this problem. Consider the attacker at node 3. Viewed from out-side, the subnetwork can be expected to generate innocent background events (false alarms) at a rate of 1.6 events per minute (33∗1/20). The events generated by the attacker are distributed at random across the network, so of these, 33/3000 are towards the attacker’s own subnetwork; these are the only events that can be identified to a particular at-tacker, and they occur at a rate of one every 909 minutes (P(Attack that can be assigned to a specific node)=1/10 * 33/3000).
The simulation is over 104minutes; in this time we ex-pect a total of 1.5 million events in the system as whole (104∗33/20) of which 16000 (104∗1.6) can be ascribed to the attacker’s subnetwork, and just 11 (104/909) to the attack node.
Given this information the reader could devise a solution to identify the attacker, but the problem addressed here is how to use all the available information when the location of the attacker and the traffic patterns are unknown in advance. In summary, the event parameters used in the simulation are:
Cxcontains all the nodes in the source subnetwork, unless the destination of the network message that caused the event is in the same subnetwork as the source, in which caseCxcontains just the source node.
P(Cx)is set to unity, sinceCxincludes the node which orig-inates the traffic. (The effect of varying this parameter is discussed in section 8.3, below.)
P(Attackx)is set to 0.043 for all used locations except the server nodes, for which a value of 0.0099 is assigned, and events from a client to its own subnetwork, which are given a value of 0.076.
These are arbitrary, for the sake of demonstration, al-though they do reflect likely differences in expectation. For example, it seems plausible that an incident at a loca-tion to which most of the traffic is directed is less likely to originate from an attack, but in practice that is de-pendent on the actual event. The only special feature in the choice of value is avoiding fractions such as 30/3000 that match the system topology, although we have not detected any problems arising from such choices. Vary-ing these parameters results in different scores, but not at the expense of overall discrimination.
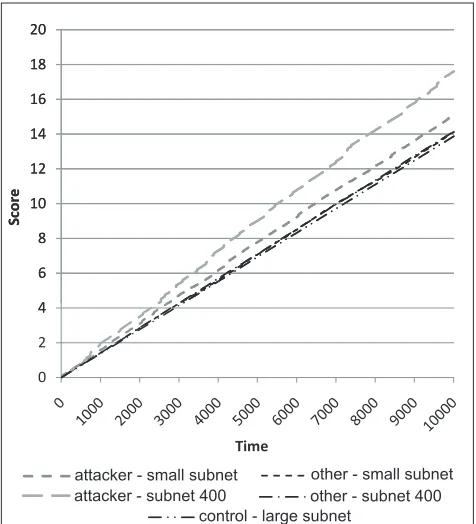
The network simulator was used to generate random traf-fic as specified above, and the scores for the resulting se-curity events were accumulated as described in section 4.3. The results are shown in Fig. 8.
Core Network Three small Client Subnets
Nodes 0-32,32-65,66-99
Attacker at node 3
Four Client Subnets Nodes 100-199,200-299, 300-399,400-499
Attacker at node 403
Unallocated but monitored Nodes 2750-2999
Four Client Subnets Nodes 500-999,1000-1499, 1500-1499,2000-2499 Servers
Allocated: 2500-2749
Fig. 7 The Test Network: a common configuration with a server farm and many client sub-networks communicating over a network core. Different size sub-networks are shown for test purposes.
4 6 8 10 12 14 16 18 20
S
c
o
r
e
0 2 4 6 8 10 12 14 16 18 20
S
c
o
r
e
Time
attacker - small subnet other - small subnet attacker - subnet 400 other - subnet 400
control - large subnet
Fig. 8 Network Simulation Results; attackers are clearly distinguished from background noise.
are from 33-node subnetworks, nodes 403 and 404 are from 100-node subnetworks, and node 1000 is from a 500 node subnetwork, of which there are four, which together contain a significant proportion of the nodes in the network.
The results show that insider attacks can be clearly dis-tinguished from background noise in the system.
For each size of subnetwork the proposed scoring clearly distinguishes the attacker as an individual from other nodes within the same subnetwork. Nodes are similarly scored re-gardless of the size of the subnetwork in which they reside, and there there is only a small difference in score between other nodes in the subnetworks containing attackers and the control node (approximately 2%), which can be attributed to attackers slightly raising the score of their own network.
8.2 Contrasting evidence accumulation with event counting
The effectiveness of the approach presented in this paper can be judged by comparison to the counting algorithm used to introduce section 4, and adopted by some researchers. The same events are generated with the same characteristics as described in the previous section, but the calculation func-tion uses counting rather than evidence accumulafunc-tion, by simply incrementing node scores if the node is identified as a possible source of an event (i.e. is inCx). The results are presented in in Fig. 9.
[image:13.595.76.520.82.305.2] [image:13.595.43.281.358.620.2]13
50000 100000 150000 200000 250000 300000
S
c
o
r
e
0 50000 100000 150000 200000 250000
S
c
o
r
e
Time
attacker - small subnet other - small subnet attacker - subnet 400 other - subnet 400
control - large subnet
Fig. 9 Counting Algorithm Performance on the same problem; it fails to identify attackers, and scores are proportional to background noise which is related to sub-network size.
8.3 Uncertainty in identifying the nodes that originate an event
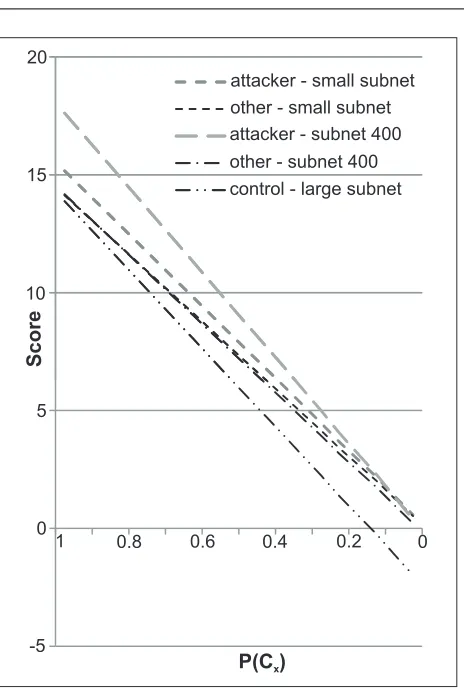
The network example, above, assumed that the set of nodes that may have originated an event could be identified with certainty. Fig. 10 shows the results of a series of simula-tions with varying degree of certainty of attribution of the nodes that originate each event. For the sake of illustration all events were given the sameP(Cx); in practice this would vary depending on the type of the event and the position in the network where it was detected.
As would be expected, the greater the uncertainty the lower the overall score. Importantly, the scores remain cor-rectly ordered; even with high degrees of uncertainty of at-tribution, attacking nodes would be correctly identified for further investigation.
A noteworthy feature of this simulation is the node in the control subnetwork, whose score decreases more quickly than the others, eventually becoming negative. Section 7 showed that the limit of evidential value of an event is the point where the degree of uncertainty encompasses the whole network. The control node in this case is in a subnet-work of 500 nodes; in a netsubnet-work with 3000 nodes equation (11) gives the threshold value asP(Cx) =500/3000=0.17, which is consistent with the point at which the simulated score is zero.
P(C )x
S
c
o
re
-5 0 5 10 15 20
1 0.8 0.6 0.4 0.2 0
[image:14.595.303.535.76.421.2]attacker - small subnet other - small subnet attacker - subnet 400 other - subnet 400 control - large subnet
Fig. 10 The variation in final scores of the network simulation with
P(Cx); uncertainty in identifying the source of events predicably weak-ens the score, but the attackers remain identifiable.
The decreasing score of the control node in this exam-ple therefore occurs because the attribution of events to that node is approaching the limit of evidential value. This ef-fect is the most likely cause of the small divergence between non-attacker nodes (subnet 400 diverges a little); however, given the random nature of the simulation this difference is too small to justify a claim of significance.
In summary, this section illustrates that even given in-creasing uncertainty about the origin of the events it remains possible to distinguish attackers from other nodes; however, the limits derived in section 7 apply if the uncertainty of at-tribution of the event originator approaches the size of the system.
9 Discussion
[image:14.595.44.280.82.352.2]process scales linearly with the number of nodes or indi-viduals in the system, and is applicable to a very wide range of systems and circumstances.
Bayesian statistics has been used, rather than the sim-ple probability ratios that would be suggested if informa-tion theory was employed, in order to effect the change of viewpoint from the event to the attacker. The update factor, ∆, importantly takes account of ancillary information such as the number of nodes that are indicated by the event and the degree of certainty in their estimation. These event pa-rameters are not specific to any particular type of event and the statistical approach given here is equally generic; in par-ticular it avoids the need for Bayesian networks tuned for specific problems by subject matter experts, as proposed by some researchers (Caputo et al, 2009).
∆ can be used as a figure of merit for sources of infor-mation: if∆ is consistently fractional for a sensor, then the resulting events will degrade the quantity of available infor-mation, rather than improve it. We show that this depends on the uncertainty of estimation of the set of event originators, compared with the size of the overall system. Essentially, if it is not possible to distinguish a set of possible event orig-inators from the other individuals in the system, then the event adds no value. This has practical consequences for in-trusion systems and network design where such uncertainty is likely to occur: as much attention should be given to iden-tifying the source of events as to the false-alarm rates of sen-sors.
The attributes described in section 4 (probability of at-tack, P(Attackx), the likely originating nodes of an event, Cx, and the probability that the event originator is in this set, P(Cx)) are not specific to any particular type of event detec-tor and can be applied at different levels of abstraction, if necessary within the same system. As described in the in-troduction, this approach is intended to apply to a mixture of event types including both behavioral and network indi-cators. However, different types of events will change the speed with which attackers are discriminated. The network scenario presented here was designed to be a difficult detec-tion problem: it has a low attack rate compared with back-ground noise, for most events the originator could not be uniquely identified, and events were not known to be attacks with certainty. In other words, all three parameters that char-acterize an event were uncertain, inevitably resulting in a long discrimination time. In practice the detection speed will vary depending upon the available information. For exam-ple, behavioral events such as organizational rule-breaking will be uniquely identified with a particular individual, while there may be uncertainty if this indicates a potential attacker; in other cases, such as terrorist use of an Internet cafe, it may be certain that a user during a certain period is an active ter-rorist, but there may be uncertainty related to identification. In practice, therefore, different strengths of evidence will be
found, and these will inevitably result in different detection periods.
The example in section 6.2 illustrates a problem in be-havioral modeling that is less common in networks. How-ever, it is worth noting a specific problem with purely be-havioral events which make more substantial empirical ex-amples difficult to generate: the problem of giving plausi-ble values forP(Attackx). In many circumstances it is pos-sible to measure background levels of user behaviour; for example, document access, Internet use and financial ac-counting deviations are usually recorded, and false alarm rates are a standard metric for intrusion detection sensors. Unfortunately, relevant background levels of minor deviant behaviours, such as organizational rule-breaking or disci-plinary offences, are undocumented for populations of in-terest. Case histories suggest that insiders who attack their systems for profit or revenge often have a history of such be-haviour. Herbig and Wiskoff (2002) record that within 150 espionage cases, 80% were observed to exhibit behaviours that violate criteria in the guidelines for eligibility for access to classified information. For example, the spy Ames had a series of security violations, alcohol problems, and an unex-plained lavish lifestyle. This would certainly provide a rich source of behavioral indicators with no doubt about the in-dividual to whom they relate; unfortunately, the underlying level of such behaviours in the relevant population is un-known. These case studies provide powerful anecdotal evi-dence that behavioral histories are significant, but before any data-analytic approach can be applied in such cases it will be necessary to establish the underlying behavioral norms in populations of concern.
The discussion in section 7 gives one limit to this method: events that do not distinguish between individuals do not add information to the resulting scores. AsCx/P(Cx) ap-proaches the total number of nodes, the score generated by eventxdrops to zero because the event fails to distinguish between individuals. This, however, is a feature of events, and is unlikely to be influenced by attacker behaviour. The attacker can only avoid detection with certainty by adopt-ing behaviour that generates identical events to the rest of the population; from the defender’s perspective the objec-tive is to ensure that the events are sufficiently comprehen-sive to force insiders to either adopt compliant behaviour, or be identified as potentially malicious.
events with their possible sources. Further practical work is also needed to relate the three event parameters to actual in-trusion sensors and networks.
A key practical issue is how to determine which nodes are a potential source of any particular event, and to what de-gree. Ideally this assessment would be evidence-based using recent network history, but although this is feasible in prin-ciple, it is an open question if this can be achieved in prac-tice. However, even simple strategies, such as the one used in section 8.1, provide demonstrable benefit.
10 Conclusion
This paper provides a solution to a critical problem in in-sider attacker discovery: how to combine events from multi-ple sensors, and manage the data explosion that is otherwise needed to support the identification of long-running attacks. The key concept is to move away from maintaining mod-els of the behaviour or sequencing of individual attacks, since this in principle requires a hypothesis to be initiated for each event. This is the process underlying existing Intrusion De-tection Systems which provides an effective response to at-tacks that can be detected over short periods of time but is limited by scalability in identifying attacks developed over a long period.
Instead, we propose to incrementally assess if every node or individual in the system is an attacker. This approach is extremely scalable; the updating algorithm is soundly based in Bayesian statistics and avoids the need for global updating after each event. The approach is well behaved in the sense that higher certainty or volumes of attack make detection faster, and in a worked example which includes several of the difficulties faced in practice it significantly outperforms counting algorithms (see section 8.1).
In addition, this work identifies the attributes or param-eters that need to be standardized for disparate sources of security event to be combined, allowing the use of a wide range of different sources at different levels of abstraction. We provide criteria for event attributes that must be met for an event to add information rather than confusion: the ratio of the number of nodes or individuals that may have orig-inated the event, compared to the size of the system (see section 7).
The process developed here is expected to be applicable to behavioral information, as well as network-derived statis-tics, based on evidence that events such as rule-breaking and security violations are significant in the history of insiders who eventually prove malicious. However, to confirm that data-analytic approaches are able to allow the identification of such insiders it is first necessary to establish the back-ground rates of these events in populations of interest.
Research on this approach is ongoing, both using sim-ulation and relating the work to real situations. The
updat-ing process described in this paper reflects a change of base hypothesis from our earlier publications, and resolves some of the open questions and marginal discrimination observed previously; some remaining open questions are described in section 9.
References
Bace R, Mell P (2001) Intrusion detection systems (IDS). Tech. Rep. SP 800-31, National Institute of Standards and Technology (NIST)
Band SR, Cappelli DM, Fischer LF, Moore AP, Shaw ED, Trzeciak RF (2006) Comparing insider it sabotage and espionage: A model-based analysis. Tech. rep., Carnegie Mellon Software Engineering Institute
Brackney RC, Anderson RH (2004) Understanding the in-sider threat. Tech. Rep. Proceedings of March 2004 Work-shop, RAND National Security Research Division Bradford PG, Brown M, Perdue J, Self B (2004)
To-wards proactive computer-system forensics. In: Interna-tional Conference on Information Technology: Coding and Computing (ITCC 2004), IEEE Computer Society, pp 648 – 652
Buford JF, Lewis L, Jakobson G (2008) Insider threat detection using situation-aware MAS. In: 11th Interna-tional Conference on Information Fusion, IEEE Xplore, Cologne, Germany, pp 1–8
Caputo DD, Stephens GD, Maloof MA (2009) Detecting insider theft of trade secrets. IEEE Security & Privacy 7(6):14–21
CERT Incident Note (1998) IN-98-05: Probes with spoofed IP addresses
Chebrolua S, Abrahama A, Thomas JP (2004) Feature de-duction and ensemble design of intrusion detection sys-tems. Computers and Security 24(4):295–307
Chivers H, Nobles P, Shaikh SA, Clark JA, Chen H (2009) Accumulating evidence of insider attacks. In: The 1st International Workshop on Managing Insider Security Threats (MIST 2009) (In Conjunction with IFIPTM 2009), CEUR Workshop Proceedings
Colombe JB, Stephens G (2004) Statistical profiling and vi-sualization for detection of malicious insider attacks on computer networks. In: The 2004 ACM Workshop on Vi-sualization and Data Mining for Computer Security, ACM Press, pp 138–142
Eberle W, Holder L (2009) Insider threat detection us-ing graph-based approaches. In: Cybersecurity Applica-tions & Technology Conference For Homeland Security (CATCH), IEEE Computer Society, pp 237–241
Heberlein T (2002) Tactical operations and strategic intel-ligence: Sensor purpose and placement. Tech. Rep. TR-2002-04.02, Net Squared, Inc.
Herbig KL, Wiskoff MF (2002) Espionage against the united states by american citizens 1947-2001. Tech. Rep. 02-05, Defense Personnel Security Research Center (PERSEREC)
Nguyen N, Reiher P, Kuenning GH (2003) Detecting insider threats by monitoring system call activity. In: 2003 IEEE Workshop on Information Assurance, IEEE Computer Society, United States Military Academy, West Point, pp 18–20
Randazzo MR, Cappelli D, Keeney M, Moore A, Kowal-ski E (2004) U.S. secret service and CERT coordination center/SEI insider threat study: Illicit cyber activity in the banking and finance sector. Tech. rep., Software Engi-neering Institute, Carnegie Mellon University
Russell S, Norvig P (2010) Artificial Intelligence, 3rd edn. Prentice Hall
Spitzner L (2003) Honeypots: Catching the insider threat. In: 19th Annual Computer Security Applications Confer-ence (ACSAC ’03), IEE Computer Society, pp 170–179 Staniford S, Hoagland JA, McAlerney JM (2002)
Practi-cal automated detection of stealthy portscans. Journal of Computer Security 10(1/2):105–136
Wells JT (2008) Principles of Fraud Examination, 2nd edn. John Wiley & Sons
Howard Chiversis Professor of Information Systems and Director of the Centre for Forensic Computing and Security at Cranfield University, within the Defence Academy of the United Kingdom. His research interests are in system secu-rity and computer forensics, and current secusecu-rity projects in-clude risk management in dynamic collaborative networks, the identification of subtle intrusions within computer net-works, and the security of industrial GRID applications. He is also a security practitioner, providing security advice and methodology for various projects, including air traffic man-agement within the EEC. His previous career includes time in Industry, developing cryptographic products, and Govern-ment, managing the computer security research program of the UK National Authority for Information Security. John A. Clarkis Professor of Critical Systems at the Uni-versity of York. His work is focussed on software engineer-ing (particularly testengineer-ing) and secure systems engineerengineer-ing. He has adopted techniques inspired by natural systems to ad-dress problems including automated testing of implementa-tions against formal specificaimplementa-tions, automated secure proto-col synthesis, the design of cryptographic components, crypt-analysis, and most recently the use of genetic programming to evolve quantum circuitry. Before joining York in 1992 he worked on UK Government-funded evaluation and R&D se-curity projects, and he has provided consultancy to industry on various aspects of dependability modelling.
Philip Noblesis a lecturer within the Centre for Forensic Computing and Security at Cranfield University; his teach-ing and research interests include information security, wire-less networks and cyberwarfare. He has led research projects sponsored by Government, Research Councils and industry, including the development of award-winning wireless cam-eras for the BBC, a recent study on critical national infras-tructure security for CPNI, and a TSB project on the Man-agement of the Complexity, Risk and Resilience of Secure Information Infrastructure. He has contributed to interna-tional standards, and been interviewed on internainterna-tional me-dia, including BBC TV, as an expert on cybercrime, network and internet security.
Siraj A. Shaikhis a Research Fellow at the Department of Informatics and Sensors, Cranfield University, UK. Prior to this, he was a Postdoctoral Research Fellow at the United Nations University-International Institute of Software Tech-nology (UNU-IIST), Macau SAR China. His current research interests include information and network security, in par-ticular intrusion detection. He is a Chartered Member of the British Computer Society (MBCS).