This is a repository copy of Child poverty.
White Rose Research Online URL for this paper:
http://eprints.whiterose.ac.uk/68343/
Book Section:
Bradshaw, J (2011) Child poverty. In: Yeates, N, Haux, T, Jawad, R and Kilkey, M, (eds.) In
Defence of Welfare. Social Policy Association , pp.17-19.
[email protected] https://eprints.whiterose.ac.uk/ Reuse
Items deposited in White Rose Research Online are protected by copyright, with all rights reserved unless indicated otherwise. They may be downloaded and/or printed for private study, or other acts as permitted by national copyright laws. The publisher or other rights holders may allow further reproduction and re-use of the full text version. This is indicated by the licence information on the White Rose Research Online record for the item.
Takedown
If you consider content in White Rose Research Online to be in breach of UK law, please notify us by
EDITED BY
nicola yeates
Tina haux
rana Jawad
majella Kilkey
FOREWORD BY
nicholas Timmins
The Financial Times
spa president
IN DEFENCE OF WELFARE
THE IMPACTS OF THE SPENDING REVIEW
T
he Social Policy Association (SPA) promotes the study of social policy and advances the role of social policy research within policy making, practice and wider public debates. It is a professional association which links academics who teach and research social policy in higher education, postgraduate researchers, policy makers and others. Most of the Association’s members are active teachers and researchers in social policy and applied social science within UK higher education, and a signiicant and growing number of members come from other European, Asian and Australasian countries. We are therefore well-placed to offer expert comment and analysis of current social policy developments both in the UK and internationally. We hope you will take this opportunity to ind out more about the SPA and join us, either through the enclosed membership lealet or via our website: www.social-policy.org.ukThe SPA actively promotes communication and learning between members and with the wider policy and public. Key activities include:
• an academic conference each summer, regularly attracting up to 250 delegates from the UK and overseas;
• support for the two leading international academic social policy journals - Journal of Social Policy and Social Policy and Society;
• a newsletter - Policy World - published three times a year and available online (http:// www.social-policy.org.uk/publications.html);
• regular engagement with UK higher education funding bodies, other learned societies in the humanities and social sciences, policy makers and media;
• a searchable Members’ Directory for academics, media and policy makers to ind academic experts in different policy ields (see below);
• an active network and regular events for social policy post-graduate students.
COMMENT AND CONTACT
Media enquiries: SPA Media Relations, Chris Blunkell (t.) 01227 772747 (m.) 07941 831341 [email protected]
MEMBERS’ DIRECTORY
SPA members regularly provide content to the media. The SPA’s on-line members’ directory allows journalists and others to search members by research interests and expertise (http:// spa.lpl-uk.com/directory1.php#search1) and provides contact details. Alternatively, contact the SPA’s Media Relations Oficer with speciic requests (details above).
SPA ANNUAL CONFERENCE 2011
The SPA Annual Conference 2011 ‘Bigger Societies, Smaller Governments?’ will take place from 4-6 July 2011 at the University Of Lincoln. Plenary sessions so far conirmed include Dr Sarah Cook of the United Nations Research Institute for Social Development, Professor Jan Pahl of the University of Kent, and a session on ‘The Big Society: A new direction for third sector policy in England?’ with Professor Pete Alcock of the University of Birmingham, Karl Wilding of the National Council for Voluntary Organisations and Ruchir Shah of the Scottish Council for Voluntary Organisations. The conference will also include about a hundred papers examining various dimensions of social policy and welfare provision in UK and wider international contexts. More details: www.lincoln.ac.uk/conferences/spa2011.
Nicholas Timmins Foreword 2
The new poliTics oF welFare
4
Mike Brewer and James Browne cuTs To welFare spending 4
Tania Burchardt Fairness 7
Pete Alcock TargeTing and universalism 10
Peter Taylor-Gooby The uK welFare sTaTe going wesT 12
Danny Dorling clearing The poor away 15
implicaTions For speciFic groups and policies
17
Jonathan Bradshaw child poverTy 17
Claire Annesley and Sue Himmelweit women 19
Alan Walker older people 21
Bob Coles youTh 23
Alan Roulstone disaBled people 25
Eugene Grant and Claudia Wood disaBiliTy BeneFiTs 28
Jon Glasby adulT social care 30
Karl Wilding volunTary and communiTy
organisaTions 32
Francis Davis religion and FaiTh communiTies 34
Anne Brunton housing BeneFiT 35
Colin Lindsay welFare ThaT worKs? 37
Sharon Gewirtz and Meg Maguire compulsory educaTion 39
Claire Callender higher educaTion 41
Bob Deacon overseas aid 44
Gerry Mooney scoTland, The csr and puBlic
secTor cuTs 45 Derek Birrell and Ann-Marie Gray a view From norThern ireland 48
Towards an alTernaTive
52
Karen Rowlingson all in This TogeTher? reFlecTions on wealTh, The wealThy and
Fairness 52
Alan Walker and Carol Walker From The poliTics and policy oF The cuTs To an ouTline oF an
opposiTional sTraTegy 54
reFerences
58
Foreword
It was changed in shape, certainly. Less generous in some areas, notably in housing. But in others – not just health and education but also social care and some beneits for the disabled – it had been undeniably bolstered, even if some of the mechanisms that accompanied the extra money, such as the introduction of more market-like mechanisms in the provision of services, remained controversial. Right now, there is no doubt that what is happening is historic. The Coalition has announced the biggest single set of spending cuts since at least the Second World War - £81 billion of them. Many affect the welfare state – with even the relative protection offered to schools and health amounting, in reality, to a reduction in the face of rising demand.
The rise in tuition fees for higher education is a watershed – a partial de-nationalisation of the universities. So too is the ending of child beneit as a universal payment.
Some technical sounding changes – the replacement of the retail price index by the consumer price index for uprating the state second pension and public service pensions will reduce their value by perhaps a quarter over the coming decades unless the formula is again changed.
The cuts to housing beneit have led to fears that the least well off will be forced out of city centres – changing the shape and nature of British society.
Some cherished parts of Labour’s programme to boost social mobility – the child trust fund and educational maintenance allowances, for example – are going.Against that, within the schools budget, there will be a ‘premium’ for disadvantaged pupils.
And then there are policies that accompany the Spending Review – for example the
I
n the middle of history, it is hard toget it right. It can be done. Lord Grey, the British Foreign Secretary in 1914, declared that ‘the lamps are going out all over Europe’ - a phrase that presciently declared that the First World War would change western society forever.
Against that, Richard Titmuss, in his day the doyen of social policy scientists, once declared that an admittedly large increase in the amount of funding that went to the NHS from the more regressive national insurance contributions rather than general taxation, was ‘the inal stick of dynamite under the welfare state’ - a judgement that few would share 50 years on.
Equally, many made the same judgement during Margaret Thatcher’s earlier years as prime minister – her 1980 social security bill consisted of just six clauses, every one of which was a cut. Some of those were indeed game changing. They ended the UK’s tentative move towards a more mainland European-style earnings related beneit system. Some did profound damage – the abolition of the ‘better of earnings or prices’ formula for uprating the basic state pension sent it on a slow downward spiral that undermined both state and private pensions for 30 years. It has only now been halted by the Coalition Government placing a ‘triple lock’ on the increase, so that it will rise by the best of earnings, prices or £2.50 a year – a somewhat bold move, one might say, given the deicit.
On the beneits side, much of the welfare state got meaner in the 1980s and 1990s in the wake of two recessions. Yet by the early 1990s, in the memorable phrase of Julian Le Grand, despite the ‘economic hurricane’ and ‘ideological blizzard’ to which it had been subjected, what was remarkable was how much of the welfare state survived, not how little was left.
Foreword
Foreword
The papers range from the fairly technical, to a call to the social policy community to lead a national campaign in defence of the welfare state, to the judgement that ‘this is how you break a society’.
Time and events will tell. But here, still close to the announcements, is an academic version of ‘the irst rough draft of history’ – an attempt in the middle of it to assess just how profound the impact on welfare, and the welfare state, will be. move to a single, universal credit – that
are not particularly party political in origin but which have the potential for a big impact on their recipients.
The New Politics of Welfare
The new poliTics oF welFare
Prices Index (RPI) or Rossi index (which is the same as the RPI except that it excludes the costs of mortgage interest payments, rent and council tax), as they are at the moment. Because the CPI has historically given a lower measure of inlation than either the RPI or the Rossi index, this is effectively an across-the-board cut to all beneits received by working-age adults (the pension credit guarantee and the Basic State Pension have been spared, since these will be increased in line with earnings rather than prices); the change is, therefore, estimated to save the Government £5.8 billion a year by 2014– 15, a igure that will increase each year as the savings compound.
There are two main reasons for the differences between the RPI and CPI. Firstly, like the Rossi index, the CPI excludes the costs of mortgage interest and council tax (although, unlike Rossi, it includes rent), which have, in the past, tended to rise faster than general prices. Secondly, a technical difference in the way the CPI is calculated means that, even if it covered the same goods as the RPI, it would still give a lower measure of inlation. The Government argues that these differences make the CPI a better measure of the ‘inlation experience’ of households on beneits, on the grounds that beneit recipients are largely insulated from changes in the housing costs the CPI excludes, and that the way the CPI is calculated allows for the fact that households can minimise the impact of price changes on their welfare by substituting away from goods that have become relatively more expensive. The second of these arguments is reasonable, although the irst has been questioned by other Institute for Fiscal Studies
J
une 2010’s Emergency Budget andOctober 2010’s Spending Review were the Coalition Government’s opportunity to prove it was serious about cutting the deicit. Not cutting the deicit is not an option: the inancial crisis and associated recession opened an additional structural hole of approximately 5.8 per cent of national income, or £86 billion per year in today’s terms. Ignoring this would lead to an unsustainable debt path.
But, of course, no political party has ever proposed to do nothing about the deicit. There are choices to be made about how fast to do it, and whether the hole should be illed mostly with tax rises or spending cuts. The previous government suggested illing 70 per cent of this structural hole by 2016/17, but the Coalition Government wants to go further faster, closing the hole entirely by 2014/15. In the general election campaign, the Conservative Party suggested that 80 per cent of the hole be illed by cutting spending, and 20 per cent by increasing taxes. At the time of the election, the other political parties wanted tax rises to do slightly more of the work and spending cuts slightly less, and, in the end, the plans announced in the Spending Review assume that 73 per cent of the work will ultimately be done by spending cuts and 27 per cent by tax rises.
WELFARE CUTS
Of the £80 billion a year spending cuts announced in the Spending Review, £18 billion will be found from cuts in welfare spending by 2014-15. The largest single saving came from the decision to link beneits and tax credits with the Consumer Prices Index (CPI) rather than the Retail
cuTs To welFare spending
The New Politics of Welfare
number of unusual features. First, the means test will be based on individual rather than joint income. This means that, to give an extreme example, a one-earner couple with an income of £44,000 would lose all their child beneit, but two-earner couple where each has an income of £43,000 would keep all their child beneit. Secondly, this reform seriously distorts incentives for some families with children. In particular, parents whose income is just below the higher-rate income tax threshold would ind themselves considerably worse off after a small rise in income as they would effectively lose all their child beneit as soon as their income rose above the higher-rate income tax threshold. The Government argues that using the income tax system to means-test child beneit is less costly than devising a brand-new means-test, and can be implemented more quickly. But the Government could have straightforwardly reduced spending on child beneit by combining it with the child tax credit in some way. Furthermore, the Government expects to lose £280 million a year through parents potentially affected by the loss of child beneit manipulating their taxable income to avoid crossing the higher-rate threshold, which is hardly the sign of a cheap or eficient means-test (HM Treasury/DWP/HMRC, 2010).
The reforms to tax credits mainly involve a more aggressive means-test, with the rate at which tax credits are withdrawn being increased from 39 per cent to 41 per cent from April 2011 and tapering the family element of CTC immediately after the child element is exhausted. This will mean that, from April 2012, a two child family will not receive any tax credits if their income exceeds £31,000. Signiicant sums will also be saved by altering the way in which tax credits respond to changes in circumstances (essentially, allowing parents less time to back-date claims, having tax credits respond more quickly to rises in income, and more slowly to falls in income); it is likely that the number of overpayments will rise as a result. However, the Government has announced above-inlation increases in the per-child element of the child tax credit in 2011 and 2012, at a total cost of £2.4 billion. The combined impact of all these changes on tax credit entitlement is complicated, depending on how many children are in the researchers (Browne and Levell, 2010a).
There are two main criticisms of the Government’s argument. First, households that are already insulated from housing costs because they receive housing beneit and council tax beneit currently have their beneits uprated with the Rossi index, which already excludes these items; for these households, the CPI therefore offers little, if any, improvement in terms of its coverage. (However, once local housing allowance rates are increased in line with the CPI rather than local rents from 2013– 14, the CPI will provide a better coverage for these households, since they will then be exposed to real increases in rents). Second, for households who do not receive means-tested beneits, the coverage of the CPI is less appropriate than the RPI for measuring their inlation experience because such households do tend to face the costs of housing and council tax. The other beneits that will be hit with signiicant cuts are child beneit, the child and working tax credits (CTC/WTC), housing beneit – particularly housing beneit paid to those renting in the private sector, known as Local Housing Allowance (LHA), Disability Living Allowance (DLA) and Employment and Support Allowance (ESA). Most of these are beneits that have seen expenditure rise in real terms over the past 10 or 15 years. But there is no simple reason for these increases: spending on housing beneit did rise considerably during the recent recession, as one would expect, but both the numbers of claimants and average awards had been rising for a number of years before the inancial crisis hit. The increased spending on DLA largely relects higher numbers of recipients (as real entitlements have hardly changed). Spending on tax credits has risen, by contrast, largely through policy decisions taken by the past government to increase entitlements for families with children in real terms.
IMPACT
6
In Defence of Welfare: The Impacts of the Spending Review The New Politics of Welfarestock as well as new claimants, and expects it to reduce the number of claimants by a ifth. It is hard to object to the idea that DLA recipients should undergo a medical test, but clearly the move will make those worse off who in future are denied DLA. Second, the Government has also announced a reform to ESA which will mean that it will be paid for more than 12 months only if a claimant is heavily disabled or if a claimant’s family has such a low income that they qualify for the means-tested variant of ESA.
THEMES
Are there any overarching themes running through these beneit cuts? First, pensioners have been largely spared: the pension credit and basic state pension are not affected by the move to index beneits with the CPI, the stricter disability test for DLA will not apply to Attendance Allowance (the equivalent beneit for pensioners), and universal beneits for pensioners will continue in their non-means-tested form. Secondly, although all working-age beneits have been cut back to some extent, the working-age beneit system as a whole will be more focused on the poorest as a result of these reforms. Third, those families receiving very large payments of beneits and tax credits will be particularly hard hit as a result of family, whether it qualiies for the working
tax credit, and family income.
Much attention has been focused on the changes to local housing allowance (LHA). LHA rates are currently supposed to be set at the median level of rents in a local area; from April 2011, they will be set at the 30 per cent centile, and subject to a nationwide cap on the level and on the property size. Virtually all LHA recipients will lose from these changes. Most should ind, though, they can still afford around 30 per cent of rents in their area; the two groups who will see much bigger falls in their LHA payments are large households currently in properties with 5 or more bedrooms, and those living in Central London, where the nationwide caps will be binding. It is possible, of course, that reductions in LHA rates may lead landlords to reduce rents in response. Arguably a more important change will take place in 2013, from which point LHA rates will be linked to the CPI: this breaks the link between LHA rates and the level of local rents, and some have warned that this reform will lead to many areas being unaffordable to those on LHA in the medium- to long-term.
There are two reforms affecting disability beneits. First, the Government will be introducing a medical test into DLA, modelled on the existing test for ESA claimants. It will apply this to the existing
T
L
H
A
I
A
G
I
F
D
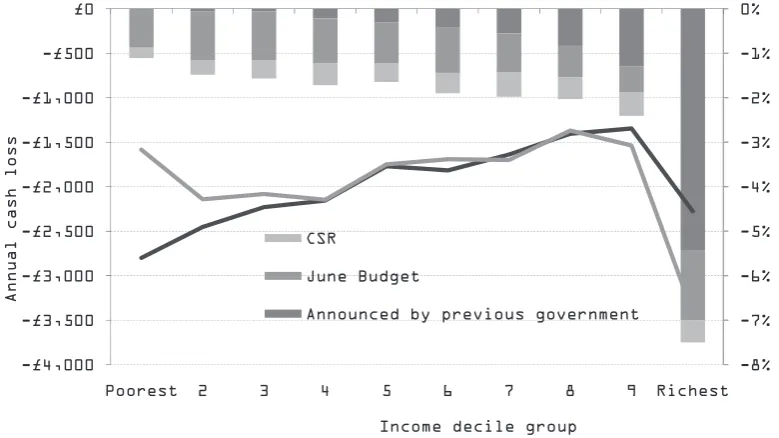
Notes: Income decile groups are derived by dividing all households into 10 equal-sized groups according to income adjusted for household size using the McClements equivalence scale. Decile group 1 contains the poorest tenth of the population, decile group 2 the second poorest, and so on up to decile group 10, which contains the richest tenth. Assumes increases in employer NICs are passed on to employees in the form of lower wages.
Sources: Authors’ calculations using TAXBEN run on the 2008–09 Family Resources Survey and 2008 Expenditure and Food Survey.
T G
J
B
T
T G
W
T
A
G
P
T
-8% -7% -6% -5% -4% -3% -2% -1% 0%
-£4,000 -£3,500 -£3,000 -£2,500 -£2,000 -£1,500 -£1,000 -£500 £0
Poorest 2 3 4 5 6 7 8 9 Richest
A
nn
ual
ca
sh
lo
ss
Income decile group CSR
June Budget
Announced by previous government
[image:9.595.98.488.517.736.2]The New Politics of Welfare
changes to Local Housing Allowance and the beneit cap. Inevitably, the poor will lose more as a percentage of income than the rich from such a large reduction in the overall welfare bill. And, as our distributional analysis of all tax and beneit changes to be introduced between now and 2014–15 in igure 1 shows, the tax rises announced by the Government are not suficient to offset this pattern for the bottom 90 per cent of the population. It is important to recognise, though, that the hardest hit from tax and beneit reforms taking effect between now and 2014–15 will be the very richest, mainly as a result of reforms pre-announced by the previous government.
The Government initially claimed that its June 2010 Budget was progressive, but this was based on a distributional analysis of tax and beneit changes which omitted some of the largest welfare cuts (because the Treasury did not feel it could model precisely which households would be affected). The Government has also claimed that its measures will have no measurable impact on child poverty in 2012-13. We have not yet assessed this second claim, but we have noted that the Treasury’s supporting analysis again omits many of the welfare cuts due in
2012–13. And, given that there are more cuts to welfare beneits in 2012-13 and 2014-15, it would be very surprising if the direct impact of the Government’s changes on child poverty was neutral by the end of the Parliament. The Government has said, though, that it is unfair to judge it on policies due by 2014-15 given that it has not made a inal decision on the level of welfare beneits and tax allowances in that year. In particular, we now know that the Government intends to introduce a Universal Credit, replacing all means-tested beneits and tax credits for those of working age, from 2013. In principle, a uniied system of means-testing will save the Government money, reduce losses to fraud and error, and be simpler and more transparent for claimants. The Government also wants to strengthen the incentive to work facing beneit recipients, particularly for so-called mini-jobs. In the Spending Review, the Government set aside a total of £2 billion to pay for the costs of building new systems, and paying higher beneit entitlements to some claimants. Although we don’t have enough details to be sure, it seems likely that this reform will lead to some low-income families gaining. We hope this will become clearer when the Government legislates for the Universal Credit early in 2011.
Notes: Income decile groups are derived by dividing all households into 10 equal-sized groups according to income adjusted for household size using the McClements equivalence scale. Decile group 1 contains the poorest tenth of the population, decile group 2 the sec-ond poorest, and so on up to decile group 10, which contains the richest tenth. Assumes increases in employer NICs are passed on to employees in the form of lower wages.
Sources: Authors’ calculations using TAXBEN run on the 2008–09 Family Resources Survey and 2008 Expenditure and Food Survey.
budget and the Comprehensive Spending Review (CSR). Indeed according to HM Treasury’s CSR website ‘The Spending Review sets out a new vision for a fairer Britain’ (2010a, accessed 16/11/10). What
T
he Coalition Government has madeconsiderable use of the concept of ‘fairness’ in support of its policies and, in particular, in justifying the package of public spending cuts announced in the June
Fairness
The New Politics of Welfare
unclear. Assuming it refers to those who are currently children and young people, the size of public debt they inherit will be only one determinant of the potential their adult lives hold. The condition of public infrastructure (hospitals, schools, housing stock, railways and roads, etc) and the skills base of the workforce (trained doctors, teachers and engineers) will also be important. There is little advantage to having low public debt if you will not be able to be treated when you are sick, housed when you are homeless, or, less dramatically but no less importantly, unable to make a living because the basic services on which the economy depends are dilapidated, understaffed and under-skilled. Physical and human capital are accumulated over periods of years and decades, but they can be undermined at the stroke of a Chancellor’s pen.
Moreover ‘the next generation’, however deined, is not homogenous. The children and grandchildren of today’s wealthy stand to inherit considerable private wealth, especially in the form of housing assets, and hence will be shielded from the long-term impact of public spending cuts, while the children and grandchildren of today’s social housing tenants are likely to be dependant on public services and transfers to a much greater extent. Saving ‘the next generation’ from high taxes to service a large public debt by cutting today’s and tomorrow’s public spending is of considerable advantage to the next generation of wealthy individuals and of doubtful advantage, and quite possibly signiicant disadvantage, to the remainder of the next generation. Raising the threshold for Inheritance Tax serves only to reinforce the inequality.
SOCIAL MOBILITY
This brings us to the Coalition’s claims to be promoting fairness through enhanced social mobility. Conservative politicians are fond of asserting that social mobility fell under New Labour, and this may indeed be the case, although there is no evidence as yet to support this claim. Social mobility – the extent to which children ind themselves as adults in a different place in the social order, usually deined in terms of earnings or occupation, than their parents – takes a generation, literally, to become manifest.
is meant by ‘fairness’ in this context has been less clear. Signiicant differences of interpretation are apparent in recent statements by the Prime Minister, Deputy Prime Minister and Chancellor:
Cameron: ‘Fairness means giving people what they deserve – and what people deserve depends on how they behave.’
(speech to Conservative Party conference, 6/10/10 – Conservatives 2010)
Clegg: ‘It is simply not acceptable that the circumstances of a child’s birth can become a life sentence of disadvantage.’
(announcing ‘fairness premium’, 15/10/10 – Liberal Democrats 2010) Osborne: ‘[F]airness – that we are all in this together and all must make a contribution. Fairness means creating a welfare system that helps the vulnerable, supports people into work, and is also affordable for the working families who pay for it from their taxes. Fairness also means that across the entire deicit reduction plan, those with the broadest shoulders should bear the greatest burden. Those with the most should pay the most, including our banks.’ (CSR speech, 20/10/10 - HM Treasury 2010d)
‘There is nothing fair about running huge budget deicits, and burdening future generations with the debts we ourselves are not prepared to pay.’ (CSR speech, 20/10/10 – HM Treasury 2010d)
Fairness, it seems, encompasses something about a concern with intergenerational justice, issues of social mobility, a principle of universal but progressive contributions, just deserts and the protection of the worst-off. Almost any individual policy could be justiied by appeal to one or more of these ideas, but if we take the package of tax and spending cuts as a whole, to what extent can they be seen as promoting any of these concepts of justice?
INTERGENERATIONAL JUSTICE
The New Politics of Welfare
Thirdly, international evidence suggests that countries with high inequality at a point in time (‘cross-sectional inequality’) tend to have low social mobility and countries with low cross-sectional inequality tend to have higher social mobility (Blanden, 2009). This also makes sense intuitively: it is easier to climb a ladder if the steps are relatively close together. So one route to promoting social mobility would be to reduce inequality in the here and now.
FAIRNESS
This brings us to the Coalition’s third interpretation of fairness – that they are protecting the most vulnerable, and ensuring the burden of cuts is borne by those with the ‘broadest shoulders’. Were this the case, it would be an equality-promoting package and hence could also have a positive effect on social mobility. This concept of fairness is closely associated with the liberal egalitarian political philosopher John Rawls, whose ‘maximin’ principle requires that priority be given to the worst off. To what extent does the package of cuts in the Budget and CSR meet this criterion?
The analysis in Annex B of the Treasury’s Spending Review document (HM Treasury 2010a), suggests that the combined effect of changes in taxes, beneits and services is mildly progressive by 2012-13, with the top ifth of the income distribution losing most (as a proportion of their combined income and the value of beneits-in-kind they receive), while the one-but-top ifth and the bottom ifth of the income distribution lose least. However, independent analysis by the Institute for Fiscal Studies (Browne and Levell 2010b) gives a rather different picture. The HMT analysis omits the impact of the reforms of Housing Beneit, Employment and Support Allowance, Disability Living Allowance and Council Tax Beneit, all of which are likely to have a larger negative effect on the poorest half of the income distribution. It also omits around two-thirds of the cuts to departmental spending, on the grounds that the impact on households cannot be clearly allocated. Moreover, the Treasury analysis of taxes and beneits stops at 2012-13, leaving a further £10.7 billion of the proposed £18 billion welfare cuts still However, research on previous generations
of young people going on into adulthood has revealed a number of factors that promote or hinder social mobility. Firstly, we know that experiencing unemployment early on in your labour market career has a long-term adverse effect on your earnings and employment chances, a so-called ‘scarring effect’ (Gregg, 2001). Hence, the particularly high rates of youth unemployment during the current recession – reaching 21 per cent for men aged 18-24, according to the Labour Force Survey - are likely to be extremely damaging for today’s young people not only in the here and now, but also for their prospects of achieving upwards social mobility. The loss of hundreds of thousands of public sector jobs and related private sector jobs just as the country is apparently emerging from recession is not offering a helping hand to these young people.
The New Politics of Welfare
enforcement and keeping the peace. Instead, people are expected to come together in voluntary collectives and decide among themselves to support community projects - a vision which appears to have much in common with the ‘Big Society’. As critics of libertarian philosophy have been quick to point out, the effects are likely to be a polarisation between the ‘haves’ and ‘have-nots’, particularly when the starting point is very unequal and when residential patterns overlap geographically with socio-economic segregation.
Yet this libertarian philosophy is ‘out of sync’ with the British public. Evidence from the British Social Attitudes survey has shown that nearly three-quarters (73 per cent) believe the gap between those with high and low incomes is too large, and a similar proportion (69 per cent) believe it is right that taxes paid by the majority help to support those in need (Sefton, 2005). As the cuts begin to take effect, the underlying rationale of the Coalition’s policies will become ever more apparent. The expectation must be that it will also be increasingly unpopular, and that any claims of ‘fairness’ will soon ring hollow.
to come into force. Correcting for these limitations in the HMT analysis as far as possible – which necessitates making some assumptions about the future incidence of welfare cuts and about the value of services to different family types – Reed (2010) concludes that the bottom tenth of the income distribution will be hardest hit, losing around 11 per cent of their combined net income and the value of public services they receive per year, compared to approximately 4.5 per cent per year for the top tenth of the income distribution.
Finally, we can consider whether the Coalition’s policies support the ‘just deserts’ interpretation of justice relected in the Cameron quote at the beginning of this paper. This is perhaps closest to the libertarian theory of justice, associated with the political philosopher Robert Nozick, according to which people are entitled to the full fruits of their labour and to their assets, provided they have been obtained through fair exchange. Hence there is no justiication for compulsory redistribution, or taxation to fund public goods. The role of the state is limited to contract
signiicant, and can lead to major problems in the delivery of welfare services. Targeting aims to focus support only upon those who are in need. This can mean targeting by need, for example, the support services provided for some people with disabilities. More usually, however, it tends to mean targeting support upon those unable to provide for themselves because of low income or lack of independent income, and it requires those seeking such support to undergo a test of their means to determine entitlement.
Such means-tests are relatively expensive to administer, because they require detailed, and ongoing, checks in order to determine
T
argeting and universalism are issuesat the centre of social policy practice and analysis. We have both targeting and universalism within our welfare system, and policy development seeks to balance a constant tension between the two. This tension contains both practical implications and clashes of principle. In practice it matters because the choice between targeting and universalism has major consequences for the way welfare services are designed and delivered. In principle the different approaches address central concerns of social policy in very different ways.
The practical consequences of targeting are
TargeTing and universalism
The New Politics of Welfare
for some recipients, which in extreme cases could exceed 90 per cent. That is, for each extra pound earned, up to 90 pence could be lost through withdrawal of credits and other forms of means-tested support. The planned changes to Housing Beneit are being made in part to minimise the problems caused by higher beneit levels for the unemployed than for those on low pay – without raising support for the low paid which would exacerbate the poverty trap. However, these changes seem likely to price these Housing Beneit claimants out of the housing market in many inner city areas, leading to evictions and re-housing – again potentially with higher costs elsewhere and increased administrative intervention. Whatever the desirability in principle, more targeting inevitably leads to greater practical problems.
However, there are issues of principle too. The new Government has stated its commitment to policy being driven by a concern for fairness. Targeting is fair in one sense, they suggest, because it pays each according to their needs. But this raises dificult questions about what is need, and who decides this. In the case of Child Beneit, for instance, arguably it is the children’s needs which are being met, through payment to their carer – and children’s basic needs are the same whatever the circumstances of their parents. More generally though there is a social dimension to need, and to beneit. Child Beneit is also an investment in future generations for everyone’s beneit – we all need children to grow up it, healthy and well cared for. So is it fair to target the high rate taxpayers with children for an increased contribution to this investment, rather than higher rate taxpayers in general?
This raises the more general question about who pays for, as well as who beneits from, welfare services; and here the principles of equality and inclusion also compete with fairness. Any commitment to equality within welfare provision requires us to pay attention to who pays as well as who beneits, as the collective investment in children demonstrates. If the notion of fairness does not also embrace this, then it is only addressing one part of the welfare contract – and the absence of focus on taxation policy within the Spending Review entitlement. These are complex for claimants
The New Politics of Welfare
suggests such a narrower approach may at the moment be more inluential.
Who pays for welfare matters for another reason, however; and this is because it is through paying for, as well as beneitting from, welfare services that all citizens feel included in them. One of the reasons for the continuing popularity and high engagement with the NHS is the fact that all pay for, and beneit from, it. It was also the principle behind Beveridge’s National Insurance (NI) scheme, established at the same time, and this remains a continuing source of popular support for NI through the belief that contributors have paid for their pensions or other beneits. Although in practice the complexity of NI entitlement makes this relationship less effective on the ground, and its legitimacy was undermined by Labour Government increases in contributions to meet more general taxation needs.
Universal services are popular because all are included within and contribute to them; and, ironically, this appeals to another notion of fairness – that paying for something justiies beneitting from it. It makes it easier to equalise beneits, since all get the same, whilst redistributing through
contributions, since all pay what they can afford. It also promotes inclusion as all are both paying for and beneiting from public support, whereas targeted support has sometimes been associated with stigma for those receiving beneits which are seen to be ‘only for the poor’.
The role of targeting has been growing signiicantly within social policy for some time now, and the Spending Reviews are likely to accentuate this drift. Nevertheless the principles of universalism remain central to much social policy delivery and debate. The tension between targeting and universalism continues to be very much in balance therefore. Support for universalism could be encouraged through appeals to the alternative approach to the principles of fairness and inclusion that it offers – fair because all do over time contribute to cost of services and beneits, and inclusive because all beneit from them. At the same time the practical problems of targeting in high administrative costs, failure to take-up entitlement and high marginal tax rates, will be likely to dominate the delivery of means-tested support. When concerns over these arise, as inevitably they will, policy makers will know that there is an alternative.
one that is not being taken by anyone who has a choice in the matter. The weaker Mediterranean and Celtic governments are not in a position to preserve their social settlements because they cannot maintain the incomes from taxation or borrowing to do so. The British experiment may work, in the sense of restoring growth. If it does we will undergo a painful transition, but wake up in a very different world, one that is more competitive and more prosperous but more unequal. Restructured Britain will be able to offer good lives to the advantaged but not to more vulnerable groups, and will be less humane than Europe at its best.
B
ritain has abandoned its attempt to join the European tradition of state welfare and is making a decisive move towards the US/liberal model of market capitalism. This is implicit in the discussion of policies in various areas elsewhere in this volume. It emerges clearly when patterns of overall spending, privatisation, management of the labour market, social divisions and insecurity are considered. The British approach offers a qualitatively different solution to the problem that faces all advanced economies: how to maintain competitive position in an expanding world, where other economies are growing rapidly. It is a gamble andThe uK welFare sTaTe going wesT
The New Politics of Welfare
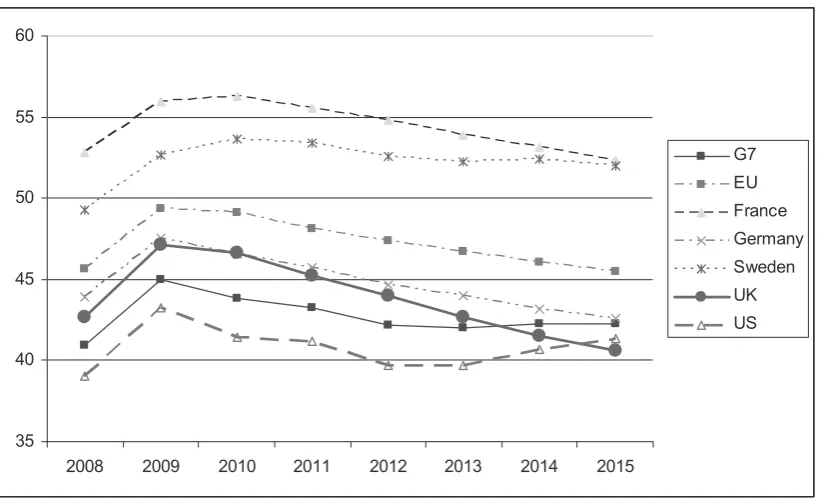
increases elsewhere in Europe tended to include a much greater proportion of labour market subsidies, most notably the state-inanced ‘training schemes’ that effectively took many core workers off company payrolls at the height of the downturn in Germany, France and Italy. These have been followed by measures to reduce social insurance contributions and help particular groups, younger unemployed people and long-term unemployed (OECD, 2010). Where the UK stands out is in the spending trajectory after 2009-10 (see Figure 2). The combination of the previous government’s March 2010 Budget, the June 2010 Emergency Budget and the September 2010 Comprehensive Spending Review set state spending on a downward course steeper than in any major European country, so that it falls below G7 levels and that of the US by 2014-15. The G7 includes Germany, France, Italy and Canada, as well as the US and Japan, so a position below spending levels averaged across these countries is not a new experience (but one that is instructive to those considering how the UK stands in international comparison). What should be noted is that this is the irst time UK public spending has ever fallen below that in the US. This fact brings home how substantial
SPENDING TRAJECTORIES
[image:16.595.72.482.86.335.2]The overall pattern of public spending across Western economies in the early years of this century was of a more or less steady state in the context of continuing growth. This was succeeded by a sharp rise from 2007-8 in response to the demands to rescue favoured industries, provide investment capital and manage unemployment. Spending follows the usual cyclical pattern of spending, relatively lower when GDP rises rapidly, higher during recession, because GDP is relatively lower and the demands are greater. It is exaggerated by the scale of the crisis. Public spending in the UK had been climbing painfully from the low position of the late 1990s towards the level of the more developed European countries. This relects reforms to expand the NHS, education and social care, and tax credit and other subsidies towards those on lower incomes and improvements in pensions. In common with many countries, spending ceased to rise from 2004-5 so that the (limited) progress towards a mitigation of poverty came to an end. The UK and US with their relatively large and needy inancial sectors experienced a particularly rapid rise in demands on the exchequer between 2007 and 2009. The spending
Figure 2: Public Spending Trends, Selected Advanced Economies 2008-15 IMF (per cent GDP)
Source: IMF (2010)
35 40 45 50 55 60
2008 2009 2010 2011 2012 2013 2014 2015
G7 EU France Germany Sweden UK US
Source: IMF (2010)
The impact of the new policies
One feature of the changes is that the UK Government has decided to reduce support for the economy more rapidly than any other major economy. Centre-right commentators sometimes interpret the cuts package as simply a return to the normal British pattern. After all, spending during the years of growth in the late 1980s, late 1990s and early 2000s was at about the 40 per cent level. This argument misses the point.
First, the period in which spending in the UK is to be abruptly cut back is not expected to be a boom, but rather a cautious return to growth, with high levels of unemployment imposing particular demands on the state. Second, as other chapters point out, the cuts for the mass services, health care, education and pensions, will be much less severe than for the benefits directed at low income minorities. The protected areas account for about half of all public spending. The 2009-15 cuts impact on poor groups in a way that previous cyclical shifts in public spending have not. The shift away from European social protection and solidarity is part of a programme that imposes a more insecure, market-centred system.
The spending cuts and competition rules in relation to local government open up opportunities for private providers to take over services, and make it increasingly difficult for local authorities who wish to keep provision in-house. It seems likely that many GP consortia will not have the resources to manage services effectively in the new NHS and will use private companies to do so. The move to extend academy status eventually across all state schools opens up a range of opportunities for private education management firms. The free schools currently under consideration will be mostly run by private companies. In higher education the Browne review signals a shift to a largely market-centred user-financed system. The Government has indicated openness to private providers to attain university status.
The New Politics of Welfare
will be extended to substantial numbers among those currently receiving sickness and disability beneits. Related reforms to tax-credit, rent beneits and to social housing and the greater targeting of the more universal beneits will intensify the dificulties faced by those at the bottom further.
These changes are likely to be associated with further social divisions and a continuation of the pattern of growing inequality traced by Atkinson (2007) across advanced countries during the past quarter-century. In particular the imposition of greater costs for child care (through cut-back of schemes), higher education, and housing (through rent beneit reforms and the move to 80 per cent market rents for new social housing) will damage those towards the bottom, but not better-off groups.
The shift towards the market, the contraction of state sector and expansion of private sector employment and the current likelihood that employment protection will be weakened will lead to greater insecurity in many people’s lives.
THE NEW GROWTH MODEL
These changes are sometimes seen as the normal centre-right market-centred programme, facilitated by the opportunity to advance an exceptionally stringent cuts package that the crisis offers. An alternative approach is to understand them as a conscious restructuring, intended to resolve a long-standing problem. The UK, like many western countries, lourished during the irst 19th century
era of globalisation through industrial, imperial and military pre-eminence. That era ended in the conlicts between the post imperial powers of the irst half of the 20th
century. The post second world war boom under US hegemony provided 30 years of stability. From the 1970s globalisation has reasserted itself, this time with the centres of economic dynamism elsewhere.
Europe (and the UK) may continue to achieve real growth. In fact the UK grew rather faster than the main European economies during the boom between 1997 and 2008. The problem is one of relative decline, as centres elsewhere grow much a shift is contained in the current policy
package.
THE IMPACT OF THE NEW POLICIES
One feature of the changes is that the UK Government has decided to reduce support for the economy more rapidly than any other major economy. Centre-right commentators sometimes interpret the cuts package as simply a return to the normal British pattern. After all, spending during the years of growth in the late 1980s, late 1990s and early 2000s was at about the 40 per cent level. This argument misses the point.
First, the period in which spending in the UK is to be abruptly cut back is not expected to be a boom, but rather a cautious return to growth, with high levels of unemployment imposing particular demands on the state. Second, as other chapters point out, the cuts for the mass services, health care, education and pensions, will be much less severe than for the beneits directed at low income minorities. The protected areas account for about half of all public spending. The 2009-15 cuts impact on poor groups in a way that previous cyclical shifts in public spending have not. The shift away from European social protection and solidarity is part of a programme that imposes a more insecure, market-centred system.
The spending cuts and competition rules in relation to local government open up opportunities for private providers to take over services, and make it increasingly dificult for local authorities who wish to keep provision in-house. It seems likely that many GP consortia will not have the resources to manage services effectively in the new NHS and will use private companies to do so. The move to extend academy status eventually across all state schools opens up a range of opportunities for private education management irms. The free schools currently under consideration will be mostly run by private companies. In higher education the Browne review signals a shift to a largely market-centred user-inanced system. The Government has indicated openness to private providers to attain university status.
The New Politics of Welfare
rests on achieving competitiveness by offering low taxes, a deregulated market-place and a relatively cheap and highly-motivated work-force for a country at a north European level of development. Leading to sharp and continuing cuts in the social wage, a weakening of employment protection and the intrusion of market-competitiveness across society – and perhaps a more dynamic and luid society. If you can’t beat the leading European powers at their game, you might as well try the American model.
The US has had growth of about 100 per cent during the past 30 years and productivity gains of over 80 per cent, but the incomes of most of the population have only risen by 9 per cent. Median full-time men’s wages have been largely static and this limited rise is a real increase in women’s wages (Wasow, 2008). The gains of economic progress have gone almost entirely to the top 20 per cent, most of them to the top two per cent (Hacker and Pierson, 2010). Advocates of the US solution should remember that, in liberal competitive capitalism with a weak labour movement and limited social protection, it’s the rich that gets the gravy.
faster. The UK’s share of world total GDP shrank from about four and a quarter per cent in 1980 to two and three-quarter per cent by 2010 and is predicted to continue to decline (IMF, 2010). This is what underlies the fear that the loss of the political and military power associated with economic domination condemns Britain to backwater status. One response is that of Germany and to some extent France and associated countries: an integrated corporatist welfare model that sustains high value-added, high productivity export industries, able to retain comparative advantage by competing on quality.
Britain has gradually lost its position as a major exporter. One possible growth path sought to emulate Germany with the welfare state conceived as investment in human capital. Such policies, under Wilson and Blair, have not provided the basis for stable growth. Another approach highlights the contribution of the new service sector industries, notably the inance sector. These have failed to generate wealth in suficient volumes or with suficient stability to secure national prosperity. The welfare reforms are best understood as part of a different growth strategy. This
is adept at dealing with callousness. His immediate reaction to the cheering that greeted the Government announcements was that for many Coalition MPs it was now obvious that ‘this is what they came into politics for’. George Osborne (39), who became an MP in 2001, ended his speech saying he had brought sanity to our public inances and civility to our economy. The printed version of his speech suggests the word was ‘stability’, not ‘civility’, but George was mumbling at that point and I think that he thinks he is civilised.
Osborne announced that housing beneit will not be paid for people under the age of
T
he Comprehensive Spending Reviewannounced the start of a new era of engineered social polarisation; a further separation of the lives, hopes, homes and chances of rich and poor.
One of the irst announcements was that new tenants of council and other social housing will now have to pay at least 80 percent of market prices in rent. In one stroke millions of low paid families are to be excluded from living in hundreds of towns, cities and villages where they no longer earn enough to ‘deserve’ to be. At age 60, shadow Chancellor Alan Johnston
clearing The poor away
The New Politics of Welfare
when combined with all the Chancellor’s other measures, means that child poverty will rise - despite what he suggested in this speech.
But not everyone loses out. More afluent savers who lost money they invested in Equitable Life and the Presbyterian Mutual Society will soon receive £1.7 billion from tax payers - mostly from tax payers poorer than them. Thus money is being redistributed towards the afluent. And there will be more property for the afluent to buy with these windfalls in and around London, in villages and in market towns, as the poor vacate their homes for cheaper places to live.
Raising the cap on train fares will mean that those who do move out to make ends meet will end up paying even more to get into London and other cities for work. Local government will be allowed to borrow more in richer areas, against expected business rates, instead of Westminster borrowing, so that the places where business makes a lot of money can be spruced up. Local government in poorer areas cannot make such newly permitted borrowing.
George Osborne (39) is younger than me, and I am still a relatively young university professor. His work experience has been limited to shelf-stacking and a few weeks of iling in the NHS. Danny Alexander, the chief secretary to the treasury, is even younger (38). For a year he had a job outside of politics, doing PR for a national park. Between them, these inexperienced young men - who as far as I know have never been on the dole - announced a huge raft of cuts which their own igures say will directly make half a million public servants redundant.
The former Conservative Chancellor, and current secretary of state for justice, Ken Clark (69), had warned of a double-dip recession if cuts were savage. On 21 October, Teresa Perchard, director of policy at the Citizens Advice Bureau, warned that housing beneit changes would ‘create a group of nomads…maybe not where the jobs are.’ On the same BBC radio programme, Alan Johnston said that Osborne’s speech was ‘unfair, unwise and untruthful in some of the statistics’ and that the Chancellor was ‘asking children 35 who live alone - this previously applied
only to those under 25. There would be a 10 per cent cut in council tax beneit for those who can not afford to live in certain areas. The few remaining people living on modest incomes near afluent suburbs or in economically successful towns and villages are to be cleansed away.
We now know that the Spending Review is at least as regressive as the June budget, as were the cuts announced for local council core funding. The best-off ifth of society will lose just 1 percent of their entitlements to public services and spending, the lowest losses of any group. Furthermore, a million people currently on employment and support allowance due to ill health will each loose £2,000 a year if they cannot ind a job. Osborne announced further privatisation of pensions, with the state pension age rising rapidly to 66 years. Only those with private provision can now retire at the normal age. Public sector pensioners will have £1.8 billion removed from them by 2014-15. This will further impoverish many of that group. Pension credits will be frozen for three years. No family on beneits is to receive more than the income of an average family in work, no matter what the circumstances of their children. If you are poor - or are made poor when you lose your job or have a pay cut forced on you - and have three or more children, you may need to leave your town for a new life in a cheaper area, away from where the remaining well paid work is.
Implicationations for Speciic Group and Polices
(and people made newly poor) from more prosperous areas of the country. Many younger people will now go abroad to ind work or a university place. Many of them will never return. Poorer families will struggle the most, but fewer will be visible through the windows of ministerial cars. This is how you break a society.
to make a bigger contribution than the banks’.
There were a huge number of alternatives to what took place on Wednesday 20 October 2010, but few of those alternatives would have resulted in the clearing and cleansing out of so many poorer people
This article is reproduced by kind permission of Socialist Review
implicaTions For speciFic
groups and policies
material deprivation between 2004/5 and 2008/9.
• Over the period since 1997 there has been a signiicant change in the composition of poor children. In 1996/97 55 per cent lived in workless families. By 2008/09 only 41 per cent lived in workless families (before housing costs).
Child poverty needs to fall by 1.1 million between 2008/09 and 2010/11 to meet the 2010 target of halving child poverty. Poor children may have beneited from the falling level of inlation in 2009/10 which meant that beneits and tax credits grew in real terms. The bringing forward of the April 2010 uprating might also have helped. However this is likely to have been offset by growing unemployment in 2009/10 and increasing inlation in 2010. The Institute for Fiscal Studies (Brewer et al., 2009) had predicted a fall in the number of children in poverty by a further 600,000 by 2010/11 given announced policies, but Joyce et al (2010) for IFS now believe this prediction is too optimistic.
THE STATE OF CHILD POVERTY AT THE GENERAL ELECTION
The Labour Government’s aspiration to halve child poverty by 2010/11 is not going to be met. The strategy ran out of steam after they had (just) failed to meet the ive year target to reduce child poverty by a quarter by 2004/5. At the time of writing, the latest data we have is Households Below Average Income for 2008/9. It shows that
• There was no reduction in the percentage of children living below 60 per cent of contemporary median income between 2003/4 and 2008/9, either before or after housing costs.
• There was no reduction in the percentage of children living below 60 per cent of the 1998/99 median income held constant in real terms between 2004/5 and 2008/9 after housing costs and a 1 per cent reduction before housing costs.
• There was no reduction in the percentage of children falling below the thresholds of low income and
child poverTy
Implicationations for Speciic Group and Polices
free school meals to poor families in employment.
• Withdrawing Child Beneit from higher rate tax payers will not hurt the poor in the short-term but child beneit may suffer in the long term.
• Freezing Child Beneit for three years from 2011.
• Freezing Working Tax Credit for three years.
• Removing the baby element and proposed toddler element in Child Tax Credit.
• Lone parents to be expected to look for work once their youngest child reaches school age, from October 2011
• Surestart maternity grant restricted to the irst child only.
• A £2500 disregard will be introduced into Tax Credit for in-year falls in income and in-year rises in income that will be disregarded from calculations of Tax Credit, will decrease from £25,000 to £10,000 in 2011 and then to £5000 in 2013.
• Cutting spending on Council Tax Beneit and making it a local function.
• Introducing a beneit cap will reduce the incomes of large families with children – the Government estimates 50,000.
• Increasing VAT from 17.5 to 20 per cent.
• Introducing a Housing Beneit cap and reduction in local housing allowances.
• Withdrawing entitlement to Working Tax Credit of couples with children working 16-24 hours per week.
• Uprating all beneits in line with the CPI instead of the RPI or Rossi index. The Government has launched a consultation on its approach to ending child poverty and improving life chances(http:// www.education.gov.uk/consultations/ index.cfm?action=consultationDetails& consultationId=1737&external=no&me nu=1). As part of this the independent Child Poverty Commission, which was required under the Child Poverty Act, is being reviewed. Meanwhile the Frank Field Independent Review of Poverty and Life Chances (http://povertyreview. independent.gov.uk/media/20254/ poverty-report.pdf) has been published including recommendations to: invest in a Foundation Stage using resources Even if it was achieved the number of
children in poverty in 2010/11 would still exceed the target by 600,000.
The Child Poverty Act was passed just before the General Election with all party support. It sets clear and speciic legal targets to eradicate child poverty by 2020. The Act requires the Government to publish a national strategy by 25 March 2011.
NOW THE CUTS
The Government has decided to reduce the deicit by £81 billion by 2014/15. It chose to achieve this by taking 80 per cent from spending and 20 per cent from tax increases – though it looks now as if that balance is going to be 73/27 per cent. We now have had the emergency budget of June 2010 and the results of the Comprehensive Spending Review on 20 October 2010.
There are three announcements that will help child poverty
• The child element of child tax credit will be uprated by £180 per year above indexation in 2011/12 and £110 above indexation in 2012/13.
• The income tax personal allowance threshold will increase by £1000 in 20011/12 and will beneit earners with incomes above the tax threshold, not just those with children.
• The 1 per cent increase in national insurance contributions announced by the previous government has been scrapped. This helps all earners above the threshold.
Below is a much longer list of measures that are likely to increase child poverty. They are in no particular order:
• The maximum limit of childcare costs met under Working Tax Credit will be reduced from 80 per cent to 70 per cent - this could cost families up to £30 per week.
• Abolishing Educational Maintenance Allowances before the school leaving age is increased.
• Abolishing the Health in Pregnancy Grant.
• Abolishing Child Trust Funds.
Implicationations for Speciic Group and Polices
Overall the distributional consequences of the measures are regressive (Browne and Levell, 2010b) (though the Government seeks to deny this). The Government has claimed that the Spending Review had no ‘measurable’ impact on child poverty in the next two years. What happens then? From a fairness perspective it looks as though pensioners have emerged relatively unscathed while poor women and children are hit hardest.
that would go to child cash beneits; and introduce a new set of Life Chances Indicators.
It will take some time to assess fully the overall impact of this package but the work has begun (Family Action, 2010). There is also the impact on poor children of cuts in capital spending, general central and local government services (such as Surestart), and the loss of 500,000 public sector jobs.
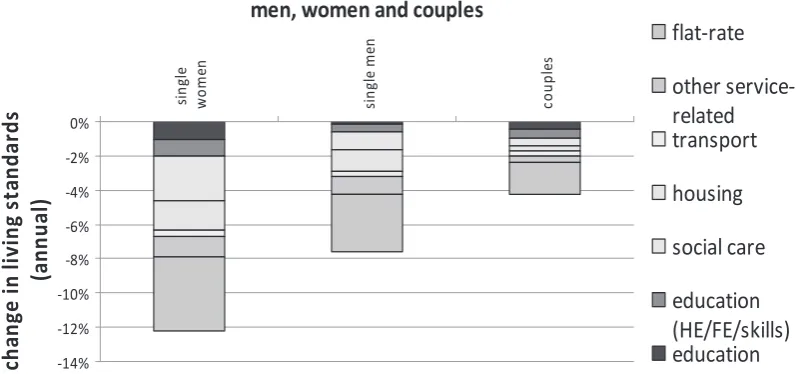
disproportionately on the public services women use as well as on their jobs and incomes. The cuts amount to an immense reduction in the standard of living and inancial independence of millions of women. Collaboration with Howard Reed, Landman Economics, enabled the WBG to produce the irst gendered impact assessment of the cuts to public services by examining the distribution of the cuts between households with different gender characteristics (ibid). We ind that the groups that will suffer the greatest reduction in their standard of living due to cuts in public services are lone parents and single pensioners, the majority of whom are women. Lone parents will lose services worth 18.5 per cent and female single pensioners, services worth 12 per cent of their respective incomes (see igure 3).
Overall, single women will lose services worth 60 per cent more than the value of services single men will lose as proportions of their respective incomes, and nearly three times those lost by couples (see igure 4).
JOB LOSSES
Using data from the Labour Force Survey, the WBG inds that the cuts will lead to hundreds of thousands of job losses for
T
he UK Women’s Budget Group (WBG)welcomes the emphasis that the Coalition has placed in the Spending Review on fairness and social mobility. The extension of 15 hours free early education and care to all disadvantaged 2-3 year olds from 2012-13 is to be applauded. However, its approach to fairness fails to acknowledge that men and women start from unequal positions, and that there are many barriers to social mobility other than lack of educational qualiications. Unequal employment opportunities and unpaid caring responsibilities are just two examples.
We also welcome the Treasury’s attempt to produce an Equalities Impact Assessment of its spending decisions, following its failure to comply with this legal requirement for the June Emergency Budget. But we ind its Impact Assessment inadequate. It provides almost no quantitative data on how men and women will be affected by its decisions and it excludes most aspects of the Spending Review, claiming either that there is no impact or that the impact is impossible to measure.
The Women’s Budget Group has produced its own Gender Impact Assessment of the Spending Review (WBG, 2010) and inds that the record cuts to the public sector services and welfare budget impact