Int. J. Electrochem. Sci., 8 (2013) 1469 - 1486
International Journal of
ELECTROCHEMICAL
SCIENCE
www.electrochemsci.orgModified Carbon Paste Ion Selective Electrodes for the
Determination of Iron (III) in Water, Soil and Fish Tissue
Samples
Tamer Awad Ali1,*, Gehad G. Mohamed2, Maher M.I. El-Dessouky2, Salwa M. Abou El Ella3, Rabab T. F. Mohamed3
1
Department of Petroleum Applications, Egyptian Petroleum Research Institute (EPRI), 1 Ahmed El-Zomor St., Nasr City, 11727, Cairo, Egypt.
2
Chemistry Department, Faculty of Science, Cairo University, 12613, Giza, Egypt.
3
National Water Research Center, Egypt
*
E-mail: [email protected]
Received: 4 September 2012 / Accepted: 27 November 2012 / Published: 1 January 2013
The construction, performance characteristics, and application of iron(III) sensors based on (5,5'-(propane-1,3-diylbis(sulfanediyl))bis(3-benzyl-4H-1,2,4-triazol-4-amine) (ionophore A), 5,5'-(butane-1,4-diylbis(sulfanediyl))bis(3-benzyl-4H-1,2,4-triazol-4-amine) (ionophore B), 7,8,16,17-tetrahydrodibenzo[e,m] [1,4,8,11]dioxadiazacyclotetra-decine (ionophore C) and [3{(1E)-2-[3-2-[3-[(1E)-2-aza-2-(3-carboxyphenyl)vinyl]phenoxy}-ethoxy)phenyl1]-1-azavinyl} benzoic acid (ionophore D) are reported in this paper. The sensors are prepared by incorporating of A, B, C and D ionophores into a plasticized carbon paste electrodes to form electrodes I, II, III and IV, respectively. Under the optimized conditions, the electrodes reveal Nernstian slopes of 20±0.32, 20.3±0.46, 19.2±0.62 and 21±0.25 mV decade-1
over a wide concentration range from 1 × 10⁻⁶ to 1 × 10⁻² mol L-1 with a detection limit of 6.4 × 10⁻⁷, 6.4 × 10⁻⁷, 1 × 10⁻⁶ and 4.8 × 10⁻⁷ mol L-1 at pH range from 1.8- 3, 1.8- 3, 2- 3.5 and 1.8- 3.5 for electrodes I, II, III and IV, respectively. The sensors are stable for 86, 74, 66 and 95 days for electrodes I, II, III and IV, respectively. without any measurable divergence in the potential characteristics and exhibit good selectivity with respect to alkali, alkaline earth and transition metal ions (e.g. Na(I), K(I), Ba(II), Ca(II), Zn(II), Cd(III), Co(II), Mn(II), Ni(II), Cu(II), Pb(II) and Al(III)). This method is successfully applied for potentiomertric determination of Fe(III) in water, soil and fish tissue samples, and the results obtained agreed with those obtained with atomic absorption spectrometer (AAS).
1. INTRODUCTION
Iron is widely distributed in nature and it is one of the most important elements in environmental and biological systems. Iron plays a crucial role in a variety of cellular events and indeed no life form is possible without this element with a few possible exceptions in bacterial world [1- 2]. Though it is an essential element for all living systems, the gradual accumulation of iron leads to a number of diseases [3- 9]. Excess of iron in body causes liver and kidney damage (haemochromatosis), whereas its deficiency adversely affects the health leading to anaemia [10- 12]. Moreover, iron compounds are also potential carcinogens.
Several methods for the determination of iron are available, including inductively coupled plasma–mass spectrometry, neutron activation analysis, atomic absorption spectrometry and emission spectrometry. However, most of them require several time-consuming manipulation steps, sophisticated instruments and special training [13- 14].
Ion-selective sensors are used for the potentiometric determination of iron in chemical, biological, industrial and environmental samples as they provide a simplest method, offers several advantages such as fast and easy preparation procedures, simple instrumentation, relatively fast response time, wide concentration range, reasonable selectivity, low cost and may also be suitable for online analysis [15- 28]. Some of them were prepared with ion exchangers [29], neutral carriers [30-31] and a few of them with ionophores [32- 33].
Among the various iron chelators reported till date, siderophores are the naturally occurring powerful iron(III) chelating agents produced by microorganisms and present unique chemical and physiochemical properties [34]. One of the most studied siderophore for the designing of biomimic synthetic chelators for iron(III) is enterobactin, which produced and excreted by bacteria in iron deficient media in order to bind and assimilate extracellular iron [35,36].
The objective of this work is to demonstrate the ability of A, B, C and D as excellent ionophores in the construction of novel carbon paste electrodes and the use of these modified electrodes as electrochemical sensors for Fe(III) determination. The characteristics and analytical performance of CPEs like influence of different plasticizers, ionophores content, pH range, temperature and effect of the interfering cations have been investigated.
2. EXPERIMENTAL
2.1. Reagents and Chemicals
Analytical grade reagents are used in this study. Distillated water was used throughout all experiments. Ferric chloride [FeCl3.6H2O] was supplied from Koch Light. o-Nitrophenyloctylether
calcium, potassium, manganese, lead, barium, cobalt, sodium, ferrous and aluminum are used as interfering materials.
2.2. Apparatus
Laboratory potential measurements were performed using Jenway 3505 pH-meter. Silver-silver chloride double-junction reference electrode (Metrohm 6.0726.100) in conjugation with different ion selective electrode was used. pH measurements were done using Thermo- Orion, model Orion 3 stars, USA. Prior to analysis, all glassware used were washed carefully with distilled water and dried in the oven before use.
2.3. Preparation of A-D ionophores
5,5'-(propane-1,3-diylbis(sulfanediyl))bis(3-benzyl-4H-1,2,4-triazol 4-amine) (ionophore A) and 5,5'-(butane-1,4-diylbis(sulfanediyl))bis(3-benzyl-4H-1,2,4-triazol-4-amine) (ionophore B) were prepared according to the previous reported methods [37, 38]. While, preparation of 7,8,16,17-tetrahydrodibenzo[e,m] [1,4,8,11]dioxadiazacyclotetradecine (ionophore C) and 3{(1E)-2-[3-2-[3-[(1E)-2-aza-2-(3-carboxyphenyl)vinyl]phenoxy}ethoxy)-phenyl1]-1-azavinyl}benzoic acid (ionophore D) were prepared according to the previously published methods [39].
2.4. Preparation of modified carbon paste electrodes
Modified carbon paste electrodes (I to IV) were prepared by matrices compositions 10 mg [A, B and D] + 250 mg carbon powder + 100 μl o-NPOE and 7.5 mg [C] + 250 mg carbon powder + 100 μl o-NPOE for electrodes I, II, IV and III, respectively. This matrix was thoroughly mixed in the mortar and the resulted paste was used to fill the electrode body [40-48]. The sensors were used directly for potentiometric measurements without preconditioning. A fresh surface of the paste was obtained by squeezing more out. The surplus paste was wiped out and the freshly exposed surface was polished on a paper until the surface showed shiny appearance.
2.5. Preparation of sample solution
2.6. Determination of iron in water samples
About 10 ml water samples (Table 1) were transferred to a 25 ml beaker and adjusted to pH 2.5 then content was estimated via potentiometric calibration using CPEs as sensing electrodes. The method was repeated several times to check the accuracy and reproducibility of the proposed method.
2.7. Determination of iron in Soil samples
Soil samples (Table 1) are dried and then treated with diethylene triamine pentaacetic acid [DTPA] solution, stirred for 2 hours, filtrated with Whatman filter paper No. 42 [49]. Take 10 ml of the prepared soil solution and adjust pH to 2.5, iron is determined by potentiometric calibration as described above.
2.8. Determination of iron in fish tissue samples
Iron is determined in fish tissue samples (Table 1) after their preparation and digestion according to the previously reported method [50]. A 10 ml sample is transferred to 25 ml beaker and adjusted to pH 2.5 using NaOH/HCl. Iron is determined by potentiometric calibration as mentioned before.
3. RESULT AND DISCUSSION
Compounds A, B, C and D are used as effective ionophores for the construction of iron(III) selective carbon paste electrodes I, II, III and IV, respectively. The effect of membrane composition, selectivity, working range, pH of the media and life time of electrodes were investigated. The sensors plasticized with o-NPOE were calibrated against a double junction Ag/AgCl reference electrode, at 25± 1o
C, using the direct calibration technique. The potential response of the electrodes are determined and found to have a linear response over wide concentration range from 1× 10⁻⁶-1× 10⁻² mol L-1 of Fe(III) with a trivalent cationic slope of 20±0.32, 20.3±0.46, 19.2±0.62 and 21±0.25 mV decade-1
and exhibit detection limit of 6.4 × 10⁻⁷, 6.4 × 10⁻⁷, 1 × 10⁻⁶ and 4.8 × 10⁻⁷ mol L-1 for electrodes I, II, III and IV, respectively. The electrodes show stable and reproducible potential over a period of 86, 74, 66 and 95 days for electrodes I, II, III and IV, respectively.
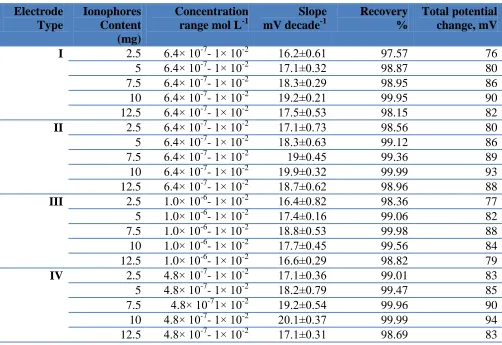
3.1. Effect of ionophore content
[image:5.596.47.554.258.691.2]
material) on the electrode performance was studied. For this purpose, five electrodes were prepared containing different amounts of the ionophores (2.5- 12.5) mg of A, B, C and D ionophores. It was obvious that, the optimum ionophores content were found to be 10, 10, 7.5 and 10 mg for electrodes I, II, III and IV, respectively, as indicated in Table (2). As the ionophore content increases, the slope of calibration curve increases till certain point then decreases for all types of the studied electrodes. This is also supported by the high slope values of the calibration curve in the tested concentration range from 10−7–10−2 mol L-1 which are 20± 0.32, 20.3± 0.46, 19.2± 0.62 and 21± 0.25 mV decade-1 for electrodes I, II, III and IV, respectively.
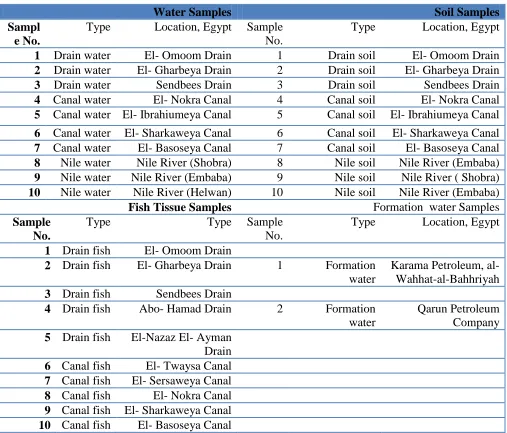
Table 1. Types and location of water, soil, plant, fish tissue and formation water samples.
Water Samples Soil Samples
Sampl e No.
Type Location, Egypt Sample No.
Type Location, Egypt
1 Drain water El- Omoom Drain 1 Drain soil El- Omoom Drain
2 Drain water El- Gharbeya Drain 2 Drain soil El- Gharbeya Drain
3 Drain water Sendbees Drain 3 Drain soil Sendbees Drain
4 Canal water El- Nokra Canal 4 Canal soil El- Nokra Canal
5 Canal water El- Ibrahiumeya Canal 5 Canal soil El- Ibrahiumeya Canal
6 Canal water El- Sharkaweya Canal 6 Canal soil El- Sharkaweya Canal
7 Canal water El- Basoseya Canal 7 Canal soil El- Basoseya Canal
8 Nile water Nile River (Shobra) 8 Nile soil Nile River (Embaba)
9 Nile water Nile River (Embaba) 9 Nile soil Nile River ( Shobra)
10 Nile water Nile River (Helwan) 10 Nile soil Nile River (Embaba)
Fish Tissue Samples Formation water Samples
Sample No.
Type Type Sample
No.
Type Location, Egypt
1 Drain fish El- Omoom Drain
2 Drain fish El- Gharbeya Drain 1 Formation water
Karama Petroleum, al-Wahhat-al-Bahhriyah
3 Drain fish Sendbees Drain
4 Drain fish Abo- Hamad Drain 2 Formation water
Qarun Petroleum Company
5 Drain fish El-Nazaz El- Ayman Drain
6 Canal fish El- Twaysa Canal
7 Canal fish El- Sersaweya Canal
8 Canal fish El- Nokra Canal
9 Canal fish El- Sharkaweya Canal
Table 2. Effect of ionophores content on the performance characteristics of Fe(III) electrodes (I, II, III and IV).
Electrode Type
Ionophores Content (mg)
Concentration range mol L-1
Slope mV decade-1
Recovery %
Total potential change, mV
I 2.5 6.4× 10⁻⁷- 1× 10⁻² 16.2±0.61 97.57 76
5 6.4× 10⁻⁷- 1× 10⁻² 17.1±0.32 98.87 80
7.5 6.4× 10⁻⁷- 1× 10⁻² 18.3±0.29 98.95 86
10 6.4× 10⁻⁷- 1× 10⁻² 19.2±0.21 99.95 90
12.5 6.4× 10⁻⁷- 1× 10⁻² 17.5±0.53 98.15 82
II 2.5 6.4× 10⁻⁷- 1× 10⁻² 17.1±0.73 98.56 80
5 6.4× 10⁻⁷- 1× 10⁻² 18.3±0.63 99.12 86
7.5 6.4× 10⁻⁷- 1× 10⁻² 19±0.45 99.36 89
10 6.4× 10⁻⁷- 1× 10⁻² 19.9±0.32 99.99 93
12.5 6.4× 10⁻⁷- 1× 10⁻² 18.7±0.62 98.96 88
III 2.5 1.0× 10⁻⁶- 1× 10⁻² 16.4±0.82 98.36 77
5 1.0× 10⁻⁶- 1× 10⁻² 17.4±0.16 99.06 82
7.5 1.0× 10⁻⁶- 1× 10⁻² 18.8±0.53 99.98 88
10 1.0× 10⁻⁶- 1× 10⁻² 17.7±0.45 99.56 84
12.5 1.0× 10⁻⁶- 1× 10⁻² 16.6±0.29 98.82 79
IV 2.5 4.8× 10⁻⁷- 1× 10⁻² 17.1±0.36 99.01 83
5 4.8× 10⁻⁷- 1× 10⁻² 18.2±0.79 99.47 85
7.5 4.8× 10-71× 10-2 19.2±0.54 99.96 90
10 4.8× 10⁻⁷- 1× 10⁻² 20.1±0.37 99.99 94
12.5 4.8× 10⁻⁷- 1× 10⁻² 17.1±0.31 98.69 83
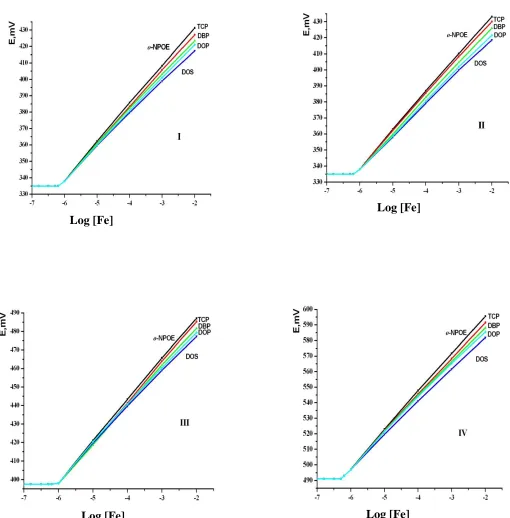
3.2. Effect of plasticizer type
Plasticizer is an important constituent of the electrode and influences the detection limit, sensitivity, selectivity of the electrodes and mobility of the electroactive cation in the membrane. The improvement in the performance was attempted by the addition of plasticizers to the membranes. The addition of plasticizers not only improves the workability of the membranes, but also contributes significantly towards the improvement in the working concentration range, stability and shelf life of the sensor. The plasticizer to be used in membranes should exhibit high lipophilicity, high molecular weight, low tendency for exudation from the polymer matrix, low vapor pressure, adequate viscosity and dielectric constant and high capacity to dissolve the substrate and other additives present in the membrane. In the present study, the effect of five plasticizers of different polarities such as o-NPOE, TCP, DBP, DOP and DOS were studied.
20.1±0.37, 19.5±0.52, 19±0.68 and 18.1±0.43 mV decade-1
for electrodes I, II, III and IV plasticized with o-NPOE, TCP, DBP, DOP and DOS, respectively, as indicated in Figure (1).
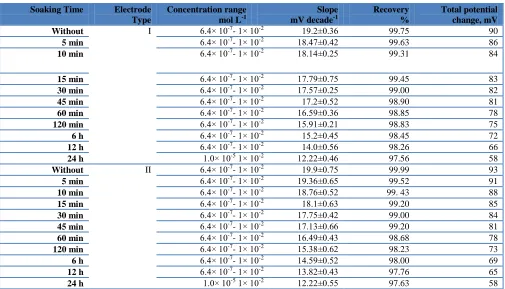
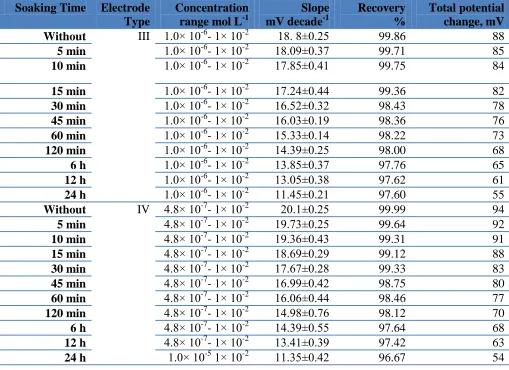
3.3. Effect of soaking time
The performance characteristics of the iron-selective membrane electrodes were studied as a function of soaking time in which freshly prepared electrodes must be soaked to activate the surface of the carbon paste layer to form an infinitesimally thin gel layer at which ion exchange occurs. For this purpose CPEs were soaked in 10-4 mol L-l Fe(III) solution and the calibration curves were plotted from which the total potential changes are recorded after 0, 15, 30, 45, 60, 120 min. and 6, 12, 24 h. The optimum soaking time was found to be 0 min, where the highest total potential change and slope of the calibration curves are obtained at 25 °C. They decreased with increasing soaking time as indicated in Tables (3 and 4). Soaking is not recommended because it can be assumed that the concentration of the plasticizer and the ionophore in the membrane is likely reduced during this contact period with the CPE. This reduction of the concentration is likely due to the leaching of the ion pairs on the electrode surface.
[image:7.596.47.552.446.735.2]3.4. Effect of PH
Table 3. Effect of soaking time on the performance characteristics of Fe(III) electrodes (I and II).
Soaking Time Electrode
Type
Concentration range mol L-1
Slope mV decade-1
Recovery %
Total potential change, mV
Without I 6.4× 10⁻⁷- 1× 10⁻² 19.2±0.36 99.75 90
5 min 6.4× 10⁻⁷- 1× 10⁻² 18.47±0.42 99.63 86
10 min 6.4× 10⁻⁷- 1× 10⁻² 18.14±0.25 99.31 84
15 min 6.4× 10⁻⁷- 1× 10⁻² 17.79±0.75 99.45 83
30 min 6.4× 10⁻⁷- 1× 10⁻² 17.57±0.25 99.00 82
45 min 6.4× 10⁻⁷- 1× 10⁻² 17.2±0.52 98.90 81
60 min 6.4× 10⁻⁷- 1× 10⁻² 16.59±0.36 98.85 78
120 min 6.4× 10⁻⁷- 1× 10⁻² 15.91±0.21 98.83 75
6 h 6.4× 10⁻⁷- 1× 10⁻² 15.2±0.45 98.45 72
12 h 6.4× 10⁻⁷- 1× 10⁻² 14.0±0.56 98.26 66
24 h 1.0× 10⁻⁵ 1× 10⁻² 12.22±0.46 97.56 58
Without II 6.4× 10⁻⁷- 1× 10⁻² 19.9±0.75 99.99 93
5 min 6.4× 10⁻⁷- 1× 10⁻² 19.36±0.65 99.52 91
10 min 6.4× 10⁻⁷- 1× 10⁻² 18.76±0.52 99. 43 88
15 min 6.4× 10⁻⁷- 1× 10⁻² 18.1±0.63 99.20 85
30 min 6.4× 10⁻⁷- 1× 10⁻² 17.75±0.42 99.00 84
45 min 6.4× 10⁻⁷- 1× 10⁻² 17.13±0.66 99.20 81
60 min 6.4× 10⁻⁷- 1× 10⁻² 16.49±0.43 98.68 78
120 min 6.4× 10⁻⁷- 1× 10⁻² 15.38±0.62 98.23 73
6 h 6.4× 10⁻⁷- 1× 10⁻² 14.59±0.52 98.00 69
12 h 6.4× 10⁻⁷- 1× 10⁻² 13.82±0.43 97.76 65
Figure 1. Effect of plasticizer types on the performance of Fe(III) electrodes (I, II, III and IV).
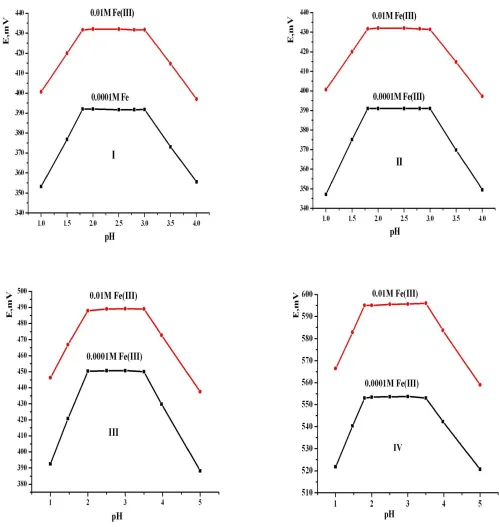
The effect of pH of the test solutions on the electrode potentials was studied. The variation in potential with pH change was followed by the addition of small volumes of HCl and/or NaOH to the test solutions 1× 10⁻⁴
and 1× 10⁻² mol L-1 For each pH value, the potential was recorded and thus the potential-pH curves for two Fe(III) concentrations were constructed. It was obvious that at pH range from 1.8- 3, 1.8- 3, 2- 3.5 and 1.8- 3.5 for electrodes I, II, III and IV, respectively. Potential are
Log [Fe]
Log [Fe]
[image:9.596.44.553.186.556.2]
practically independent on pH as shown in Figure (2). At lower or higher pHs, a drift is observed which may attribute to the formation of hydroxide form of iron.
Table 4. Effect of soaking time on the performance characteristics of Fe(III) electrodes (III and IV).
Soaking Time Electrode Type
Concentration range mol L-1
Slope mV decade-1
Recovery %
Total potential change, mV
Without III 1.0× 10⁻⁶- 1× 10⁻² 18. 8±0.25 99.86 88
5 min 1.0× 10⁻⁶- 1× 10⁻² 18.09±0.37 99.71 85
10 min 1.0× 10⁻⁶- 1× 10⁻² 17.85±0.41 99.75 84
15 min 1.0× 10⁻⁶- 1× 10⁻² 17.24±0.44 99.36 82
30 min 1.0× 10⁻⁶- 1× 10⁻² 16.52±0.32 98.43 78
45 min 1.0× 10⁻⁶- 1× 10⁻² 16.03±0.19 98.36 76
60 min 1.0× 10⁻⁶- 1× 10⁻² 15.33±0.14 98.22 73
120 min 1.0× 10⁻⁶- 1× 10⁻² 14.39±0.25 98.00 68
6 h 1.0× 10⁻⁶- 1× 10⁻² 13.85±0.37 97.76 65
12 h 1.0× 10⁻⁶- 1× 10⁻² 13.05±0.38 97.62 61
24 h 1.0× 10⁻⁶- 1× 10⁻² 11.45±0.21 97.60 55
Without IV 4.8× 10⁻⁷- 1× 10⁻² 20.1±0.25 99.99 94
5 min 4.8× 10⁻⁷- 1× 10⁻² 19.73±0.25 99.64 92
10 min 4.8× 10⁻⁷- 1× 10⁻² 19.36±0.43 99.31 91
15 min 4.8× 10⁻⁷- 1× 10⁻² 18.69±0.29 99.12 88
30 min 4.8× 10⁻⁷- 1× 10⁻² 17.67±0.28 99.33 83
45 min 4.8× 10⁻⁷- 1× 10⁻² 16.99±0.42 98.75 80
60 min 4.8× 10⁻⁷- 1× 10⁻² 16.06±0.44 98.46 77
120 min 4.8× 10⁻⁷- 1× 10⁻² 14.98±0.76 98.12 70
6 h 4.8× 10⁻⁷- 1× 10⁻² 14.39±0.55 97.64 68
12 h 4.8× 10⁻⁷- 1× 10⁻² 13.41±0.39 97.42 63
24 h 1.0× 10⁻⁵ 1× 10⁻² 11.35±0.42 96.67 54
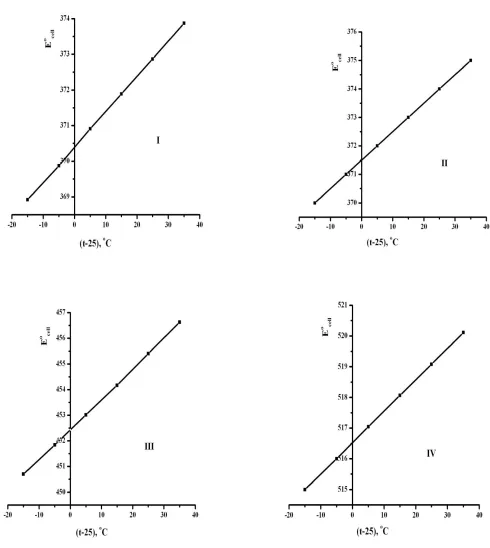
3.5. Effect of temperature
To investigate the thermal stability of the electrode, The isothermal temperature coefficient of the electrode (dEo/dt) and the standard electrode potentials (Eo) were determined from the calibration graphs as the intercepts at p(Fe) = 0, of electrodes at different temperatures range from 10 to 60 ºC and plotted versus (t-25), where (t) is the temperature of the experiment in degree centigrade with the aid of the following equation [51],
The electrodes exhibits good Nernstian behaviour in the temperature range and a straight line is obtained where its slope represents the isothermal coefficient of the electrode. The isothermal temperature coefficient (dEo /dt) values were found to be 0.097, 0.1002, 0.1181 and 0.1025 mV °C for electrodes I, II, III and IV, respectively as illustrated in Figure (3).
The low isothermal coefficient value of Fe(III) CPEs the electrodes in the tested temperature range revealed a reasonable thermodynamic ionic exchange process at the membrane/Fe(III) solution interface with good mechanical stability up to 60 oC. The investigated electrodes were found to be usable up to 60 °C without noticeable deviation from the Nernstian behaviour.
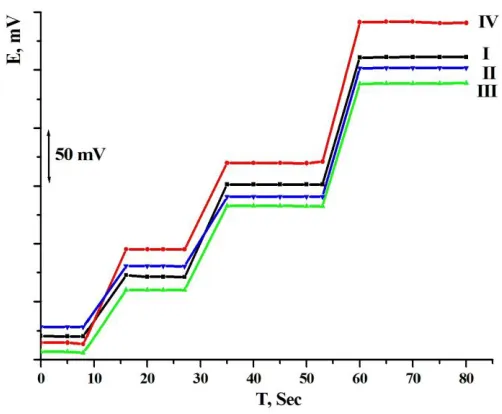
3.6. Response Time
It is clear that the experimental conditions, like the stirring, the ionic concentration and composition of the test solution, the concentration and composition of the solution to which the electrodes were exposed before performing the experiment measurement, any previous usages or preconditioning of the electrodes, and the testing temperature, are effective on the experimental response time of a sensor.
The average time required for the Fe(III) electrodes to reach a potential within ±1 mV of the final equilibrium value after successive immersion of a series of Fe(III) solutions, each having a 10-fold difference in concentrations, were measured. The average static response times 13, 15, 20 and 9 s for electrodes I, II, III and IV sensors, respectively, were obtained when contacting different Fe(III) solutions from 1.0×10⁻⁶
to 1.0×10⁻² mol L-1, (Figure 4).
3.7. Selectivity and interference
The selectivity behaviour is one of the most important characteristics of ion-selective sensors, determining whether a reliable measurement in the target sample is possible. To investigate the selectivity of the four sensors of iron, their potential responses were assessed in the presence of some inorganic cations using mixed solution method (MPM). Fixed concentration of 1 ×10⁻³ mol L-1 of both iron and the interfering solutions incorporated as their chloride salts were mixed at pH 2.5. The potentials of these solutions were measured and the selectivity coefficients values KPot Fe(III),B are
Figure 4. Dynamicresponse time of different Fe(III) sensors
Table 5. Potentiometric selectivity coefficients of some interfering ions using Fe(III) electrodes(I, II, III and IV).
Interfering ions
(B)
log K
Fe(III), B pot
I II III IV
K+ 4.25x10⁻⁵ 1.51 × 10⁻⁴ 4.08x10⁻⁵ 2.58x10⁻⁴ NH4
+
3.65x10⁻⁵ 1.71 × 10⁻⁴ 3.52x10⁻⁵ 3.66x10⁻⁷ Na+ 2.22x10⁻⁴ 3.24 × 10⁻⁵ 2.15x10⁻⁴ 5.29x10⁻⁶ Mg2+ 1.72x10⁻⁵ 2.55 × 10⁻⁵ 1.63x10⁻⁵ 1.54x10⁻⁴
Mn2+ 5.01x10⁻⁶ 8.54 × 10⁻⁶ 4.98x10⁻⁶ 2.22x10⁻⁵ Pb2+ 7.12x10⁻³ 3.03 × 10⁻⁵ 7.08x10⁻³ 3.69x10⁻⁵ Ba2+ 3.63x10⁻⁶ 4.59 × 10⁻⁶ 3.52x10⁻⁶ 3.87x10⁻⁶ Co2+ 1.95x10⁻⁴ 2.39 × 10⁻⁴ 2.15x10⁻⁴ 7.52x10⁻³
Ni2+ 2.85x10⁻⁵ 1.48 × 10⁻³ 2.55x10⁻⁵ 6.38x10⁻⁴ Ca2+ 7.12x10⁻³ 3.21 × 10⁻³ 7.38x10⁻³ 4.51x10⁻⁶
Sr2+ 4.15x10⁻⁴ 2.33 × 10⁻⁶ 4.25x10⁻⁴ 6.08x10⁻⁵ Zn2+ 3.69x10⁻⁶ 2.17 × 10⁻³ 3.82x10⁻⁶ 4.28x10⁻⁴
Cd2+ 1.85x10⁻⁴ 8.52 × 10⁻⁵ 2.04x10⁻⁴ 1.73x10⁻³
Al3+ 3.46x10⁻³ 8.58 × 10⁻⁵ 3.57x10⁻³ 2.76x10⁻⁵
Cu2+ 3.89x10⁻⁶ 7.3x10⁻⁴ 4x10⁻⁶ 6.72x10⁻⁴
[image:13.596.77.522.382.753.2]
3.8. Analytical applications
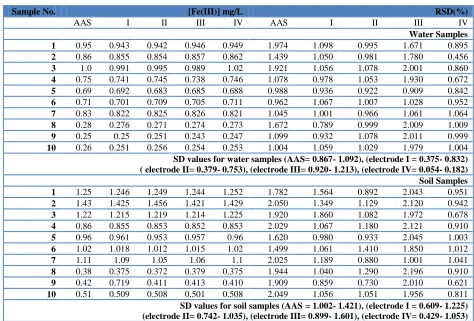
The proposed CPEs sensors were found to work well under laboratory conditions. In order to test the analytical validity of this approach, the membrane electrodes with o-NPOE have been applied as indicator electrodes for the determination of iron in different samples (water, soil, fish tissue and formation water samples) by direct potentiometry using the calibration graph and atomic absorption spectrometer (AAS) methods. The result obtained by potentiometric calibration are presented in Tables (6 and 7), and were compared with those obtained by Atomic Absorption Spectrometer (AAS) which showed good agreement with them.
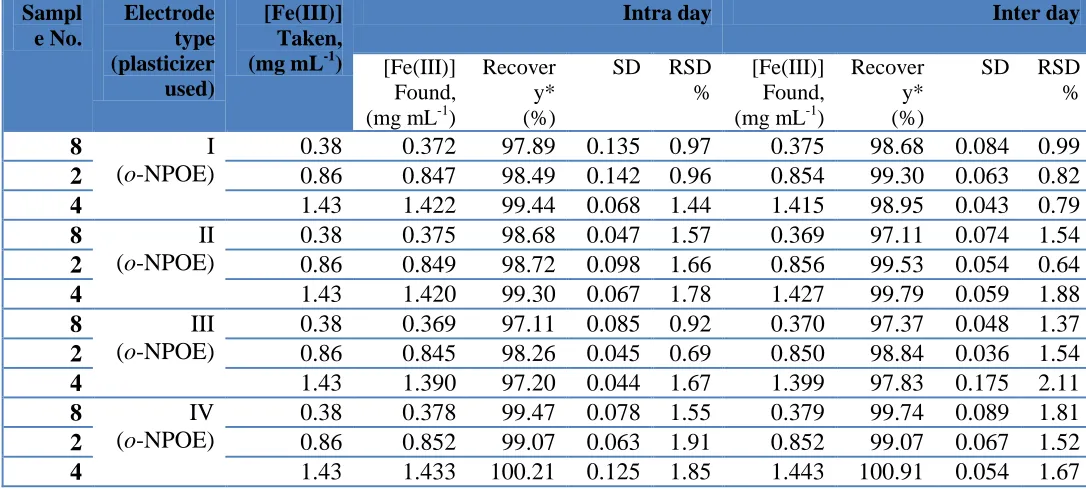
3.9. Precision and accuracy
For precision and accuracy study, the calibration curves were constructed. The repeatability and reproducibility of the CPEs method were studied by performing successive calibrations with the same modified electrodes on the same day (intra-day) (n = 5) and on different days (inter-day) (n = 5). The data reveal that the average slope with standard deviation ranges from (0.015- 0.325), (0.047- 0.456), (0.044- 0.142) and (0.036- 0.175) and relative standard deviation value ranges from (0.56- 1.87), (0.68- 1.64), (0.69- 1.91) and (0.64- 2.11) for intra- and inter-days measurements in water and soil samples using electrodes I, II, III and IV, respectively, (Tables (8 and 9). The low values of the relative standard deviation (RSD) and standard deviation (SD) also indicate repeatability, reproducibility and precision of the modified carbon paste electrodes in the determination of iron.
4. CONCLUSION
The proposed iron selective membrane electrodes based on (A, B, C and D) ionophores display a Nernstian response in a wide concentration range from 1× 10⁻⁶
- 1× 10⁻² mol L-1 with a detection limit of 6.4 × 10⁻⁷, 6.4 × 10⁻⁷, 1 × 10⁻⁶ and 4.8 × 10⁻⁷ mol L-1 and a slope of 20±0.32, 20.3±0.46, 19.2±0.62 and 21±0.25 mV decade-1
Table 6. Potentiometric determination of Fe(III) in water and soil samples using electrodes (I, II, III and IV).
Sample No. [Fe(III)] mg/L RSD(%)
AAS I II III IV AAS I II III IV
Water Samples 1 0.95 0.943 0.942 0.946 0.949 1.974 1.098 0.995 1.671 0.895
2 0.86 0.855 0.854 0.857 0.862 1.439 1.050 0.981 1.780 0.456
3 1.0 0.991 0.995 0.989 1.02 1.921 1.056 1.078 2.001 0.860
4 0.75 0.741 0.745 0.738 0.746 1.078 0.978 1.053 1.930 0.672
5 0.69 0.692 0.683 0.685 0.688 0.988 0.936 0.922 0.909 0.842
6 0.71 0.701 0.709 0.705 0.711 0.962 1.067 1.007 1.028 0.952
7 0.83 0.822 0.825 0.826 0.821 1.045 1.001 0.966 1.061 1.064
8 0.28 0.276 0.271 0.274 0.273 1.672 0.789 0.999 2.009 1.009
9 0.25 0.25 0.251 0.243 0.247 1.099 0.932 1.078 2.011 0.999
10 0.26 0.251 0.256 0.254 0.253 1.004 1.059 1.029 1.979 1.004
SD values for water samples (AAS= 0.867- 1.092), (electrode I = 0.375- 0.832) ( electrode II= 0.379- 0.753), (electrode III= 0.920- 1.213), (electrode IV= 0.054- 0.182) Soil Samples 1 1.25 1.246 1.249 1.244 1.252 1.782 1.564 0.892 2.043 0.951
2 1.43 1.425 1.456 1.421 1.429 2.050 1.349 1.129 2.120 0.942
3 1.22 1.215 1.219 1.214 1.225 1.920 1.860 1.082 1.972 0.678
4 0.86 0.855 0.853 0.852 0.853 2.029 1.067 1.180 2.121 0.910
5 0.96 0.961 0.953 0.957 0.96 1.620 0.980 0.933 2.045 1.003
6 1.02 1.018 1.012 1.015 1.02 1.499 1.061 1.410 1.850 1.012
7 1.11 1.09 1.05 1.06 1.1 2.025 1.189 0.880 1.001 1.041
8 0.38 0.375 0.372 0.379 0.375 1.944 1.040 1.290 2.196 0.910
9 0.42 0.719 0.411 0.413 0.410 1.909 0.859 0.730 2.010 0.621
10 0.51 0.509 0.508 0.501 0.508 2.049 1.056 1.051 1.956 0.811
SD values for soil samples (AAS = 1.002- 1.421), (electrode I = 0.609- 1.225) (electrode II= 0.742- 1.035), (electrode III= 0.899- 1.601), (electrode IV= 0.429- 1.053)
Table 7. Potentiometric determination of Fe(III) in fish tissue and formation water samples using electrodes (I, II, III and IV).
Sample No.
[Fe(III)] mg/L RSD(%)
AAS I II III IV AAS I II III IV
Fish Tissue Samples
1 0.99 0.982 0.988 0.984 0.992 1.022 1.217 0.762 1.220 0.452
2 0.98 0.981 0.976 0.972 0.976 0.956 1.178 0.878 1.055 0.335
3 0.88 0.876 0.875 0.877 0.879 0.911 1.255 1.005 1.038 0.602
4 1.05 1.04 1.042 1.049 1.041 1.220 1.055 1.026 0.995 0.099
5 1.10 1.09 1.05 1.08 1.01 0.889 2.020 1.045 1.388 0.325
6 0.63 0.625 0.626 0.628 0.631 0.763 1.563 0.822 1.115 0.794
7 0.68 0.677 0.679 0.675 0.671 0.844 0.955 0.933 2.001 0.433
8 0.63 0.625 0.625 0.628 0.624 0.782 1.355 1.070 1.945 0.722
9 0.71 0.706 0.708 0.706 0.705 0.864 1.034 1.067 1.555 0.255
10 0.35 0.343 0.345 0.349 0.347 0.921 1.199 0.955 2.011 0.212
SD values for fish tissue samples (AAS = 0.099- 0.632), (electrode I = 0.175-0,925), (electrode II = 0.222- 1.031), (electrode III = 0.002- 0.420), (electrode IV= 0.782- 1.220) Formation Water Samples
1 1.47 1.498 1.462 1.384 1.499 2.005 1.172 1.422 2.046 1.075
2 2.98 2.879 2.890 2.801 2.997 1.539 1.074 1.185 1.951 1.026
[image:15.596.60.534.107.428.2][image:16.596.25.568.429.674.2]
Table 8. Evaluation of intra- and inter-days precision and accuracy of electrodes (I, II, III and IV) in water samples. Sample No. Electrode type (plasticizer used) [Fe(III)] Taken, (mg mL
-1
)
Intra day Inter day
[Fe(III)] Found, (mg mL-1)
Recover y* (%)
SD RSD %
[Fe(III)] Found, (mg mL-1)
Recover y* (%)
SD RSD %
9 I
(o-NPOE)
0.25 0.245 98.00 0.015 0.89 0.249 99.60 0.067 0.97
5 0.69 0.693 100.43 0.046 0.67 0.665 96.38 0.315 1.54
3 1.00 0.995 99.50 0.051 1.51 0.985 98.50 0.132 1.36
9 II
(o-NPOE)
0.25 0.243 97.20 0.054 1.33 0.245 98.00 0.094 1.24
5 0.69 0.685 99.28 0.221 1.87 0.663 96.09 0.087 0.97
3 1.00 0.989 98.90 0.273 0.96 0.986 98.60 0.063 0.87
9 III
(o-NPOE)
0.25 0.240 96.00 0.043 0.78 0.243 97.20 0.047 0.68
5 0.69 0.679 98.41 0.048 1.05 0.669 96.96 0.094 0.79
3 1.00 0.981 98.10 0.165 1.61 0.985 98.50 0.065 1.06
9 IV
(o-NPOE)
0.25 0.253 101.20 0.058 0.56 0.251 100.40 0.456 1.33
5 0.69 0.696 100.87 0.097 0.69 0.669 96.96 0.076 1.54
3 1.00 1.020 102.00 0.325 1.23 1.000 100.00 0.066 1.64
Table 9. Evaluation of intra- and inter-days precision and accuracy of electrodes (I, II, III and IV) in soil samples. Sampl e No. Electrode type (plasticizer used) [Fe(III)] Taken, (mg mL-1)
Intra day Inter day
[Fe(III)] Found, (mg mL-1)
Recover y* (%)
SD RSD %
[Fe(III)] Found, (mg mL-1)
Recover y* (%)
SD RSD %
8 I
(o-NPOE)
0.38 0.372 97.89 0.135 0.97 0.375 98.68 0.084 0.99
2 0.86 0.847 98.49 0.142 0.96 0.854 99.30 0.063 0.82
4 1.43 1.422 99.44 0.068 1.44 1.415 98.95 0.043 0.79
8 II
(o-NPOE)
0.38 0.375 98.68 0.047 1.57 0.369 97.11 0.074 1.54
2 0.86 0.849 98.72 0.098 1.66 0.856 99.53 0.054 0.64
4 1.43 1.420 99.30 0.067 1.78 1.427 99.79 0.059 1.88
8 III
(o-NPOE)
0.38 0.369 97.11 0.085 0.92 0.370 97.37 0.048 1.37
2 0.86 0.845 98.26 0.045 0.69 0.850 98.84 0.036 1.54
4 1.43 1.390 97.20 0.044 1.67 1.399 97.83 0.175 2.11
8 IV
(o-NPOE)
0.38 0.378 99.47 0.078 1.55 0.379 99.74 0.089 1.81
2 0.86 0.852 99.07 0.063 1.91 0.852 99.07 0.067 1.52
4 1.43 1.433 100.21 0.125 1.85 1.443 100.91 0.054 1.67
References
1. S. Jagadevan, M. Jayamurthy, P. Dobson, I.P. Thompson, Water Research, 46 (2012) 2395. 2. W.W.J.M. de Vet, I.J.T. Dinkla, L.C. Rietveld, M.C.M. van Loosdrecht, Water Research, 45
3. V. Antharama, J.F. Collingwood, J. Bullivant, M.R. Davidson, S. Chandra, A. Mikhaylova, M.E. Finnegan, C. Batichc, J.R. Forderg, J. Dobson, NeuroImage, 59 (2012) 1249.
4. B. Novotna, P. Jendelova, M. Kapcalova, P. Rossner, K. Turnovcova, Y. Bagryantseva, M. Babic, D. Horak, E. Sykova, Toxicol. Lett., 210 ( 2012) 53.
5. K. Gkouvatsos, G. Papanikolaou, K. Pantopoulos, BBA- GEN. Subjects, 1820 (2012) 188. 6. C. Huanga, M. Hub, Food and Chem. Toxicol., 49 (2011) 1381.
7. P. Arosio, S. Levi, BBA- GEN. Subjects, 1800 (2010) 783.
8. M. Haase, R. Bellomo, A. Haase-Fielitz, J. Am. Coll. of Cardiology, 55 ( 2010) 2024.
9. A. Corti, T.L. Duarte, C. Giommarelli, V. De Tata, A. Paolicchi, G.D.D. Jones, A. Pompella, Mutat. Res., 669 (2009) 112.
10.T. Meroño., P. Sorroche, L.A.G. Rosso, L. Casañas, L.E. Boero, J.A. Arbelbide, F.D. Brites, Clin. Biochem., 43 (2010) 416–423.
11.D.O. Okonko, A. K.J. Mandal, C.G. Missouris, P.A. Poole-Wilson, Disordered Iron Homeostasis in Chronic Heart Failure : Prevalence, Predictors, and Relation to Anemia, Exercise Capacity, and Survival J. Am. Coll. of Cardiology, Volume 58 (2011) 1241.
12.T.W. Lee, M.R. Kolber, R.N. Fedorak, S.V.V. Zanten, J. Crohn's and Colitis, 6 (2012) 267. 13.Ç.A. Şahin, İ. Tokgöz, S. Bektaş, J. Hazard. Mater., 181 (2010) 359.
14.F.A. Aydin, M. Soylak, J. Hazard. Mater., 173 (2010) 669.
15.H.A. Zamani, M.R. Ganjali, F. Faridbod, M. Salavati-Niasari, Mater. Sci. Eng. C, 32 (2012) 564. 16.F. Xie, G. Liu, F. Wu, G. Guo, G. Li, Chem. Eng. J., 2012, 183, 372–380.
17.M. Masrournia, H.A. Zamani, H.A. Mirrashid, M.R. Ganjali, F. Faridbod, Mater. Sci. Eng. C, 31 (2011) 574.
18.V.K. Gupta, B. Sethi, N. Upadhyay, S. Kumar, R. Singh, L.P. Singh, Int. J. Electrochem. Sci., 6 (2011) 650.
19.B.K. Bera, S.K. Sahoo, M. Baral,B. K. Kanungo, Bull. Korean Chem. Soc., 32 (2011) 3592. 20.M.G. Motlagh, M.A. Taher, A. Ahmadi, Electrochimica Acta, 55 (2010) 6724.
21.K. Huanga, Y. Suna, D. Niua, W. Xiea, W. Wangb, Colloid Surface B, 78 (2010) 69. 22.A. Babakhanian, M.B. Gholivand, M. Mohammadi, M. Khodadadian, A. Shockravi, M.
Abbaszadeh, A. Ghanbary, J. Hazard. Mater., 177 (2010) 159.
23.M.A. Karimi, M.M. Ardakani, R.B. Ardakani, M.H. Mashhadizadeh, M.R. Monfared, M. Tadayon, J. AOAC Int., 93 (2010) 327.
24.M.M. Zareh, I.S.F.A. Ismail, M.H. Abd El-Aziz, Electroanal., 2010, 22, 1369.
25.H.A. Zamani, M.R. Ganjali, H. Behmadi, M.H. Behnajady, Mater. Sci. Eng. C, 29 (2009) 1535. 26.M. Pooyamanesh, H.A. Zamani, G. Rajabzadeh, M.R. Ganjali, P. Norouzi, Anal. Lett., 40 (2007)
1596.
27.A. Sil, V.S. Ijeri, A.K. Srivastava, Sens. Actuators B, 106 (2005) 648.
28.V.K. Gupta, A.K. Jain, S. Agarwal, G. Maheshwari, Talanta, 71 (2007) 1964. 29.M. Naushad, Bull. Mater. Sci., 31 (2008) 957.
30.H.A. Zamani, M.R. Abedi, M.R. Ganjali, J. Chil. Chem. Soc., 54 (2009) 186. 31.G. Ekmekci, D. Uzunb, G. Somer, S. Kalaycıb, J. Membrane Sci., 288 (2007) 36.
32.R. Maleki, R. Hosseinzadeh, H. Mehrabi, A. Hosseinzadeh, K. Fadrhadi, Turk J Chem., 33 (2009) 1.
33.M.H. Zamani, M.T. Hamed-Mosavian, E. Hamidfar, M.R. Ganjali, P. Norouzi, Mater. Sci. Eng. C, 28 (2008) 1551.
34.S.S. M. Hassan, S.A.M. Marzouk, Talanta, 41 (1994) 891. 35.Z. Chem, X. Yang, X. Lu, Electroanal., 10 (1998) 567. 36.M.B. Saleh, Analyst, 125 (2000) 179.
39.A.B. Kamel, Title of [Ph.D] Thesis, Chemistry Department, Faculty of Science, Ain Shams University, 2011.
40.Gehad G. Mohamed, Tamer Awad Ali, M.F. El-Shahat, A.M. Al-Sabagh, M.A. Migahed, E. Khaled, Anal. Chim. Acta 673 (2010) 79.
41.E.Y.Z. Frag, Tamer Awad Ali, Gehad G. Mohamed, Y.H.H. Awad, Int. J. Electrochem. Sci., 7 (2012) 4443.
42.E.Y.Z. Frag, Gehad G. Mohamed, W.G. El-Sayed, Bioelectrochem., 82 (2011) 79.
43.E.Y.Z. Frag, G.G. Mohamed, F.A. Nour El-Dien, M.E. Mohamed, Analyst, 136 (2011) 332. 44.Gehad G. Mohamed, M.F. El-Shahat, A.M. Al-Sabagh, M.A. Migahed, Tamer Awad Ali, Analyst,
136 (2011) 1488.
45.Gehad G. Mohamed, Tamer Awad Ali, M.F. El-Shahat, A.M. Al-Sabagh, M.A. Migahed, Electroanal., 22 (2010) 2587.
46.E. Khaled, G.G. Mohamed, T. Awad, Sens. Actuators, B, 135 (2008) 74.
47.Gehad G. Mohamed, Tamer Awad Ali, M.F. El-Shahat, M.A. Migahed, A.M. Al-Sabagh, Drug test. Anal., (2012) in press.
48.W. Lindasy, W.A. Norvell, Soil Sci. Soc. Am. J., 42 (1978) 421.
49.M.W. Finerty, J.D. Madden, S.H. Feagly, R.M. Grodner, Arch. Environ. Contam. Toxicol., 19 (1990) 94.
50.H.H. Bauer, G.D. Christian, J.E. O’Reilly, Ed., Allyn and Bacon Inc., Boston, Mass, USA, Instrumental Analysis, (1978) 750.