Quantitative Risk Assessment of Medium-Sized
Floating Regasification Units Using System
Hierarchical Modelling
Byongug Jeong a,*, Byung Suk Lee a, Peilin Zhou a, Seung-man Hab
a Department of Naval Architecture, Ocean and Marine Engineering, University of Strathclyde, 100 Montrose Street, Glasgow, G4 0LZ, UK
bKorean Resister of Shipping, 36 Myeongji Ocean City 9-ro, Gangseo-gu, Busan, Republic of Korea
ABSTRACT
Currently there are no sufficiently detailed and specific regulations and guidelines
applicable to Floating Regasification Units. In view of the fact that these units are likely to
become more popular in the near future, their safety needs to be examined urgently.
During the design of the world’s first medium-sized floating regasification unit a qualitative
risk assessment was carried out. Although the results are useful, they cannot be used for
developing rules and regulations directly. For such purposes some detailed quantitative
studies are essential. This paper addresses this gap and introduces a hierarchical system
modelling method to overcome the problem of the lack of direct statistical accident data of
novel systems.
The method was implemented in IQRA (integrated quantitative risk assessment), a piece
of software developed in-house for quantitative risk assessment. The safety of the floating
regasification unit mentioned above was assessed using this software and the results were
compared against the results obtained from conventional qualitative and the quantitative
risk assessment.
It was found that the qualitative risk assessment had a tendency to overestimate the
frequency of the accidents but to underestimate their consequence, while the quantitative
risk assessment based on the result of the qualitative assessment inherently underestimated
both the frequency and the consequence of hazards. The hierarchical modelling was found
to be an excellent method of dealing with complex systems with short operational history.
List of symbols
AC Area concerned (m2)
AL Cross-sectional area of leak (m2)
CL Discharge coefficient used for liquid (= 0.61)
CG Discharge coefficient (=0.85)
gc Gas constant (1kg m/N·sec2)
MW Molecular Weight (kg/kmol)
NFEX Number of fatalities by explosion (persons)
NFFF Number of fatalities by flash fire (persons)
NFPF Number of fatalities by pool fire (persons)
NFJF Number of fatalities by jet fire (persons)
PA Atmospheric pressure (Pa)
PBW Overpressure of blast wave (Pa)
Ps Absolute pressure inside pipe (Pa)
PBPF Probit corresponding to probability of fatalities
POD Population distribution (persons)
PRF Probability of fatalities
PRF_PF Probability of fatalities by pool fire
PRF_EX Probability of fatalities by explosion
QLR Leak rate for liquid (kg/s)
QV Leak rate for vapour (kg/s)
qTR Thermal radiation (W/m2)
R Gas constant, 8,314 (J/mol·K)
rC Radius of concerned area (m)
t Exposed time (= 60 seconds)
Ts Storage temperature (K)
ρLNG LNG density (kg/m3)
1.
Introduction
With the continuous increase of the world LNG trade reaching 241.1 MT (million tonnes)
in 2014, LNG terminals are struggling with the problem of providing stable natural gas
supply for power plants and industrial systems. As a consequence, demand for LNG
regasification facilities has grown rapidly: the global regasification capacity at terminals
was recorded at 724 MTPA (million tonnes per annum) in 2014, which was about 500
MTPA higher than the level in 2000 (IGU, 2015).
To meet the ever rising demand, floating regasification units (FRUs) started to be deployed
at offshore sites in 2005 and, as of 2014, a total of 16 FRUs are operating with a total
capacity of 54 MTPA across 11 countries (IGU, 2015; Victoria, 2016). FRUs are
particularly useful for smaller markets where more flexible and cost-effective ways to
satisfy the demand are necessary.
However, LNG is regarded as a dangerous fluid possibly leading to several types of critical
accidents, particularly fire and explosion. As a result, a joint project team consisting of
Korean Register of Shipping and other stakeholders has investigated the risk of new
compact LNG regasification systems to be fitted on a medium-sized FRU by means of a
hazard and operability (HAZOP) study during the design of the FRU (Lee, 2016). The
study found that the risk level of fire/explosion initiated by leaks from the process
equipment is unacceptably high, and safety recommendations were made for installing
appropriate number of gas detectors working together with automatic leakage isolation
mechanisms near three major systems: the LNG tank, the boil off gas (BOG) processing
units and LNG regasification units (Korean Register, 2015).
Although all the participants of the study agreed on the results obtained, it was recognised
that HAZOP studies do have inherent limitations. Firstly, it will be difficult to quantify the
risk with high credibility, and, secondly, it relies on experts’ opinion too much, possibly
be carried out to determine the appropriate number of gas detection systems required for
each system.
This paper addresses the shortcomings of HAZOP studies and conventional selective
quantitative risk assessment by investigating the safety of the FRU using an enhanced
framework for quantitative risk assessment using an in-house software based on
2.
Approaches Adopted
2.1. Background
In general, risk assessment can be carried out qualitatively and/or quantitatively (Rausand
and Høyland, 2004). HAZOP is a typical qualitative approach and the framework used for
a HAZOP study on the regasification unit (Korean Register, 2015) is illustrated in Fig. 1.
The main aim of the study was to identify potential hazards associated with the LNG
regasification unit fitted on an FRU, and to provide recommendations for enhancing the
safety of the FRU in question if and where deemed necessary. It used a combination of
HAZOP parameters (flow temperature, pressure and level) and guide words (‘no’, ‘less’,
‘more’ and ‘reverse’) to identify assorted hazards. The degree of frequency and
consequence for the identified hazards was then assessed based on the experience and
judgement of the expert panel.
Fig. 1. Qualitative risk assessment framework (Applied HAZOP method) (Lee, 2016; Rausand and Høyland, 2004).
There are many more examples of qualitative studies on LNG systems. For example,
Tugnoli et al. (2010) performed the safety assessment of LNG regasification systems
onshore, concluding that advanced tools are required for investigating the safety levels of
LNG plants more systematically. Nicola et al. (2015) identified potential hazards associated
with LNG regasification plants in a qualitative way. They highlighted the lack of
experience as the key limitation of the qualitative method. Giardina and Morale (2015)
have carried out a qualitative risk assessment by combining an FMECA and HAZOP
methods to investigate the safety of LNG regasification plant. Like other qualitative studies,
the risk of the proposed plant had been determined based on the knowledge of experts.
Similar to HAZOP, hazard identification study (HAZID), failure mode and effects analysis
(FMEA) and What-if analysis are widely acknowledged as cheap and simple qualitative
of likelihood and severity. In all these methods the risk is determined by combining the
severity of its impact with the likelihood of its occurrence (Rausand and Høyland, 2004).
They rely heavily on expert judgment and experience, and this may prove problematic
when assessing the risk of systems for which there is lack of knowledge and experiences
(Vinnem, 2007; Nicola et al., 2015). Nevertheless, there is no denying that there are some
advantages in using qualitative risk assessment methods.
For more stringent safety investigations, however, a quantitative method through which
frequency and consequence of unwanted events can be quantified based on reliable
statistics and analytical/computer-aided calculations will be necessary (Rausand and
Høyland, 2004). On the other hand, for complex systems having a number of equipment
working at different operating conditions, the industry often uses ‘selective’ quantitative
risk assessment which examines only the risks associated with particular scenarios,
operating conditions or sub-systems which are pre-identified as critical or hazardous
through qualitative studies. Spouge (1999) and Vinnem (2007) have outlined general
guidance of quantitative risk assessment applicable to offshore oil and gas units. Likewise,
there are some example studies (Dan et al., 2014; ISO, 2015) using this framework as
illustrated in Fig. 2. In this framework, qualitative risk assessment is preceded in order to
identify critical parts of systems before ‘selective’ quantitative risk assessment where the
focus is placed on investigating the risk of the critically-identified parts.
D’alessandro et al. (2016) has developed a decision-making tool to select an LNG
regasification plant site. In this study, the feasibility of the plant site was determined
through a selective quantitative risk assessment where potential hazards were identified in
a qualitative way. Martins et al. (2016) also carried out a quantitative risk analysis of LNG
regasification unit based on the selected hazardous scenarios.
The selective quantitative risk assessment have been also extensively applied to complex
LNG technologies in the variety of marine/offshore industries. For example, Jeong et al.
LNG fuelled-ships while Chae (2016) compared the risk impacts for different types of
on-board LNG liquefaction systems. In addition, Park et al. (2017) have evaluated the safety
of structure of LNG liquefaction process systems for FLNG against the potential explosion
and Kim et al. (2016) carried out fire simulations to determine the optimal position of water
deluge systems for an offshore unit through the selective quantitative risk assessment.
The selective methods, however, inherently rule out the hazards which are either
unidentified or deemed minor, possibly underestimating the overall risk level.
Fig. 2. Selective quantitative risk assessment framework (ISO, 2015).
2.2. Proposed method
Due to the short operational history of FRUs the statistical accident data is in very short
supply. A method to derive the probability of failure of novel systems from the known
historical data is, therefore, needed. Such a method was developed and applied to the
current study. In essence, it breaks down the plant to be studied into components for which
the historical data exist. The data for the overall system can then be built up by combining
the component data. Not only does this method allow the use of existing data on individual
components of the system, but it also enables the safety of the whole system be studied
instead of concentrating on critical hazards only. A more detailed explanation of this
modelling is as follows:
A complex system is divided into several sub-systems according to a set of parameters
(e.g. location and operating hours) as illustrated in Fig. 3. Each sub-system is then split
into sub-groups in accordance with a further set of parameters (e.g. operating pressure,
unit groups are components for which enough operational experience has been gained
and accident data are therefore obtainable, such as pipes, valves, pumps and so on.
Fig. 3. Proposed quantitative risk assessment framework.
In this study, it was found that three-level hierarchy was sufficient to model the LNG
regasification unit of the FRU. The risk of each group was individually assessed, and
the risk of each sub-system was evaluated by summing up the risk of all its groups.
The overall risk was then obtained summing the risk of all the sub-systems (Fig. 4).
Fig. 4. Proposed process of evaluating the overall risk using the hierarchical modelling.
The frequency of failure of an individual component (or sub-system) is combined with
the impact of consequences (flash fire, jet fire, pool fire and explosion), completely
independent of other components. There are two types of ‘cross coupling’ between
two or more components: one is the probability of the accidents occurring
simultaneously; and the other is an accident in one component bringing about an
accident in another component. We can ignore the first of these because the probability
of this will be extremely low, although there is a small possibility that the simultaneous
accident produces a more severe consequence than the sum of the two accidents. The
second cross coupling refers to the possibility of one failure escalating into a larger
incident involving more than the originator component. However, we have already
taken into account this type of escalation in estimating the amount of fuel leaked and
accumulated in constructing the accident scenarios. Therefore, it is not unreasonable
to treat the components as separate isolated systems. We can, therefore, directly
combine the risks of the individual sub-systems to obtain the overall risk of the entire
The major consequences of fuel leak can be economical cost, environmental damage and
human lives. Whilst recognising the importance of the first two types, we have decided to
concentrate on the last, thus reckoning the risk in terms of probability of human lives lost
in the form of F-N curves. It means the overall risk of the entire system is sensitive to the
density and distribution of population exposed to the potential hazards. Thus it should be
noted that the overall risk of the entire system is not a fixed value but can be changed by
the density and distribution of population. The hierarchical modelling when applied to this
type of risk assessment can be illustrated as in Fig. 5.
Fig. 5 An example of quantitative risk assessment using hierarchical system modelling.
If the estimated risk for the entire system is unacceptably high, safety measures must be
applied (such as gas detectors with automatic isolation function). The overall risk is
reassessed with the new measures added, and the process continues until the overall risk
becomes tolerable.
It is thought that this approach will overcome the shortcomings and limitations of the
existing qualitative and selective quantitative analyses. This idea was incorporated into the
in-house integrated quantitative risk assessment software called IQRA (Jeong et al. 2017b),
and the key data, parameters and models used in this study are discussed below.
2.2.1. Frequency analysis
In the event of a flammable liquid/gas being discharged through a leak, it may be ignited
immediately, after some delay or not at all. Immediate ignition leads to a fire: a gas leak
develops a jet fire while a liquid leak turns into a pool fire. If, on the other hand, ignition is
delayed until the gas disperses, forming a flammable vapour cloud, an explosion (in
confined or congested spaces) or a flash fire (in open spaces) may occur (Dan et al., 2014;
ISO, 2015). In order to identify all possible routes to these final outcomes an event tree
Fig. 6. An event tree (Dan et al., 2014).
The IQRA software quantifies the probability of the occurrence of the final outcomes by
adopting the recognized generic data and models which are widely accepted for
investigating hydrocarbon releases including LNG. In detail, the frequency of an initial
leak from process equipment is analysed with respect to several representative leak hole
sizes: 3 mm, 10 mm and 50 mm and 100 mm and full rupture size based on the DNV Leak
Frequency Datasheets (DNV, 2012). The software also estimates the probability of ignition
which is commonly determined by fuel phase and release rate; and a DNV model for
immediate ignition as presented in Table 1 and OGP models for delayed ignition described
[image:11.595.159.487.535.773.2]in Table 2 were used in this study.
Table 1 Probability of immediate ignition (DNV, 2013).
Release rate (kg/s) Immediate ignition probability
Gas Liquid
Less than 1 Less than 1.2 0.0001 1-10 1.2-25 0.001
Over 10 Over 25 0.01
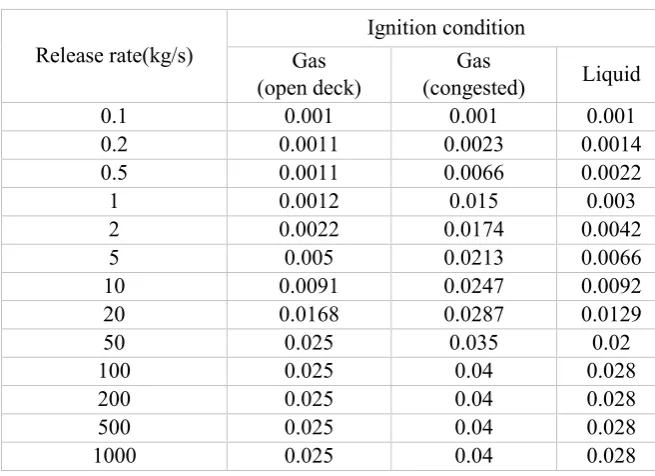
Table 2 Probability of delayed ignition (OGP, 2010).
Release rate(kg/s)
Ignition condition Gas
(open deck)
Gas
(congested) Liquid
0.1 0.001 0.001 0.001
0.2 0.0011 0.0023 0.0014
0.5 0.0011 0.0066 0.0022
1 0.0012 0.015 0.003
2 0.0022 0.0174 0.0042
5 0.005 0.0213 0.0066
10 0.0091 0.0247 0.0092
20 0.0168 0.0287 0.0129
50 0.025 0.035 0.02
100 0.025 0.04 0.028
200 0.025 0.04 0.028
500 0.025 0.04 0.028
[image:11.595.158.494.538.772.2]2.2.2. Consequence analysis
The consequence analysis is carried out in several steps: calculation of liquid release rate;
modelling of LNG pool spread and evaporation; and evaluating the impact of fires and
explosion for each representative leak hole size.
For liquid leak model, the initial leak rate of LNG is calculated based on the classical work
of Bernoulli’s equation in consideration of leak hole size as well as operating pressures.
With the application of the discharge coefficient, the leak rate through a leak outlet is given
by Eq. (1) (DNV, 2013; Crowl and Louvar, 1990; Woodward and Pitbaldo, 2010).
LR L L LNG S A
Q =C A 2ρ
(P -P )
(1)
On the other hand, the gas leak rate is estimated with respect to the two specific flow
regimes: sonic flow for higher internal pressures and subsonic flow for lower pressures.
For the gas leak model, Eq. (2) defines the pressure at which the flow regimes change from
sonic to subsonic (Yoon et al., 2008).
γ γ-1 CR s P 2 ( ) =( )
P γ+1
(2)
Eq. (3) is applicable to a gas leak rate at sonic flow condition:
(γ+1) (γ-1)
a
V L S
S s s CR
P
γMW
2
P
Q =C A P
for
RT
γ+1
P
P
G
(3)
The leak rate of a gas at subsonic flow through a leak hole is given by:
2 (γ+1)
γ γ
C a a a
V G L S
S s s s s CR
γg MW
γ
P
P
P
P
Q =C A P
-
for
>
RT
γ-1
P
P
P
P
To estimate the LNG spread and evaporation, the software adopts the film boiling model
of Klimenko (Klimenko, 1981) based on Newton’s law of cooling. To estimate the shape
of pool fire, the flame model derived by Thomas (1965) is applied. The radiation effect of
pool fires with tilted flame by wind effect on personnel is estimated by means of the view
factors for vertical and horizontal receiving surfaces given by Hoftijzer (1979) and Ramiro
and Aisa (1998). In addition, the present study adopted Cook model (Cook et al., 1990) to
estimate the impact of jet fire.
In order to estimate the impact of flash fire, Gaussian gas dispersion models (Woodward
and Pitbaldo, 2010; Perkins, 1974) were used in predicting dispersion effect and gas
concentration. The software uses TNO multi-energy model 7 models (Woodward and
Pitbaldo, 2010; Frank, 1980) for investigating the explosion impact.
To quantify the adverse impact of pool fire (for radiation) and explosion (for overpressure),
the probability of fatality (Pf) was estimated by probit models described in Eqs (5) to (7)
(Jafari et al., 2012; Zarei et al., 2013; Mohammadfan and Zarei, 2015). Radiation exposure
time (te) was assumed to be 60 seconds, equivalent to the safety guidelines from the Centre
for Chemical Process Safety (CCPS, 2000).
PF PF
F
PF
PB -5
PB -5
PR =0.5 1+
erf
PB -5
2
(5)For pool fire,
PB =-14.9+2.56×ln(q
PF TR4 3×t)
(6)2.2.3. Risk assessment
Risk is usually expressed in terms of lives lost and injuries caused by accidents. And,
therefore, the degree of risk depends on human population distribution at the site. Using
the calculation results from Eqs (5) to (7), the number of fatalities caused by pool fire and
explosion are calculated by Eqs (8) to (9) (Zarei et al., 2013; Mohammadfan and Zarei,
2015).
C C
A r
PF D F_PF D F_PF
0 0
NF = PO ×PR
dA=2π PO ×PR
dr (8)A r
EX D F_EX D F_EX
0 0
NF = PO ×PR
dA=2π PO ×PR
dr
C C
(9)Flash fires are directional due to wind (evenly distributed in, say, East, South, North and
West). Therefore, a quarter of the population (25 %) within the critical zone can be regarded
as fatalities as shown in Eq. (10).
C C
A r
FF D D
0 0
1 1
NF = PO × dA=2π PO × dr
4 4
(10)Similarly, the direction of a jet fire depends on the positioning of the leak hole (say, up,
down, left and right). The jet fires pointing up or down are less likely to come into contact
with human bodies, and therefore only the left and right directions are regarded critical
(probability of 0.5). For every critical jet fire, one quarter of the population (25 %) within
the critical zone can be considered as fatalities as shown in Eq. (11).
A r
JF
0 0
1
1
1
N =
PO × dA=2π PO × dr
2
4
8
C C
D D
(11)3.
Case study
3.1. Description of the case ship
The JSK FRU operating in Port of Benoa, Indonesia (Fig. 7) was selected for a case study.
It supplies onshore power plants with natural gas after processing it using the on-board
LNG regasification units and its principal dimensions are 46.0 m long, 12.0 m broad and
5.0 m deep.
Fig. 7. Case ship – JSK FRU (by courtesy of JSK Shipping Co., Ltd).
It has an LNG loading system and an LNG storage tank fitted on open space while the
regasification units are placed in a partially-confined room, designated as the
‘regasification unit space’. Two sides (starboard and aft) of the space are blocked by the
wall structures while the other sides (forward and port) are open.
The FRU was designed in such a way that LNG supplied by LNG carriers is stored in an
LNG storage tank (IMO C type 400m3 tank). The storage tank help stabilize the pressure and the flow of the liquid fuel before the regasification process. The feed pumps transfer
the stored LNG to the vaporizers where the liquid fuel is transformed into a gaseous form
through heat exchange. During the regasification process, the excessive BOG (boil-off gas),
naturally occurring inside the storage tank, flows by pressure difference to the BOG process
system where the gas is heated by a preheater, before being compressed by compressors.
Both the vaporized LNG (natural gas) and the compressed BOG are combined and
transported to the power plant nearby. The regasification process is illustrated in Fig. 8.
Fig. 8. Regasification process.
Fig. 9 shows a simplified piping system diagram of the FRU topside process broken down
into hierarchical groups. The whole system was separated into two sub-systems. The
systems placed in open spaces were allocated to Sub-System 1 while the others located in
partially-confined spaces were put into Sub-System 2. These were then divided into several
sub-groups; the components were placed in the same group if operating conditions (in
particular, system pressure, temperature, size and fluid phase) were identical. Fig. 10
summarises the characteristics of each sub-system and sub-group, showing the list of
components belonging to each sub-group. This process of system hierarchical modelling
now allows the risk of each sub-group to be quantified independently, allowing the risk of
the overall system to be estimated.
Fig. 9. Simplified diagram of LNG regasification unit.
Fig. 10. System hierarchy.
3.3. Risk assessment
3.3.1. Frequency analysis
In estimating the system failure leading to LNG leak, the frequency of five leak hole sizes
were used for each sub-group, making the total number of cases 20 for Sub-System 1 with
its four sub-groups and 30 for Sub-System 2 with its six sub-groups. Fig. 11 shows the
frequencies estimated as discussed in Section 2.2 earlier. The results show that the
probability of initial leak depends on the equipment involved and their size. For example,
the Sub-Group 2 in Sub-System 1 has relatively higher probability of LNG (or gas) leak
than other groups. On the other hand, in general, incidences with small hole leakage is more
frequency of 5mm leak hole is 8.0E-3 /year in Sub-Group 2 while that of 250 mm leak hole
is as low as 5.0E-4. The same trend is also observed in other sub-groups. Compared with
Sub-System 1, the frequency of system failure for the sub-groups in the Sub-System 2 is
relatively higher, especially for the Sub-Group 3 which has many more components than
others.
Fig. 11. Estimated leak frequency.
In order to estimate the frequency of the final outcomes, each case of initial leak was
subjected to ETA as discussed in Section 2.2. The ETA programmed in the software has
seven phases: frequency of initial leak, immediate ignition, leak duration, ventilation
system, delayed ignition and final outcomes.
The scenario of limited fuel leak represents a situation where a safety system is immediately
activated to isolate the leaky part of the system in the event of a fuel leak occurring.
However, since the FRU as it stands does not have gas detection systems or any other
relevant safety measures, the first iteration did not consider any safety measures, and
therefore the leak duration led to the late isolation scenario. In addition, to ensure that the
worst case scenario was followed sufficient leak duration was allowed: thus, the leak
recognition and isolation were assumed to be delayed by up to 10 minutes (Dan et al., 2014).
The case ship was designed in such a way as to make natural ventilation always effective
for both open deck and the regasification unit space, thus obviating the necessity of a
mechanical ventilation system. Therefore, the probability of ventilation system failure was
disregarded. On the other hand, the congestion ratio was assumed to be 25 % for
Sub-System 1 (as one out of four directions was blocked) and 50 % for Sub-Sub-System 2 (as two
out of four directions were blocked). For estimating the probability of delayed ignition for
gas release, Sub-System 1 adopted the ignition model for open spaces, while Sub-System
ET (3mm leak hole of Sub-Group 1 for Sub-System 1) is shown in Fig. 12. The other cases
for both Sub-Systems 1and 2 also used the same process of ETA.
Fig. 12. ET for 3mm leak hole for Sub-Group 1 of Sub-System 1.
3.3.2. Consequence analysis
The leak rates estimated using Eqs (1) to (4) are presented in Fig. 13. The results show that
the main factors determining the rates are leak hole size, leak pressure and fuel phase. For
example, the leak rate of Sub-Group 1 in Sub-System 1 having liquid phase with high
pressure (3.0 bar) is notably higher than other groups having gas phase or low pressure in
the same system. For Sub-System 2, Sub-Group 2 has the highest leak rate due to high
pressure (9.35 bar) of LNG flow.
Using analytical and empirical models described in Section 2.2, the impact of each accident
(jet fire, flash fire, flash fire and explosion) was evaluated. The impact of each consequence
is expressed as the probability of fatalities in accordance with distance. With pool fire, for
example, 100% fatalities were assumed where the effect of radiation is 35.0 kW/m2 or above, while 50% and 10% fatalities are considered for 12.5 kW/m2 and 5kW/m2 respectively (Jeong et al. 2017b). Therefore, the total number of fatalities can be estimated
based on the density and distribution of population provided.
For estimating flash fire, a neutral weather condition with a wind speed of 5 m/s was
assumed in accordance with the prevalent annual weather records of Kuta/Bali, Indonesia
(Windfinder, 2016).
3.3.3. Assessment results
For convienience of analysis, the subject area was divided into several discrete zones
according to the radius from the source: Zone 1 (below 5m), Zone 2 (5-15 m), Zone 3
(15-25 m), Zone 4 ((15-25-50 m), Zone 5 (50-100 m), Zone 6 (100-200 m) and Zone 7 (over 200
m). These zones were then populated based on the actual data at the site as shown in Fig.
14. It was assumed that the population was evenly distributed within each discrete zone.
Fig. 14. Terminal population (by courtesy of JSK Shipping Co., Ltd).
Using the population distribution, the number of fatalities was estimated for each accident
using Eqs (3) to (10). The results are presented as F-N graphs as shown in Fig. 15. It shows
the process of risk assessment using hierarchical system modelling as well as the overall
risk of the whole system (summation of Sub-Systems 1 and 2). It is a common practice to
show the upper and lower limits of tolerable risk on the same graph (Norway, 2000; Vanem
et al., 2008), to allow judgement of tolerability of the risk. The range of tolerable level was
taken from the IMO MSC Circular 72/16.
The assessment results show that, although the risk of Sub-System 1 is well within the
tolerable limit, the risk level of Sub-System 2 exceeds the limit, making the overall risk
intolerably high. It was decided, therefore, that some safety measures had to be introduced
to improve the safety.
3.4
. Risk assessment with safety measures
Given the result of intolerably high risk, an action to enhance the safety of the system is
necessary. Gas detection systems fitted with an automatic alarming and valve cut-off
systems were introduced for this purpose. A number of configurations were devised and
the risk assessment was carried out for each. It was assumed that the initial leak is detected
by the gas detector, not the crew, because there is no mandatory requirement for the
presence of engineers at the site.
3.4.1. Modification of frequency analysis
An automatic gas detection system detects the presence of hydrocarbon in spaces where it
is not normally expected and an alarm can be triggered when the concentration exceeds a
threshold value. An emergency shut-off system is then activated to isolate the leak. The
isolation can also be effected manually if the automatic isolation malfunctions.
Taking into account these mitigation measures, a modified ET was developed as shown in
Fig. 16. The limited leak scenario represents the case where the safety measures prevent an
initial leak from developing into unfavourable outcomes. On the other hand, the late
isolated leak scenario unfolds when both automatic and manual isolation processes fail.
The failure of manual isolation can be caused by the failure of the gas detector or the alarm
system, or the operator not taking or being able to take appropriate action when the alarm
sounds. This leads to the emergency shut-off valve failing to close in time. Where automatic
isolation is used, a failure of either the leak detector or the shut-off valve leads to the failure
of the automatic shut-down. In both cases of failure the isolation of the leak is at least
prolonged, possibly for some time.
In order to examine the probability of the late isolated leak scenario, the present paper
adopted FTA (fault tree analysis) method using the generic data about safety system failure
The failure rate per year, λ, was calculated from the upper failure rates given by the named
sources. The reliability of each equipment was then estimated using Eq. (12) (Santamaria
and Brana, 1998).
( ) t
R t e
[image:21.595.132.520.257.375.2](12)
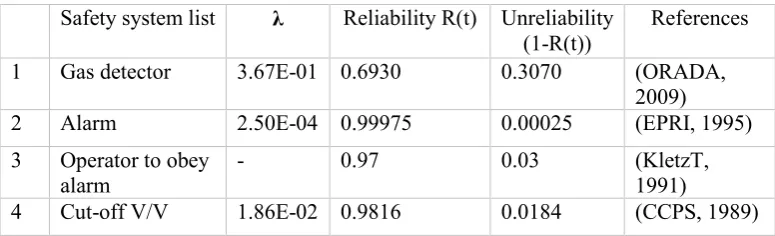
Table 3 Reliability data for safety systems.
Safety system list λ Reliability R(t) Unreliability (1-R(t))
References
1 Gas detector 3.67E-01 0.6930 0.3070 (ORADA, 2009) 2 Alarm 2.50E-04 0.99975 0.00025 (EPRI, 1995) 3 Operator to obey
alarm
- 0.97 0.03 (KletzT,
1991)
4 Cut-off V/V 1.86E-02 0.9816 0.0184 (CCPS, 1989)
Fig. 17 shows the result of FTA when one gas detection system was used for the safety
system (referred to as Case 1 hereafter) while Fig. 18 is for two gas detection systems used
(referred to as Case 2 hereafter). It was found that the probability of the late isolation
associated with Case 2 was 0.014, far less than Case 1 that was 0.113. Given that the
consequence of the hazards are closely related to the leak duration, two gas detection
systems will guarentee higher reliability to limit the leak duration, thereby reducing the
consequece of hazards, than one gas detection system. The estimated probabilities of
successful gas detection and appropriate action taken are applied to the ETs. Examples of
Fig. 16. Modified ET.
Fig. 17. FT for late isolation with one gas detector.
Fig. 18. FT for late isolation with two gas detectors.
Fig. 19. Modified ETs for 3mm leak hole for Sub-Group 1 of Sub-System 2.
3.4.2. Assessment results
The initial HAZOP study recommended the installation of gas detection systems into three
points: LNG storage tank, regasification unit and BOG process unit. In this context, the
idea of the present study is to investigate the optimum arrangement of gas detection systems
from the safety point of view. Firstly, one or two safety measures was applied to
Sub-System 1 only and the risk assessment was carried out with the result shown below. The
same safety measure was applied to Sub-System 2 only and the overall risk level was
evaluated in the same manner. The results were then compared with the tolerable risk level
to find out the optimum solution.
Safety measures applied to Sub-System 1
Fig. 20 shows the assessment results when the safety measures (both Cases 1 and 2) were
applied to Sub-System 1. It is plain that this use of the safety measures did nothing to reduce
the overall risk of the entire system. In both cases, the frequency of the entire system in
accordance with the number of fatalities exceeds the upper limit of tolerable level in some
enough to be tolerable to begin with. This confirms that introducing safety measures to
areas of low risk is ineffective.
This result indicates that one of the safety recommendations from the original HAZOP
study (i.e. installation of gas detectors with automatic isolation system at the LNG storage
tank) would have been ineffective.
Fig. 20. F-N graphs of risk with safety measures incorporated in Sub-System 1.
Safety measures applied to Sub-System 2
Fig. 21 shows the outcomes of the gas detection systems incorporated in Sub-System 2,
suggesting that this addition to Sub-System 2 will be effective. In both cases, the F-N curve
was seen to have been brought down to below the tolerable limit. Furthermore, a single gas
detection system is seen to be sufficient, while two detection systemss lower the risk further.
Given this, it can be concluded that at least one gas detection system applied to Sub-System
2 can constitute ‘the appropriate number of gas detectors’ as mentioned in the original
HAZOP recommendations.
Fig. 21. F-N graphs of risk with safety measures incorporated in Sub-System 2.
3.4.3. Comparison with selective quantitative risk assessment
In order to investigate the effectiveness of the hierarchical quantitative method proposed in
this paper, the same system was studied using the selective quantitative analysis for
comparison. Three accidental scenarios identified through the HAZOP study were used for
this selective quantitative risk assessment (Korean Register, 2015).
Scenario 2 - Vapour leak from BOG processing unit
Scenario 3 - Liquid leak from LNG storage tank
A leak from manual valves and pipes attached to the systems were reckoned as the most
probable case through the HAZOP study. For a stringent analysis, the leak was assumed to
take place at the parts subjected to the highest pressure and the biggest piping system. In
this context, the list of equipment involved in Scenario 1 is identical to Sub-Group 2 of
Sub-System 2 while those of Scenarios 2 and 3 are the same as Sub-Group 4 of Sub-System
2 and Sub-Group 4 of Sub-System 1 respectively. The analysis results are summarized in
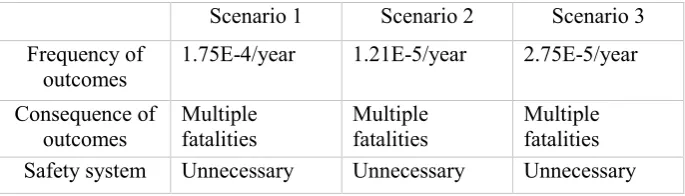
Fig. 22 and Table 4. As can be seen, the risks of all scenarios are within the tolerable zones
in the F-N graphs, implying that enhancing the safety of FRU is unnecessary.
[image:24.595.155.498.423.521.2]Fig. 22. F-N graphs of risk from selective quantitative risk assessment.
Table 4 Results of selective quantitative risk assessment.
Scenario 1 Scenario 2 Scenario 3 Frequency of
outcomes 1.75E-4/year 1.21E-5/year 2.75E-5/year Consequence of
outcomes
Multiple fatalities
Multiple fatalities
Multiple fatalities Safety system Unnecessary Unnecessary Unnecessary
This conclusion is somewhat at odds with the conclusions of the HAZOP study and the
hierarchical quantitative assessment. It is to be noted that the risk levels obtained from the
selective quantitative assessment are far lower than the results obtained from the current
study. This suggests that the selective assessment can underestimate the risks of
4.
Discussion
The history of FRUs is very short indeed, and consequently there is no accumulated
historical failure data available. While there are many publications associated with the
safety of LNG processing systems on-shore in chemical industries, only a few publications
deal with FRUs. It is hoped that the work presented in this paper show a way of tackling
the safety of FRUs.
The principle of the hierarchical modelling method is a process of analysing and
synthesising: the system is ‘analysed’ to the component level and the frequency of the
system is then ‘synthesised’ from the failure frequencies of the basic components. We
believe that this principle can be applied to any situation where the overall risk consists of
multiple hazard factors such as collision, excessive ship motions, harsh weather conditions
and human failure.
The frequency analysis presented in this paper had to rely on available generic data
compiled for investigating the safety of LNG process equipment in offshore and chemical
industries. It is inevitable, therefore, that some of the quantitative results obtained from this
study may not reflect reality. This may have to be carefully examined in the future, but
effort has been made to be realistic using available data by breaking down the system to
component level for which such data exist. It is thought that the hierarchical method goes
considerable way towards generating realistic frequency data.
It is recognised that the impact and consequences of accidents can vary widely depending
on such factors as the structural arrangement within the FRU and the weather conditions at
the time of the accidents. One way of dealing with this problem is to carry out the analysis
for a number of conditions and attach the probability of occurrence of such conditions. Of
course, such exercise will have to use ‘state-of-the-art’ numerical tools, such as CFD and
FEA, to analyse the consequences. It is important to point out here is that this paper is the
record of a generic study, primarily to discover if the current practice of safety or risk
5.
Concluding Remarks
The present paper investigated the potential risk of the topside units fitted on an FRU using
a hierarchical method. The results were compared with those obtained by the initial
[image:26.595.125.526.246.458.2]qualitative risk assessment and the selective analysis. This is summarised in Table 5.
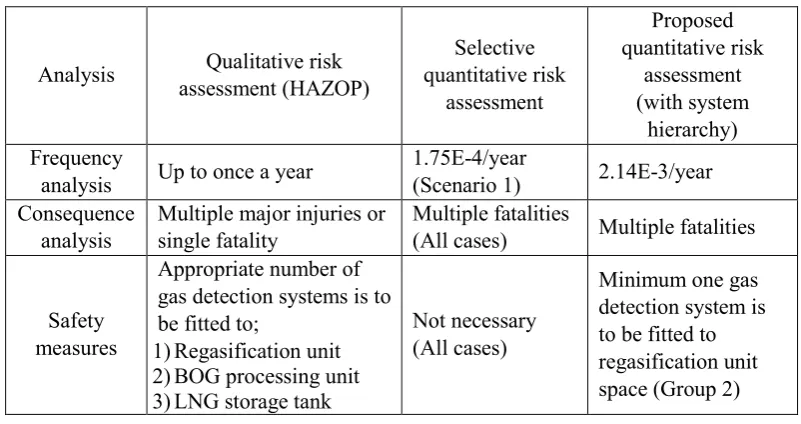
Table 5 Summary of study results.
Analysis Qualitative risk assessment (HAZOP) Selective quantitative risk assessment Proposed quantitative risk assessment (with system hierarchy) Frequency
analysis Up to once a year
1.75E-4/year
(Scenario 1) 2.14E-3/year Consequence
analysis
Multiple major injuries or single fatality
Multiple fatalities
(All cases) Multiple fatalities
Safety measures
Appropriate number of gas detection systems is to be fitted to;
1)Regasification unit 2)BOG processing unit 3)LNG storage tank
Not necessary (All cases)
Minimum one gas detection system is to be fitted to regasification unit space (Group 2)
The initial HAZOP study identified fire/explosion caused by leak from pipe and valves as
the most intolerable scenario, which may occur between once a year and once per ten years,
causing multiple major injuries or a single fatality. It was recommended that the safety
measures be independently applied to regasification unit, BOG processing unit and LNG
storage tank.
A selective risk assessment on major hazardous scenarios already identified by the initial
HAZOP study was conducted. The results show that the risk of Scenario 1 with the
accidental frequency of 1.75E-4/year was the most critical case. Although the consequence
of fire/explosion was assessed as multiple fatalities, the estimated risk levels for all
scenarios were found to be tolerably low, obviating the need for further safety measures.
system. In this way no part of the system was allowed to be disregarded. The probability
of the occurrence of an accident was 2.14E-3/year which is far higher than the one obtained
by the selective quantitative risk assessment, but somewhat lower than the results from the
HAZOP study.
The outcome of the initial iteration suggested that some form of safety measures was
necessary. It was subsequently found that one gas detector with the automatic isolation unit
applied to the regasification unit space only is sufficient to bring the overall risk to an
acceptable level.
Last but not least, the present study also shows the hierarchical system modelling method
as implemented in an in-house integrated quantitative risk assessment software is effective
Acknowledgement
The authors would like to express their gratitude to JSK shipping CO., Ltd and Korean
Register of Shipping for their invaluable support, comments and suggestions. They have
References
Center for Chemical Process Safety of the American Institutute of Chemical Engineers
(CCPS)., 1989, Guidelines for Process Equipment Reliability Data with Data Tables,
New York USA, CCPS.
Center for Chemical Process Safety (CCPS), 2000. Guidelines for chemical process
quantitative risk analysis. 2nd ed. New York: American Institute of Chemical Engineers
(AIChE).
Cook, J., Bahrami, Z., Whitehouse, R., 1990. A comprehensive program for calculation
of flame radiation levels. Journal of Loss Prevention in the process industries 3 (1),
150-155.
Chae, M., 2016. Effect of liquefaciton process selection on explosion risk of LNG-FPSO.
Seoul National University.
Crowl, D.A., J. F. Louvar, 1990. Chemical Process Safety: Fundamentals with
Applications. Prentice Hall, New Jersey USA.
Dan, S. et al., 2014. Quantitative risk analysis of fire and explosion on the top-side
LNG-liquefaction process of LNG-FPSO. Process Safety and Environmental Protection 92,
430-441.
DNV, 2012. failure frequency guidance: Process Equipment Leak Frequency Data for use
in QRA, Oslo Norway.
DNV, 2013. DNV report SKANGASS AS, report no. 2013-4091/17TLT29-4.
D’alessandro, A., Izurieta, E., Tonelli, S., 2016. Decision-making tools for a LNG
regasification plant siting. Journal of Loss Prevention in the process industries 43, 255-262.
Electric Power Research Institute (EPRI)., 1995, Advanced Light Water Reactor Utility
Frank, T., 1980. Industrial explosion prevention and protection, New York UAS, Mc
Graw-Hill.
Giardina, M., Morale, M., 2015. Safety study of an LNG regasification plant using an
FMECA and HAZOP integrated methodology. Journal of Loss Prevention in the process
industries 35, 35-45.
Hoftijzer, G.W., 1979. Heat radiation, in Methods for the Calculation of the Physical
Effects of the Escape of Dangerous Material (Liquid and Gases). Directorate General of
Labour, KH Vooburg, the Netherlands.
IGU, 2015. IGU World LNG Report – 2015 Edition, World Gas Conference Edition,
Fornebu, Norway.
ISO, 2015. TS 18683: Guidelines for systems and installations for supply of LNG as fuel
to ships, Geneva Switzerland, ISO.
Jafari, M.J., Zarei, E., Badri, N., 2012. The quantitative risk assessment of a hydrogen
generation unit. International Journal of Hydrogen Energy 37 (24), 19241-19249.
Jeong, B., Lee, B.S., Zhou, P., 2017a. Quantitative risk assessment of fuel preparation room
having high-pressure fuel gas supply system for LNG fuelled ship. Ocean Engineering 137,
450-468.
Jeong, B., Lee, B.S., Zhou, P., Ha, S.-m., 2017b. Evaluation of safety exclusion zone for
LNG bunkering station on LNG-fuelled ships. Journal of Marine Engineering &
Technology, 1-24.
Kim, S.J., Lee, D.H., Hong, H.M., Ahn, S.H., Park, J.B., Seo, J.K., Kim, B.J., Paik, J.K.,
2016. Methods for determining the optimal arrangement of water deluge systems on
Klimenko, V., 1981. Film boiling on a horizontal plate—new correlation. International
Journal of Heat and Mass Transfer 24 (1), 69-79.
Kletz, T., 1991. An engineer's view of human error. IChemE, Rugby UK.
Korean register, 2015. HAZOP study report - LNG Regasification system, Project NO.
4800-4-104, Doc. No: KR-HSE-HAZP-RPT-002B, Busan South Korea.
Lee S., 2016. News Release – Gas test of LNG regasification unit at Korean medium
sized shipyard, GAS Entec., Busan, Korea.
Martins, M., Pestana, M., Souza, G., Schleder, A., 2016. Quantitative risk analysis of
loading and offloading liquefied natural gas (LNG) on a floating storage and regasification
unit (FSRU). Journal of Loss Prevention in the process industries 43, 629-653.
Mohammadfam, I., Zarei, E., 2015. Safety risk modeling and major accidents analysis of
hydrogen and natural gas releases: A comprehensive risk analysis framework.
International Journal of Hydrogen Energy 40 (39), 13653-13663.
Norway, 2000. Decision parameters including risk acceptance criteria, MSC 72/16, IMO.
OGP, 2010. Risk Assessment Data Directory, Ignition probabilities, Report no. 434-6.1,
London UK.
OREDA Participants., 2009, Offshore Reliability Data Volume 1 Topside Equipment, 5th
edn., Trondheim Norway, OREDA participants, 2009.
Paltrinieri, N., Tugnoli, A., Cozzani, V., 2015. Hazard identification for innovative LNG
regasification technologies. Reliability Engineering & System Safety 137, 18-28.
Park, S., Jeong, B., Lee, B.S., Oterkus, S., Zhou, P., 2017. Potential risk of vapour cloud
explosion in FLNG liquefaction modules. Ocean Engineering.
Perkins, H. C., 1974. Air Pollution: Arizona, USA, McGRAW-HILL BOOK
Rausand, M., Høyland, A., 2004. System reliability theory: models, statistical methods,
and applications. John Wiley & Sons.
Ramiro, J.M.S., P. A. B. Aisa, 1998. Risk Analysis and Reduction in the Chemical
Process Industry. Blackie Academic & Professional, London, UK.
Santamaria R. and P. Brana,. 1998, Risk Analysis And Reduction in the Chemical
Process Industry, trans. J. Hutchinson, London UK, Blackie Academic & Professional.
Thomas, P., 1965. Fire Spread in wooden cribs: Part III The effect of wind, fire research
Note Nr. 600, in Fire Research Station. Boreham Wods, England UK.
Spouge, J., 1999. A guide to quantitative risk assessment for offshore installations. CMPT
Aberdeen, SD.
Tugnoli, A., Paltrinieri, N., Landucci, G., Cozzani, V., 2010. LNG regasification terminals:
Comparing the inherent safety performance of innovative technologies. Chemical
Engineering Transactions 19 (39), 391-396.
Vanem, E., Antao, P., Østvik, I., de Comas, F.D.C., 2008. Analysing the risk of LNG
carrier operations. Reliability Engineering & System Safety 93 (9), 1328-1344.
Victoria Z, Today in Energy, Floating LNG regasification is used to meet rising natural
gas demand in smaller markets [website]
http://www.eia.gov/todayinenergy/detail.cfm?id=20972, (accessed 28 June 2016)
Vinnem, J.E., 2007. Offshore Risk Assessment Principles, Modeling and Applications of
QRA studies. Springer, London.
Windfinder, wind&weather statistics, Kuta/Bali Airport, [website]
http://www.eia.gov/todayinenergy/detail.cfm?id=20972, (accessed 18 July 2016)
Woodward, J.L., Pitbaldo, R., 2010. LNG Risk Based Safety: modeling and consequence
Yoon, J., Ha J. and Park J, 2008. LNG vapour dispersion from atmospheric relief valve,
International gas union research conference, Paris.
Zarei, E., Jafari, M., Dormohammadi, A., Sarsangi, V., 2013. The role of modeling and
consequence evaluation in improving safety level of industrial hazardous installations: a