of nonTor Traffic
Elike Hodo1, Xavier Bellekens2, Ephraim Iorkyase1, Andrew Hamilton1, Christos Tachtatzis1and Robert Atkinson1
1University of Strathclyde, Scotland 2University of Abertay Dundee, Scotland
E-mail:{elike.hodo; ephraim.iorkyase; andrew.w.hamilton; christos.tachtatzis; robert.atkinson}@strath.ac.uk; [email protected]
Received 3 November 2017; Accepted 7 November 2017; Publication 24 November 2017
Abstract
Intrusion detection has attracted a considerable interest from researchers and industry. After many years of research the community still faces the problem of building reliable and efficient intrusion detection systems (IDS) capable of handling large quantities of data with changing patterns in real time situations. The Tor network is popular in providing privacy and security to end user by anonymizing the identity of internet users connecting through a series of tunnels and nodes. This work identifies two problems; classification of Tor traffic and nonTor traffic to expose the activities within Tor traffic that minimizes the protection of users in using the UNB-CIC Tor Network Traffic dataset and classification of the Tor traffic flow in the network. This paper proposes a hybrid classifier; Artificial Neural Network in conjunction with Correlation feature selection algorithm for dimensionality reduction and improved classification performance. The reliability and efficiency of the propose hybrid classifier is compared with Support Vector Machine and naïve Bayes classifiers in detecting nonTor traffic in UNB-CIC Tor Network Traffic dataset. Experimental results show the hybrid classifier, ANN-CFS proved a better classifier in detecting nonTor traffic and classifying the Tor traffic flow in UNB-CIC Tor Network Traffic dataset.
Journal of Cyber Security, Vol. 6 2, 171–194. doi: 10.13052/jcsm2245-1439.624
Keywords:Artificial neural network, support vector machines, intrusion detection systems, Naïve Bayes, Tor and nonTor, UNB-CIC Tor Network Traffic dataset.
1 Introduction
The computing world has changed over the past decade due to the rapid development of internet and new privacy enhancement technologies to circum-vent internet censorship. Tor which is popular in fighting internet censorship has been deployed to serve thousands of users transferring terabytes of data daily [1, 2].
Tor is an overlay network designed to provide privacy and anonymity over the internet for TCP based applications like browsing. It operates by anonymizing the identity of users connecting through a series of tunnels and nodes. A user browses the web firstly by sending a request anonymously to Tor routers from one of the directory servers [2, 3]. Once a connection is established, traffic is relayed to the first router also called the Entry Guard. A session key is then generated between the client and the Entry Guard using Deffie-Hellman key exchange [4]. The same process is repeated on one router (hop) at a time to extend the circuit each time with established session keys for the previous routers. The last hop called the exit router communicates directly with the destination as a proxy [1]. With the establishment of three routers, the circuit is ready for internet traffic. The design of TOR network which includes the use of three hops and session keys helps to maintain anonymity through a concept called ‘perfect forward secrecy’[2, 5].
Tor networks are created to give internet users their privacy, freedom of speech, illegal tapping traffic and surveillance of network threatening users’ personal identity [6]. Besides Tor network being used for good, greater portion of its traffic are port scans, hacking attempts, exfiltration of stolen data and online criminality [2].
Over the last decade, Tor traffic classification has advanced in its applica-tions in systems like quality of service (QoS) tools or Security information and Event management (SIEM) [7]. A considerable interest have been attracted from researchers and the industries to the study of these technologies and developing classification techniques [7–9].
components, based on the detection technique. Signature-based and Outlier-based IDS. Most IDs employ a signature-Outlier-based detection approach where the network traffic is monitored and compared against database rules or signature of known anomaly in network traffic, [10]. An alarm is raised on detection of a mismatch. Signature based is the most common as they do not necessarily have to learn the network traffic’s behavior. Although it is effective in detecting known anomalies, it cannot detect unknown anomalies unless the signature and rules are updated with new signatures [13, 14]. Signature based is known to have a significant time lapse between detection of an attack and activation of its corresponding signature [12]. Signature based techniques are mainly human-dependent in creating, testing and deploying signatures.
The outlier technique is a behavioral based detection system. It observes changes in normal activity of network traffic and builds a profile of the network traffic being monitored [15, 16]. An alarm is raised whenever a deviation from the normal behavior is detected. It has the ability to detect unknown anoma-lies. However outlier detection based IDS have the disadvantage of being computational expensive because the profile generated over a period needs to be updated against each system activity [12, 17]. Machine learning techniques have the ability to learn the normal and anomalous patterns automatically by training a dataset to predict an anomaly in network traffic. One important characteristic defining the effectiveness of machine learning techniques is the features extracted from raw data for classification and detection. Features are the important information extracted from raw data. The underlying factor in selecting the best features lies in a trade-off between detection accuracy and false alarm rates. The use of all features on the other hand will lead to a significant overhead and thus reducing the risk of removing important features. Although the importance of feature selection cannot be overlooked, intuitive understanding of the problem is mostly used in the selection of features [18].
the number of features from 23 to 5. The results from the feature selection algorithm was used to test different machine learning algorithms (ZeroR, C4.5 and KNN) using 10 fold cross validation and measured the weighted average precision and recall. Their results showed C4.5 was the best classifier.
In the proposed approach 10 features are selected out of the 28 features of the dataset using Correlation based feature selection (CFS) for training and testing the classification algorithm.
The rest of the paper is organized as follows: Section 2 describes intrusion detection systems, Section 3 describes the UNB-CIC Tor Network Traf-fic dataset, Section 4 introduces ArtiTraf-ficial neural network, Support vector machines and Naïve Bayes classification algorithms used in the experiment respectively, Section 5 discusses experiments and analysis of experimental results, conclusion and future works are presented in Section 6.
2 Intrusion Detection System
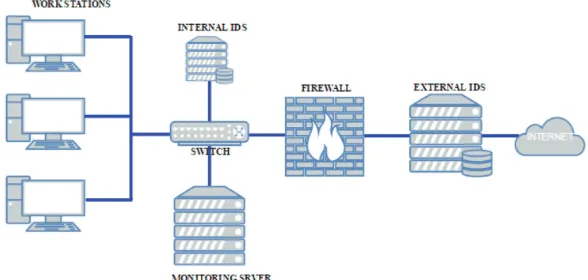
[image:4.612.150.444.476.616.2]Intrusion detection system is a software application or a device placed at strategic places on a network to monitor and detect anomalies in network traffic [19, 20] as shown in Figure 1. The main features of IDS are to raise an alarm when an anomaly is detected. A complementary approach is to take corrective measures when anomalies are detected, such an approach is referred to as an intrusion Prevention System (IPS) [21]. Based on the interactivity property of IDS, it can be designed to work either on-line or off-line. On-line IDS operates on a network in real time by analysing traffic packets and applying rules to
classify normal and analogous traffic. Off-line IDS operates by storing data and after processing to classify normal and anomaly.
3 UNB-CIC Tor Network Traffic Dataset
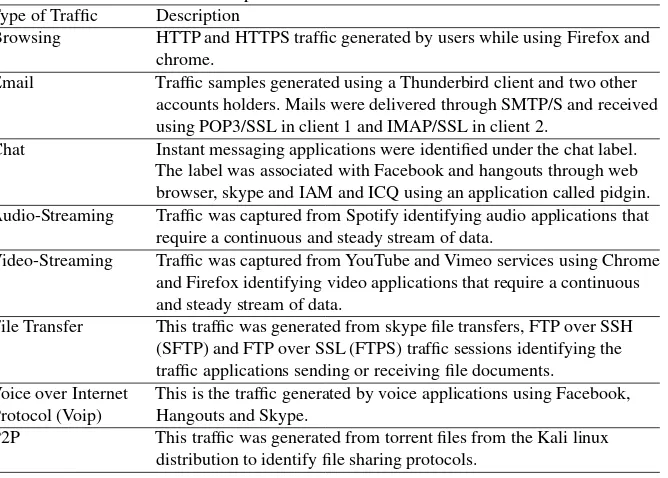
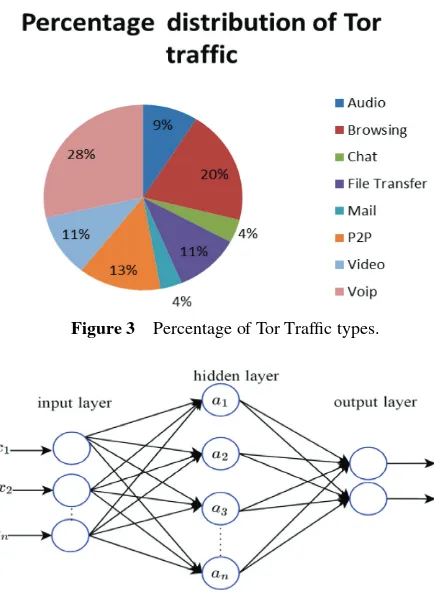
[image:5.612.135.469.379.618.2]The UNB-CIC Tor Network Traffic dataset [22] is a representative dataset of real-world traffic defined as a set of task. Three users were set up for browser traffic collection and two users for the communication parts such as chat, mail, p2p etc. from more than 18 representative applications such as Facebook, skype, Spotify, Gmail etc. The dataset contains 8 types of Tor traffic as shown in Table 1 and non-Tor traffic. The dataset contains 8044 (11.86%) records of Tor traffic and 59790 (88.14%) records of nonTor traffic. The non-Tor traffic captured in the dataset contains unique characteristics differentiating it from the Tor traffic. These characteristics are called features. The UNB-CIC Tor Network Traffic dataset contains a total of 28 features listed in Table 2.
Table 1 Description of UNB-CIC Tor Network Traffic Type of Traffic Description
Browsing HTTP and HTTPS traffic generated by users while using Firefox and chrome.
Email Traffic samples generated using a Thunderbird client and two other accounts holders. Mails were delivered through SMTP/S and received using POP3/SSL in client 1 and IMAP/SSL in client 2.
Chat Instant messaging applications were identified under the chat label. The label was associated with Facebook and hangouts through web browser, skype and IAM and ICQ using an application called pidgin. Audio-Streaming Traffic was captured from Spotify identifying audio applications that
require a continuous and steady stream of data.
Video-Streaming Traffic was captured from YouTube and Vimeo services using Chrome and Firefox identifying video applications that require a continuous and steady stream of data.
File Transfer This traffic was generated from skype file transfers, FTP over SSH (SFTP) and FTP over SSL (FTPS) traffic sessions identifying the traffic applications sending or receiving file documents.
Voice over Internet Protocol (Voip)
This is the traffic generated by voice applications using Facebook, Hangouts and Skype.
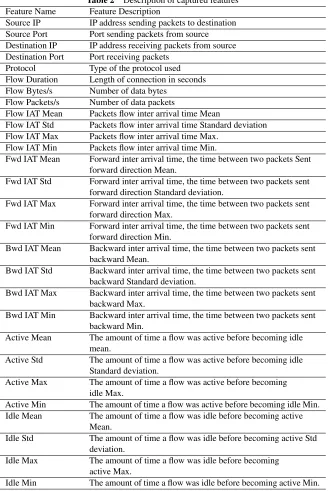
Table 2 Description of captured features Feature Name Feature Description
Source IP IP address sending packets to destination Source Port Port sending packets from source Destination IP IP address receiving packets from source Destination Port Port receiving packets
Protocol Type of the protocol used Flow Duration Length of connection in seconds Flow Bytes/s Number of data bytes
Flow Packets/s Number of data packets
Flow IAT Mean Packets flow inter arrival time Mean
Flow IAT Std Packets flow inter arrival time Standard deviation Flow IAT Max Packets flow inter arrival time Max.
Flow IAT Min Packets flow inter arrival time Min.
Fwd IAT Mean Forward inter arrival time, the time between two packets Sent forward direction Mean.
Fwd IAT Std Forward inter arrival time, the time between two packets sent forward direction Standard deviation.
Fwd IAT Max Forward inter arrival time, the time between two packets sent forward direction Max.
Fwd IAT Min Forward inter arrival time, the time between two packets sent forward direction Min.
Bwd IAT Mean Backward inter arrival time, the time between two packets sent backward Mean.
Bwd IAT Std Backward inter arrival time, the time between two packets sent backward Standard deviation.
Bwd IAT Max Backward inter arrival time, the time between two packets sent backward Max.
Bwd IAT Min Backward inter arrival time, the time between two packets sent backward Min.
Active Mean The amount of time a flow was active before becoming idle mean.
Active Std The amount of time a flow was active before becoming idle Standard deviation.
Active Max The amount of time a flow was active before becoming idle Max.
Active Min The amount of time a flow was active before becoming idle Min. Idle Mean The amount of time a flow was idle before becoming active
Mean.
Idle Std The amount of time a flow was idle before becoming active Std deviation.
Idle Max The amount of time a flow was idle before becoming active Max.
3.1 UNB-CIC Tor Network Traffic Dataset Description
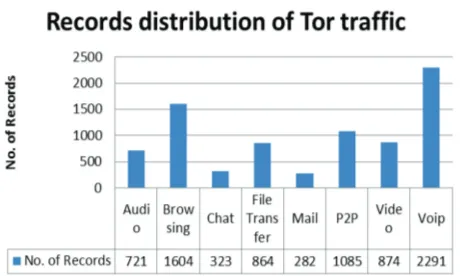
The features were generated by a sequence of packets having the same values for{source IP, source Port, destination port and protocol (TCP and UDP)}. All Tor traffic was TCP since the flow does not support UDP. The generation of flows was done by a new application, the ISCX Flow Meter which generates bidirectional flows [7]. The overview of network traffic of the UNB-CIC dataset is shown in Figure 2. The overview gives the percentage of the particular records of network traffic in the dataset.
4 Classification Algorithms
4.1 Artificial Neural Network
Artificial neural network (ANN) consists of information processing elements known to mimic neurons of the brain.
In this experiment, the neural network which is a Multilayer perceptron (MLP) is presented with a labelled training set which it uses to learn a mapping from input features listed in Table 2 represented asxin Figure 2 to outputs as yin Figure 2 given a labelled set of inputs-output pairs
d={(xi, yi)}Ni=1 (1)
Where,d is called the training set andN is the number of training examples. It is assumed thatyi is a categorical variable from some infinite set,yi ∈
[image:7.612.183.413.488.626.2]{1. . . C} [23]. The technique used to train the MLP neural network is the Back Propagation hence the name MLP-BP.
Figure 3 Percentage of Tor Traffic types.
Figure 4 Artificial Neural Network Model used in experiment.
The MLP-BP neural network is consists of layers of non-linear elements which form complex hypotheses. Each node takes an element of a feature vector. The structure of the ANN consists of three layers feed-forward neural network as shown in Figure 4. Nodes labelledx1. . . .xnhave been used to
represent the input feature vectors to the ANN.
Hidden inner nodes a1. . . .an make up the hidden layer with an
to estimate the error in the hidden nodes. The gradient of the cost – function is then calculated [24].
4.2 Support Vector Machines
Support Vector Machines (SVM) are a class of learning algorithms that learn to classify data using points labelled training examples falling into two or more classes. Binary classification is the most frequently employed approach [25]. For multi-class classification, a model is defined that comprisesk Models of SVM, wherek denotes the number of classes (Tor and NonTor).x1 and y2 SVM represented aslth SVM is trained with all the examples in thelth class labelled 1 and the other labelled 0.
Where,xi ∈ Rd, y
i ∈ {1,0}, i = 1. . . N and yi ∈ {1. . . k}is
a class ofxi. Introducing a slack of positive variablesξi, that measures the
extent of constraint in a non-linear situation. The prima Optimisation problem becomes [26]:
min
wl,bl,ξl
1
2(wl)Twl+ C
N
i=1 ξli
(wl)Tφ(x)i+bl≥1−ξil, if yi=N, (2)
(wl)Tφ(x)i+bl≤ −1 +ξil, if yi =N, ξil≥0, i= 1. . . N,
Where the training set xi are mapped into higher dimensional space by the function φ and C, where C is a parameter which trades off wide margin with small number of margin failures. Minimisation of 12(wl)Twl implies maximising1
wl,which is the margin between the two data points. The SVM
then searches for a balance between the regularisation term12(wl)Twland the errors in training the dataset. Solving (2) givesk decision functions:
(w)1Tφ(x) +b1
..
. (3)
(w)kTφ(x) +bk
where x is the class having the largest value of the decision function:
The dual problem of (2) having the same number of variables as the number of data in (2). Thusk N-variable quadratic programing problems are solved.
4.3 Naïve Bayes Networks
Naïve Bayes (NB) is a graphical modelling tool used to model the probability of variables of interest. It is a directed acyclic graph where each node represents a discrete random variable of interest. Each node contains the states of the random variable in a tabular form representing the conditional probability table (CPT). The CPT specifies the conditional probability of the domain variable with other connected variables [27, 28]. The probability is computed based on the Bayes theorem and assumes the predictions are conditional independent given the class labels [29]. The Naïve Bayes algorithm estimates the densities of the predictors in each class and models the posterior probabilities based on the Bayes rule expressed as:
P(ci|A) =
P(A|ci).P(ci)
P(A) (5)
Whereci corresponds to a random variable in the class index. A is the total
evidence on attributes nodes where A can be grouped into smaller evidence say,a1, a2, . . . , anrelative to the featuresA1, A2, . . . , Anrespectively.
Since in Naïve Bayes network it is assumed the these features are independent (given the parent node), their combined probability is:
P(ci|A) =
P(a1|ci).P(a2|ci), . . . , P(an|ci).P(ci)
P(A) (6)
The algorithm makes use of the estimation of the posterior probability of each class to classify an observation and assigns the observation to the class with maximum posterior probability.
5 Experiments and Results Analysis
5.1 Results Evaluation Metrics
Table 3 Confusion Metrics
Target Output
Output Negative Positive
Predicted output Positive TP FP
Negative FN TN
Where, True Negative (TN): a measure of negative records correctly classified.
True Positive (TP): a measure of positive samples classified rightly.
False Positive (FP): a measure of negative records incorrectly classified as positive.
False Negative (FN): a measure of positive records incorrectly classified as negative.
Accuracy: This is the proportion of total number of records correctly classified correctly as positive or negative.
Accuracy (ACC) = T P +T N
T P +T N +F P +F N
Recall Rate: The proportion of the positive records classified correctly to the total number of the negative that are classified correctly positive or incorrectly as negative.
Recall Rate (Rc) = T P
T P +F N
False Positive Rate: It gives a measure of the proportion of negative records that are correctly classified
False Positive rate (FPR) = F P
F P +T N
Precision: The proportion of positive records correctly classified to the total number of records that are classified as positive.
Precision (Pr) = T P
T P +F P
F-Measure: This is the harmonic mean of precision and recall and gives a better indication performance of an unbalance dataset.
F-Measure (F1)= 2×Recall×P recision
5.2 Feature Selection Algorithm
This paper proposes correlation based feature selection (CFS) to select the relevant features out of the 28 features.
CFS is a filtering algorithm using a correlation based heuristic evaluation function to rank feature subsets. A good set of features are highly correlated with the class (target) and at the same time uncorrelated to each other. Redundant features are ignored because they have low correlation with class and will turn to highly correlated with one or more of the remaining features. A feature is accepted based on the extent it predicts classes in areas of the instance space which has not been predicted by other features.
Equation (7) shows the CFS feature subset evaluation function.
Ms= krcf
k+k(k−1)rf f (7)
WhereMs is heuristic “merit” of a feature subsetscontainingk features,rcf
is the average feature class correlation. The numerator can be thought of as giving an indication of how predictive a group of features are; the denominator of how much redundancy there is among the features [30].
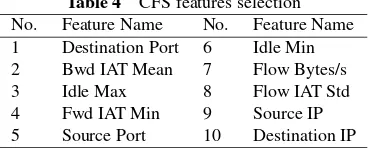
The CFS algorithm reduces the dimensionality of the dataset, reduces overfitting and gives a shorter training time. Table 4 shows the 10 selected features based on the appropriate correlation measure and heuristic search strategy.
5.3 Experiments
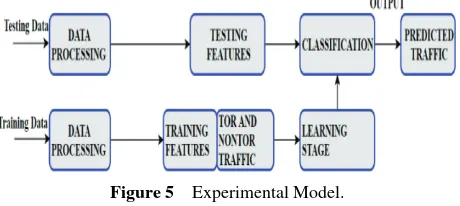
[image:12.612.206.391.574.648.2]To verify the performance of the proposed hybrid algorithm two scenarios, A and B is considered. In Scenario A, the focus was on detecting nonTor traffic and in Scenario B, the focus was to classify the generated flows in the TOR traffic. The experimental model involves two phases: the classification training phase and validation phase as shown in Figure 5. In the training phase, the algorithm learns the distribution of the features with corresponding classes.
Table 4 CFS features selection No. Feature Name No. Feature Name 1 Destination Port 6 Idle Min
2 Bwd IAT Mean 7 Flow Bytes/s
3 Idle Max 8 Flow IAT Std
4 Fwd IAT Min 9 Source IP
Figure 5 Experimental Model.
During the validation phase, the trained model is applied to a test set which has not been previously seen by the training phase.
Scenario A: The dataset was created by A. Lashkari et al. by merging Tor traffic dataset [7] and a public dataset of encrypted traffic generated by Draper-Gilet al. [31] which included the same application on the same network. The Tor traffic dataset flows were labelled Tor and all flows from Draper et al. [31] as nonTor. The experiment was performed by training ANN, ANN-CFS, SVM, SVM-CFS, NB and NB-CFS with UNB-CIC Tor and nonTor Network Traffic dataset to detect nonTor Traffic in a Tor network. The classification is a binary task where the output indicates the system’s certainty that the given observation is a nonTor or Tor. In the first set of experiment, the classifying algorithms were trained with all 28 features of the dataset. The ANN model used in the experiment had 20-hidden neurons and trained with Levenberg-Marquardt (trainlm) training function. The SVM model used in the experiment uses a Gaussian kernel. The Naïve Bayes model was a kernel density estimation which is a non-parametric density estimate for classification. In the second set of experiment the classification algorithms were trained with 10 features selected using CFS algorithm based on the appropriate correlation measure and heuristic search strategy. The ANN hidden neurons were reduced to 6 with Levenberg-Marquardt training function (trainlm) for learning. The SVM and Naïve Bayes models remained unchanged.
to compare the classification performance of the three hybrid classification algorithms as a multi class classifier. The classification is a multiclass classi-fication where a one-vs-All technique was implemented. The training model for SVM and NB classifying algorithms remained the same as in Scenario A. In the case of ANN-CFS the hidden neurons were increased to 10.
5.4 Results Analysis
In this section, an analysis of the validation process is discussed and presented in detail.
5.4.1 Scenario a results analysis
The performance of the classifiers on Scenario A dataset were evaluated and measured using the following metrics: False positive rate (FPR), Accuracy (ACC), Precision (Pc), Recall (Rc) and F-measure (F1). The dataset was divided into 70% training set, 15% test set and 15% validation set.
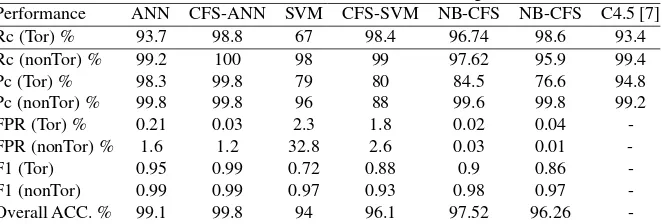
[image:14.612.134.465.531.643.2]Table 5. shows the classification performance metrics of the ANN, ANN-CFS, SVM, SVM-CFS, NB and NB-CFS classification algorithms in classifying Tor and nonTor traffic. The results show ANN-CFS presents the best results in all the performance metrics used to determine the classification performance of the classifying algorithms. It can be seen in Table 6. that NB-CFS shows an FPR of 0.01% for non-Tor detection as compared to ANN-CFS recording 1.2%. Also, NB shows 0.02% in the detection of Tor as compared to ANN-CFS recording 0.03% Regarding ANN-CFS FPR for detecting nonTor, 1.2% of its alarm associated with a true security event is an acceptable percentage for an efficient IDS under normal conditions. A. Lashkariet al. [7] proposed a hybrid C4.5 Decision tree algorithm in classify-ing Tor and non-Tor traffic usclassify-ing only the time based features of the dataset.
Table 5 Performance metrics of classification algorithms
Performance ANN CFS-ANN SVM CFS-SVM NB-CFS NB-CFS C4.5 [7]
Rc (Tor) % 93.7 98.8 67 98.4 96.74 98.6 93.4
Rc (nonTor)% 99.2 100 98 99 97.62 95.9 99.4
Pc (Tor) % 98.3 99.8 79 80 84.5 76.6 94.8
Pc (nonTor)% 99.8 99.8 96 88 99.6 99.8 99.2
FPR (Tor) % 0.21 0.03 2.3 1.8 0.02 0.04
-FPR (nonTor)% 1.6 1.2 32.8 2.6 0.03 0.01
-F1 (Tor) 0.95 0.99 0.72 0.88 0.9 0.86
-F1 (nonTor) 0.99 0.99 0.97 0.93 0.98 0.97
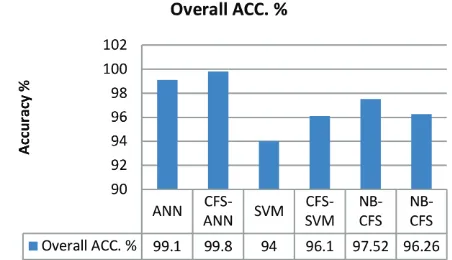
Figure 7 Comparison of Overall Accuracy classifying Tor and non-Tor traffic
Comparing the Precision and Recall results in [7] to CFS shows ANN-CFS recorded 99.8% and 98.8% respectively for the detection of Tor traffic whilst A. Lashkariet al.recorded 94.8% and 93.4% respectively. Regarding nonTor traffic, the proposed hybrid algorithm (ANN-CFS) recorded 99.8% and 100% respectively for Precision and Recall whilst A. Lashkariet al.recorded 99.2 and 99.4 respectively for Precision and recall. The best values in detection accuracy, Recall, Precision, F-measure, and overall accuracy with a low false positive rate in the classification of Tor and nonTor traffic recorded by CFS-ANN makes it a promising detection system for nonTor traffic. The reduction in dataset size is an important factor in the run time for detection by the classifying algorithm. Figures 6 and 7 show a comparison of the performance metrics of the classification algorithms.
5.4.2 Scenario B results analysis
In this section the performance of the proposed hybrid classification algo-rithm (ANN-CFS) is compared with SVM-ANN and NB–CFS classification algorithm to classify 8 different types of traffic in the Tor dataset. In this classification, we are being faced with a multi class problem involving a One vs All classification where one class is considered with the others taken as a single alternative class. The problem is then simplified to a binary classification task for each particular class. The results are presented as a weighted average of F-measure, Precision and Recall.
Figure 8 Weighted Average classification performance metrics.
Figure 8 shows the results of One vs All weighted average performance metrics for 8 different traffic in the Tor dataset using ANN-CFS, SVAN-CFS and NB-CFS classification algorithms. It can be observed that ANN-NB-CFS presents the best overall results. Considering that ANN-CFS records F1 of 0.84 and an overall accuracy of 89.4 as compared to the other classifiers indicate that the proposed algorithm can classify unbalanced dataset with high accuracy.
6 Conclusions
that it can deal with unbalanced and noisy datasets. Considering the good performance of the proposed algorithm, investigations will be performed in future to explore its capabilities on datasets from critical infrastructures.
Acknowledgments
The authors would like to thank the Canadian Institute of Cyber Security, University of Brunswick for providing us with the dataset to carry out this work.
References
[1] Ling, Z., Luo, J., Wu, K., Yu, W., and Fu, X. (2015). “TorWard: Discovery, Blocking, and Traceback of Malicious Traffic Over Tor,”IEEE Trans. Inf. Forensics Secur., 10:2515–2530.
[2] Ghafir, I., Prenosil, V., and Svoboda, J. (2014). “Tor-based malware and Tor connection detection,” in International Conference on Fron-tiers of Communications, Networks and Applications (ICFCNA 2014 – Malaysia).
[3] Doswell, S., Aslam, N., Kendall, D., and Sexton, G. (2013). “Please slow down!,” in Proceedings of the Third ACM workshop on Security and privacy in smartphones & mobile devices – SPSM ’13, 87–92.
[4] Diffie, W., and Hellman. (1976). “New directions in cryptography,”IEEE Trans. Inf. Theory, 22, 644–654.
[5] Dingledine, R., and Syverson, P. (2004). “Tor: The Second-Generation Onion Router.” Naval Research Lab Washington DC.
[6] Saputra, F. A., Nadhori, I. U., and Barry, B. F. (2016). “Detecting and blocking onion router traffic using deep packet inspection,” in 2016 International Electronics Symposium (IES), 283–288.
[7] Lashkari, A. H., Gil, G. D., Mamun, M. S. I., and Ghorbani, A. A. (2017). “Characterization of Tor Traffic using Time based Features,” 253–262. [8] Nguyen, T., and Armitage, G. (2008). “A survey of techniques for
internet traffic classification using machine learning,” IEEE Commun. Surv. Tutorials, 10, 56–76.
[9] Hill, G. D., and Bellekens, X. J. A. (2017). “Deep Learning Based Cryp-tographic Primitive Classification,” arXiv preprint arXiv:1709.08385. [10] Ishitaki, T., Oda, T., Matsuo, K., Barolli, L., and Takizawa, M. (2015).
System for Tor Networks Considering different Hidden Units,” in2015 18th International Conference on Network-Based Information Systems, 620–627.
[11] Roesch and Martin. (1999). “Snort – Lightweight Intrusion Detection for Networks,” in Proceedings of the 13th USENIX conference on System administration, 229–238.
[12] Subba, B., Biswas, S., and Karmakar, S. (2012). “A Neural Network based system for Intrusion Detection and attack classification,” in2016 Twenty Second National Conference on Communication (NCC), 1–6. [13] Haidar, G. A., and Boustany, C. (2015). “High Perception Intrusion
Detection System Using Neural Networks,” in2015 Ninth International Conference on Complex, Intelligent, and Software Intensive Systems, 497–501.
[14] Bellekens, X. J. A., Tachtatzis, C., Atkinson, R. C., Renfrew, C., and Kirkham, T. (2014). “A Highly-Efficient Memory-Compression Scheme for GPU-Accelerated Intrusion Detection Systems,”Proc. 7th Int. Conf. Secur. Inf. Networks – SIN ’14, 302–309.
[15] Mittal, N. K. (2016). “A survey on Wireless Sensor Network for Commu-nity Intrusion Detection Systems,” in2016 3rd International Conference on Recent Advances in Information Technology (RAIT), 107–111. [16] Shun, J., and Malki, H. A. (2008). “Network Intrusion Detection System
Using Neural Networks,” 2008 Fourth Int. Conf. Nat. Comput., 5, 242–246.
[17] Hodo, E., Bellekens, X., Hamilton, A., Dubouilh, P.-L., Iorkyase, E., Tachtatzis, C., and Atkinson, R. (2016). “Threat analysis of IoT networks using artificial neural network intrusion detection system,” in 2016 International Symposium on Networks, Computers and Communications, ISNCC 2016, 1–6.
[18] Biglar Beigi, E., Hadian Jazi, H., Stakhanova, N., and Ghorbani, A. A. (2014). “Towards effective feature selection in machine learning-based botnet detection approaches,” in 2014 IEEE Conference on Communications and Network Security, 247–255.
[19] Rozenblum, D. (2001). “Understanding Intrusion Detection Systems,” PC Network Advisor,122, 11–15.
[21] Sekar, R., Guang, Y., Verma, S., and Shanbhag, T. (1999). “What it is Network intrusion detection system? | COMBOFIX.” [Online]. Available at: http://www.combofix.org/what-it-is-network-intrusion-detection-system.php [Accessed: 10-Dec-2015].
[22] “Tor-nonTor | Datasets | Research | Canadian Institute for Cybersecurity | UNB.” [Online]. Available at: http://www.unb.ca/cic/research/datasets/ tor.html [Accessed: 18-Apr-2017].
[23] Murphy K. (2015). “Machine learning: a probabilistic perspec-tive,” Chance encounters: Probability in . . .,. [Online]. Avail-able at: http://link.springer.com/chapter/10.1007/978-94-011-3532-0 2 [Accessed: 06-Jan-2015].
[24] Alsheikh, M. A., Lin, S., Niyato, D., and Tan, H.-P. (2014). “Machine Learning in Wireless Sensor Networks: Algorithms, Strategies, and Applications,”IEEE Commun. Surv. Tutorials, 16, 1996–2018.
[25] Burges, C. J. C. (1998). “A Tutorial on Support Vector Machines for Pattern Recognition,”Data Min. Knowl. Discov., 2, 121–167.
[26] Hu, W., Liao, Y., and Vemuri, V. R. (2003). “Robust Support Vector Machines for Anomaly Detection in Computer Security.” InICMLA. [27] Jemili, F., Zaghdoud, M., and Ben Ahmed, M. (2009). “Intrusion
detec-tion based on ‘Hybrid’ propagadetec-tion in Bayesian Networks,” in 2009 IEEE International Conference on Intelligence and Security Informatics, 137–142.
[28] Jensen, T. D., Jensen, F. V., and Nielsen. (2001). “Bayesian networks and decision graphs,”Springer, Berlin.
[29] Amor, N. B., Benferhat, S., and Elouedi, Z. (2003). Naive bayesian networks in intrusion detection systems. In Proc. Workshop on Proba-bilistic Graphical Models for Classification, 14th European Conference on Machine Learning (ECML) and the 7th European Conference on Principles and Practice of Knowledge Discovery in Databases (PKDD), Croatia.
[30] Hall, M. A. (1999). “Correlation-based Feature Selection for Machine Learning,”. Available at: https://www.lri.fr/∼pierres/donn%E9es/save/ these/articles/lpr-queue/hall99correlationbased.pdf
Biographies
Elike Hodois a Ph.D. student in the Department of Electronics and Electrical Engineering at the University of Strathclyde, Glasgow UK since October 2014. He attended the Deggendorf University of Applied Sciences, Germany where he received his M.Eng. in Electrical Engineering and Information technology in 2007.
His Ph.D. work centres on application of Machine Learning algorithms in cyber security.
Ephraim Iorkyasereceived the B.Eng. in Electrical and Electronic Engi-neering and the M.Eng. in Communication EngiEngi-neering from University of Agriculture Makurdi, Nigeria (2004) and Federal University of Akure, Nigeria (2010) respectively. He is currently pursuing his Ph.D. at the department of Electronic and Electrical Engineering, University of Strathclyde, Glasgow, U.K. His main research interests include application of machine learning techniques in radio location of partial discharge, condition monitoring, intrusion detection and classification, signal processing, fault location and communication applications.
Christos Tachtatzisis a Lecturer Chancellor’s Fellow in Sensor Systems and Asset Management, at the University of Strathclyde. He holds a BEng (Hons) in Communication Systems Engineering from University of Portsmouth in 2001, an MSc in Communications, Control and Digital Signal Processing (2002) and a Ph.D. in Electronic and Electrical Engineering (2008), both from Strathclyde University. Christos has 12 years of experience, in Sensor Systems ranging from electronic devices, networking, communications and signal processing. His current research interests lie in extracting actionable information from data using machine learning and artificial intelligence.