City, University of London Institutional Repository
Citation:
Bozzani, F. M., Alavi, Y., Jofre-Bonet, M. ORCID: 0000-0002-2055-2166 and
Kuper, H. (2012). A comparison of the sensitivity of EQ-5D, SF-6D and TTO utility values to
changes in vision and perceived visual function in patients with primary open-angle
glaucoma. BMC Ophthalmology, 12, 43.. doi: 10.1186/1471-2415-12-43
This is the published version of the paper.
This version of the publication may differ from the final published
version.
Permanent repository link:
http://openaccess.city.ac.uk/20699/
Link to published version:
http://dx.doi.org/10.1186/1471-2415-12-43
Copyright and reuse: City Research Online aims to make research
outputs of City, University of London available to a wider audience.
Copyright and Moral Rights remain with the author(s) and/or copyright
holders. URLs from City Research Online may be freely distributed and
linked to.
R E S E A R C H A R T I C L E
Open Access
A comparison of the sensitivity of EQ-5D, SF-6D
and TTO utility values to changes in vision and
perceived visual function in patients with primary
open-angle glaucoma
Fiammetta Maria Bozzani
1*, Yasmene Alavi
1, Mireia Jofre-Bonet
2and Hannah Kuper
1Abstract
Background:Economic viability of treatments for primary open-angle glaucoma (POAG) should be assessed objectively to prioritise health care interventions. This study aims to identify the methods for eliciting utility values (UVs) most sensitive to differences in visual field and visual functioning in patients with POAG. As a secondary objective, the dimensions of generic health-related and vision-related quality of life most affected by progressive vision loss will be identified.
Methods:A total of 132 POAG patients were recruited. Three sets of utility values (EuroQoL EQ-5D, Short Form SF-6D, Time Trade Off) and a measure of perceived visual functioning from the National Eye Institute Visual Function Questionnaire (VFQ-25) were elicited during face-to-face interviews. The sensitivity of UVs to differences in the binocular visual field, visual acuity and visual functioning measures was analysed using non-parametric statistical methods.
Results:Median utilities were similar across Integrated Visual Field score quartiles for EQ-5D (P = 0.08) whereas SF-6D and Time-Trade-Off UVs significantly decreased (p = 0.01 and p = 0.001, respectively). The VFQ-25 score varied across Integrated Visual Field and binocular visual acuity groups and was associated with all three UVs (P≤0.001); most of its vision-specific sub-scales were associated with the vision markers. The most affected dimension was driving. A relationship with vision markers was found for the physical component of SF-36 and not for any dimension of EQ-5D.
Conclusions:The Time-Trade-Off was more sensitive than EQ-5D and SF-6D to changes in vision and visual functioning associated with glaucoma progression but could not measure quality of life changes in the mildest disease stages.
Keywords:Glaucoma, Quality of life, Utility values, Cost-utility analysis
Background
Glaucoma is the second leading cause of blindness worldwide, representing 12.3% of the global burden [1]. Primary open-angle glaucoma (POAG) is the most wide-spread form among Western populations; if untreated, this chronic degenerative optic neuropathy induces pro-gressive and irreversible loss of peripheral visual field
(VF) with tunnel vision and, eventually, blindness. POAG prevalence is 2% among adults (>40 yrs) in high-income countries and is predicted to rise with popula-tion ageing, in turn expanding demand for therapies [2]. As health care resources become constrained, the im-portance of evaluating the economic viability of different treatment options is increasing [3].
Interventions should be compared through cost-utility analysis based on Quality-Adjusted Life-Years (QALYs), a common metric of benefit whose components are life expectancy and Utility Values (UVs) [4]. The latter is a
* Correspondence:[email protected]
1
London School of Hygiene and Tropical Medicine, Keppel Street, WC1E 7HT, London, UK
Full list of author information is available at the end of the article
preference-based measure of the quality of life (QOL) associated with different health states, ranging between 0 (death) and 1 (perfect health) [3,5]. Accurate estimates of changes in UVs for progressive stages of visual field loss (VFL) are needed to calculate QALYs gained from glaucoma interventions [6]. Elicitation methods should therefore detect genuine changes in QOL from the very early stages of POAG and beyond. These changes are defined as the minimally important difference in score (i.e. the smallest difference perceived by patients as beneficial), which would call for implementing the intervention in the absence of side effects and excessive cost [7].
Different methods for measuring UVs in POAG patients, including both direct and indirect utility elicit-ation, have been described in the literature, showing various strenghts of association with VFL [6,8-13]. High frequencies of ceiling effects, which can lead to under-estimating QOL changes, have been reported for UV instruments among these studies [14]. In addition, the insensitivity of standard UV elicitation methods, such as the EuroQoL EQ-5D advocated by the National Institute for Health and Clinical Excellence for use in economic evaluations, has been criticised among ophthalmic and non-ophthalmic populations [15,16]. To date, few eco-nomic evaluations on glaucoma interventions have been conducted, with a recent systematic review calling for more research in light of the scarcity and poor quality of existing economic evidence compared to the wealth of new technologies to assess [17]. Similarly, there have been limited investigations directly comparing the sensi-tivity of different UV elicitation methods in POAG re-search [12,18].
As for the aspects of daily living affected by POAG, few studies currently describe stage-by-stage losses in different QOL dimensions [6,8,19]. However, a consider-able body of evidence gathered using the National Eye Institute Visual Function Questionnaire (VFQ-25) indi-cates that QOL decreases from the early stages of visual field deterioration, with the most affected areas being driving and outdoor mobility [6]. Concerns with activ-ities requiring near vision only emerge when field dam-age is severe enough to affect binocular central acuity [20,21].
Thus, UVs used in cost-utility analysis for POAG should be sensitive to QOL changes associated with dis-ease progression, yet there is limited evidence on which UV elicitation methods are most sensitive to these changes. The study objective is to identify among 3 widely used methods (EQ-5D, Short Form SF-6D, Time-Trade-Off ) the one most sensitive to changes in both binocular VFL and visual functioning (measured using the VFQ-25). In particular, the following psychometric properties of the elicitation methods will be assessed:
known-group differences (ability to discriminate among patients on different levels of condition severity) and convergent validity (extent to which the UVs correlate with the visual functioning score) [22].
Methods
This paper is part of a wider study on QOL in glaucoma patients. It follows an article recently published by Alavi et al. (2011), aimed at developing an algorithm to calcu-late UVs for POAG patients based on a combination of visual acuity (VA), visual field and contrast sensitivity tests [23]. Full details of study methods are published in Alavi et al. (2011). Ethics approval was granted by Moor-fields and Whittington Local Research Ethics Committee and the London School of Hygiene & Tropical Medicine Ethics Committee.
Design and sample
A sample of outpatients with POAG in one or both eyes was recruited from Moorfields Eye Hospital (MEH, London, UK). After identification through clinical records, those who consented to participate undertook questionnaires and visual tests at MEH on the day their next scheduled consultation occurred.
For eligibility, patients had to be at least 18 years old, English-speaking and free from conditions preventing reliable visual testing and interviewing. Exclusion criteria were eye surgery in the preceding 6 weeks and any ocu-lar co-morbidities contributing to loss of vision.
Clinical measures of visual function
Binocular measures of VF were selected as more rele-vant to perceived visual ability. Integrated Visual Field (IVF) scores were used to measure binocular VF as they are derived from routine monocular VF threshold tests and have been demonstrated to predict self-reported visual disabilities better than the Esterman test [24]. Monocular Humphrey 24–2 full threshold tests were performed in both eyes (Humphrey Field Analyzer II, model 730; Humphrey Instruments, Dublin, CA, USA). The maximum sensitivity (dB) recorded between the 52 overlapping points of the right and left monocular fields was used to generate a 52-point integrated (binocular) VF. Points were then scored (<10 dB = 2; 10-19 dB = 1;
≥20 dB = 0) and values summed up to obtain individual IVF scores ranging from 0 (>20 dB in all 52 points) to 104 (<10 dB in all 52 points), respectively the best and worst binocular VF [24]. Only scores obtained through a reliable VF test, as defined by published criteria, were included in the analysis [25]. IVF scores were based on the monocular VF for participants with (1) no perception of light (NPL) in one eye, or (2) severe visual loss (mean deviation≤ −25 dB) in one eye in their most recent test, and whose eyesight had deteriorated to the extent that
Bozzaniet al. BMC Ophthalmology2012,12:43 Page 2 of 9
their VF was unobtainable in that eye. An IVF score of 104 was designated to those participants who had NPL/ severe visual loss in both eyes, such that a reliable VF was unobtainable from either eye. Lacking a universally recognised glaucoma staging system, IVF quartiles were used as a measure of VFL severity.
Visual acuity, both monocular and binocular (VAB),
was assessed under standardised conditions using a back-illuminated ETDRS logMAR chart (Lighthouse International, New York, NY) read with the aid of the participants’habitual distance glasses at 4 meters, or 2/1 metres if the letters on the top line could not easily be read at 4/2 metres, respectively. Patients unable to see letters at 1 metre were assigned a value of 1.85 logMAR, (counting fingers), or 2.3 logMAR (vision of hand move-ments or less) [26].
Interviews and UV/perceived visual function measurement
Questionnaires and visual tests were administered by the same researcher (YA) at MEH. Information was col-lected on age, glaucoma diagnosis, gender, ethnicity, education, marital status, living arrangements, use of topical medication, previous glaucoma surgical or laser interventions and time since diagnosis. A depression screener was also administered [27]. Socio-economic sta-tus was recorded using the occupational-based UK five-class National Statistics Socio-Economic Classification System [28]. A trained counsellor was available to parti-cipants upset by any part of the interview.
Utility measures: The present analysis employs 3 elicit-ation methods. Two are multi-attribute utility classifica-tion systems providing preferences associated with generic health states (EQ-5D, SF-6D), while the Time-Trade-Off (TTO) directly elicits preferences associated with current visual state. The EQ-5D consists of five questions on mobility, self-care, usual activities, pain/ discomfort and anxiety/depression, that can take one of three responses representing different levels of problems (none/moderate/extreme). Individual sets of answers are scored according to the health state they represent and converted to UVs [29]. The Medical Outcomes Study Short Form Questionnaire (SF-36) contains 36 items assessing 8 domains of daily living on a 0–100 scale, yielding the norm-based physical and mental component summary scores [30,31]. Six of the 8 dimensions can be used to generate UVs (SF-6D) [32]. A two-part TTO question widely used in ophthalmic research with demonstrated validity and test-retest reliability was ap-plied in this study [33-38]. Participants were first asked how many more years they expected to live (Y), and then to quantify how many of those years–if any- they were willing to trade for perfect vision. The UVs were calculated from the maximum number of years that the
person was willing to trade (Z) as follows: UV = (Y−Z)/ Y. Thus, the method elicits stated (rather than revealed) preferences.
Perceived visual function measure: VFQ-25 comprises 25 questions used to calculate 12 sub-scales (one assessing general health and the remainder targeting vision-specific functioning) and one composite score between 0 and 100 [39]. Lower scores indicate lower quality of life.
Data analysis
Data were double-entered on an Access-based database, checked using EpiInfo™Data Compare and analysed with STATA v.11 (StataCorp LP, College Station, TX, USA). As the main vision and QOL measures were not nor-mally distributed, even after log transformation, a pre-liminary investigation of the statistical association between variables was performed using non-parametric Spearman’s rank correlation coefficient. Differences between the three sets of UVs were tested with the Wilcoxon signed-rank test. Next, the distribution of median UVs and QOL scores across IVF quartiles was analysed graphically. Associations between (1) the vision markers (IVF and VAB) and the UVs and (2) the vision
markers and the VFQ-25 composite score were tested using the Kruskal-Wallis test, a non-parametric equi-valent of ANOVA. Individual socio-demographic and clinical characteristics were considered as potential con-founders. As nonparametric tests do not allow to control for confounding, their associations with the vision mar-kers, the UVs and the VFQ-25 score were independently tested. Individual sub-scales from EQ-5D, SF-36 and VFQ-25 were analysed graphically and using Spearman’s correlation coefficients to assess which dimensions of generic and vision-specific QOL were most affected by glaucoma-induced VFL.
Results
The characteristics of the 132 patients recruited are summarised in Table 1. Most patients (65%) had been diagnosed with glaucoma over 10 years prior to the study and nearly 70% had not undergone surgery. The full range of IVF scores was represented, although their distribution was skewed towards mild/moderate VFL (median = 29, IQR: 7.5 - 58, range: 0 – 104). The IVF quartiles were: 0–7 (Q1), 8–29 (Q2), 30–59 (Q3), 60– 104 (Q4). The VABof most patients was within the
confounder (Kruskal-Wallis P = 0.20 for EQ-5D; P = 0.08 for SF-6D; P = 0.48 for TTO).
Table 2 provides a summary of VFQ-25 composite scores and UVs derived from EQ-5D, SF-6D and TTO. Their frequency distributions were heavily skewed to-wards higher values, especially for TTO, whereby 79/123 respondents reported UV = 1. The three questionnaires
yielded significantly different UVs (P≤0.001 for all tests), those from TTO being the highest. Less than 1% of all items were missing for both EQ-5D and SF-6D. Utilities could not be assigned to patients who did not answer one or more questions used in the calculation algorithm (n = 6). As for TTO, a common reason for refusal was inability to consider the question independently from re-ligious beliefs (cited in 4/9 cases).
Stage-dependent changes in visual functioning and QOL The VFQ-25 composite score correlated well with IVF (r =−0.67) and VAB(r =−0.71), and its median declined
across IVF and VAB quartiles (Figure 1; Kruskal-Wallis
P < 0.001). There was strong evidence of a relationship between VFL and every VFQ-25 sub-scale (all P < 0.001), except for general health (P = 0.10) and ocular pain (P = 0.16). The same associations were found for VAB
(P < 0.001 for all tests but general health and ocular pain, both P = 0.35). The graphical comparison shows different patterns of change for different dimensions of visual functioning. The driving and peripheral vision sub-scales displayed the largest declines even among patients in the early stages of POAG, with the median score for driving ability equal to 0 in the 3rdand 4thquartiles. Apart from general health and ocular pain, which did not vary, all sub-scales displayed large differences in median scores only in the 4thIVF quartile compared to the others.
Only the SF-36 sub-scales related to its physical com-ponent were associated with VFL and VAB, (P = 0.03 and
P = 0.01, respectively; P = 0.4 and P = 0.92 for the psycho-logical component). No EQ-5D dimension was asso-ciated with VFL or VAB, except for ‘usual activities’
(P = 0.001).
Sensitivity of UVs to differences in visual field
Table 3 reports the correlation coefficients between the vision markers and the UVs. The TTO preferences for visual states correlated much better with IVF and VAB
[image:5.595.56.287.112.590.2]than preferences for generic health states. None of the
Table 1 Socio-demographic and clinical characteristics of patients with POAG (n = 132)
N Mean (SD) or % Range
Socio-demographic
Gender
Female (%) 61 46.2% Male (%) 71 53.8% -Age, mean (SD) 132 71.8 (11.0) 27.6 - 93.5 Living conditions
Living alone (%) 49 37.1% -Not living alone (%) 83 62.9% Employment
Currently employed (%) 27 20.5% -Retired (%) 105 79.5%
Clinical
Years since POAG diagnosis, mean (SD)
128 14.3 (8.9) 0.28 - 40.6 Type of glaucoma*
High tension 115 87.1% -Normal Tension 17 12.9% Currently using
eye-drops (%)
Yes 122 92.4% -No 10 7.6% Failed depression
screener (%)
Yes 10 7.6% -No 122 92.4%
Visual
IVF , mean (SD)** 124 33.6 (37.6) 0 - 104 Better-seeing eye VA
(logMAR), mean (SD)
132 0.3 (0.4) −0.2 - 2.3 VAB(logMAR),mean (SD) 132 0.2 (0.4) −0.18 - 1.85
Best-eye mean deviation, mean (SD)
101 −11.5 (8.2) −29.6–1.10 Worse-eye mean deviation,
mean (SD)
122 −18.9 (8.2) −31.9–0.4
* High and normal tension glaucoma defined on the basis of intraocular pressure (normal: 10–21 mm Hg; high: >21 mm Hg).
**Higher values represent increasing visual field loss. 8 patients were unable to score a reliable VF test due to low vision (n = 124/132).
[image:5.595.304.539.596.673.2]IVF = integrated visual field score. VAB= binocular visual acuity.
Table 2 Summary of utility values and VFQ-25 scores
N Mean (SD)
Median (IQR) Observed range
Possible range*
EQ-5D 131 0.8 (0.2) 0.8 (0.7 - 1.0) −0.1 - 1.0 −0.6–1.0
SF-6D 126 0.7 (0.1) 0.7 (0.6 - 0.9) 0.4 - 0.9 0.3–1.0
TTO 123 0.9 (0.2) 1.0 (0.8 - 1.0) 0.2 - 1.0 0–1.0
VFQ-25 132 72.9 (22.1) 81.1 (57.8 - 91.6) 17.1 - 99.4 0–100
* Higher values indicate better health.
EQ-5D = UVs derived using EuroQoL Index tool. UK population norms (n = 1763) by age group are the following, mean (SD) 45–54: 0.85 (0.25); 55–64: 0.80 (0.26); 65–74: 0.78 (0.26); 75+: 0.73 (0.27) [52].
SF-6D = UVs derived from SF-36 using SF-6D algorithm [53]. TTO = time trade-off utility value.
VFQ-25 = 25-item national eye institute visual function questionnaire.
Bozzaniet al. BMC Ophthalmology2012,12:43 Page 4 of 9
UVs correlated as strongly with vision markers as the VFQ-25 composite score.
Figure 2 shows a declining trend in UVs from SF-6D and TTO for increasing VFL, with patients in the 4th quartile showing lower median UVs than those in the first; the significant difference (P = 0.01 and p = 0.001, re-spectively) was mainly driven by the lower utilities
reported by patients in the 4thVFL quartile. Median UVs from EQ-5D did not vary (P = 0.08) nor were signifi-cantly different from population norms (Table 2). The comparison of median UVs across VAB quartiles also
showed an association with SF-6D (P = 0.02) and TTO (P < 0.001) but not EQ-5D (P = 0.17).
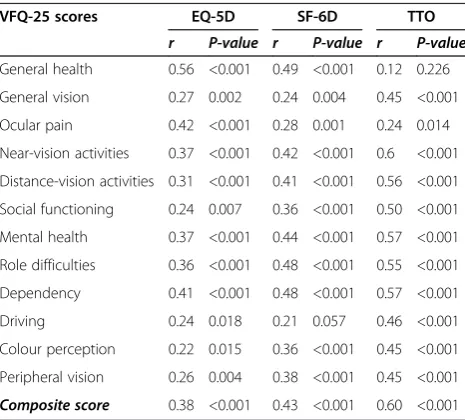
Sensitivity of UVs to changes in visual functioning As shown in Table 4, Spearman’s rank correlation coeffi-cients indicate statistical dependence between the VFQ-25 composite score and the UVs from EQ-5D, SF-6D and, in particular, TTO.
[image:6.595.55.543.88.434.2] [image:6.595.56.291.610.691.2]All the individual VFQ-25 dimensions correlated well with TTO (r≥0.50 and P < 0.001 for all tests) except for general health and ocular pain. Correlations were instead weak between UVs from EQ-5D and SF-6D and all sub-scales other than general health. In fact, TTO was sensi-tive to changes in the largest number of vision-specific sub-scales, capturing up to 25% more of the impact of vision loss on functionality dimensions such as driving and social functioning (in terms of the difference Figure 1Median (IQR) VFQ-25 composite and subscales scores by IVF quartile.
Table 3 Spearman’s rank correlation coefficients and significance levels between VA, IVF and responses to QOL questionnaires
IVF VAB
r P-value r P-value
EQ-5D −0.25 0.003 −0.19 0.03 SF-6D −0.29 0.001 −0.22 0.01 TTO −0.47 <0.001 −0.48 <0.001 VFQ-25 −0.67 <0.001 −0.71 <0.001
IVF = integrated visual field score. VAB= binocular visual acuity.
EQ-5D = UVs derived using EuroQoL Index tool.
between correlation coefficients) compared to EQ-5D and SF-6D.
Discussion
Although official guidelines on QALY estimates recom-mend generic health-state valuations that reflect the pre-ferences of the general population to improve the comparability and generalisability of results, such valua-tions may not detect changes in health status for some
[image:7.595.59.540.89.300.2]conditions [40]. The low sensitivity of generic instruments can be attributed to the irrelevance of some of their ques-tions to vision-related QOL. For instance, EQ-5D asks about problems with mobility but these may not occur until the very last stages of POAG, if at all. Moreover, the three response options might not detect QOL changes of a smaller magnitude. To address issues of poor sensitivity and ceiling effects displayed by the original instrument, a 5-level version of EQ-5D was recently introduced, thus potentially improving its performance at the milder end of visual function loss [22,41]. Similar conclusions can be drawn about the performance of SF-6D: it detects a min-imally important difference in QOL, perceived by patients as beneficial, that is different in absolute terms but pro-portionally equivalent to that of EQ-5D [42]. Genuine dif-ferences of a smaller magnitude are therefore undetected by both instruments. Lack of specificity may compound the problem as, for instance, generic measures may not reflect glaucoma patients’preference concerning both dis-ease symptoms and avoidance of treatment side-effects. Our findings on EQ-5D are in line with existing literature showing no significant association between EQ-5D scales and glaucoma severity [19,43]. Results in other chronic conditions, ophthalmic and non- (including macular de-generation, rheumatoid arthritis and asthma), indicate that EQ-5D has limited disease-specific sensitivity [44-46]. A complementary explanation has to do with the fact that the frequency and intensity of negative thoughts has an impact on responses to QOL questionnaires [47]. In this sense, since generic tools do not require patients to focus on the state of their vision, existing problems with vision-related functioning might not be captured in their score.
Figure 2Median (IQR) of EQ-5D, SF-36 and TTO UVs by IVF quartile.Q-5D = UVs derived using EuroQoL tool. SF-6D = UVs derived from SF-36 using SF-6D algorithm [53]. TTO = time trade-off utility value.
Table 4 Spearman’s rank correlation coefficients and significance levels between utility values and VFQ-25 scores
VFQ-25 scores EQ-5D SF-6D TTO
r P-value r P-value r P-value
General health 0.56 <0.001 0.49 <0.001 0.12 0.226 General vision 0.27 0.002 0.24 0.004 0.45 <0.001 Ocular pain 0.42 <0.001 0.28 0.001 0.24 0.014 Near-vision activities 0.37 <0.001 0.42 <0.001 0.6 <0.001 Distance-vision activities 0.31 <0.001 0.41 <0.001 0.56 <0.001 Social functioning 0.24 0.007 0.36 <0.001 0.50 <0.001 Mental health 0.37 <0.001 0.44 <0.001 0.57 <0.001 Role difficulties 0.36 <0.001 0.48 <0.001 0.55 <0.001 Dependency 0.41 <0.001 0.48 <0.001 0.57 <0.001 Driving 0.24 0.018 0.21 0.057 0.46 <0.001 Colour perception 0.22 0.015 0.36 <0.001 0.45 <0.001 Peripheral vision 0.26 0.004 0.38 <0.001 0.45 <0.001
Composite score 0.38 <0.001 0.43 <0.001 0.60 <0.001
EQ-5D = UVs derived using EuroQoL Index tool.
SF-6D = UVs derived from SF-36 using SF-6D algorithm [53]. TTO = time trade-off utility value.
VFQ-25 = 25-item national eye institute visual function questionnaire.
Bozzaniet al. BMC Ophthalmology2012,12:43 Page 6 of 9
[image:7.595.57.290.489.699.2]The higher sensitivity to glaucoma-induced QOL changes of the TTO adapted to vision is consistent with the question being specific to vision, and has also been documented by Aspinall et al.. (2008), who observed de-clining TTO utilities with increasing severity while EQ-5D remained unaffected [8]. However, TTO has high ceiling effects and does not decrease with deteriorating vision and visual functioning in the earlier stages of dis-ease (median UV = 1 for first 3 quartiles): preferences may indeed not change until end-stage POAG, as patients adapt to gradual peripheral vision loss, or the elicitation methods may be inadequate. Ceiling effects for generic utility scales are widely reported for ophthal-mic conditions and in general population surveys [48,49]. The high documented percentage of zero-traders with TTO (UV = 1) may be explained with a
‘threshold of tolerability’ that should be reached before patients are willing to sacrifice even a few days [50]. Similar findings with Standard Gamble utilities confirm that glaucoma patients are willing to accept lower risks in return for perfect health (UVs closer to 1) than patients with other eye conditions such as refractive error or diabetic retinopathy [51]. For the same patients, utilities did decline once the anchor points were shifted from death and perfect health to blindness and perfect vision but the discrepancy between the two sets of UVs remained largest with increasing disease severity [51]. EQ-5D was also appears to lack sensitivity to mild con-ditions and small changes in health status [4].
Willingness to trade time was found predominantly among patients with severe glaucoma, characterised by poorer central VA; however, central VA might not de-teriorate until later stages of POAG, leaving VFL as the main determinant of early QOL changes. VFL affects a selected number of functionality dimensions that might not be encompassed within generic utility elicitation methods: some of the reported associations between functional ability and VFL were weaker than those with VA [11]. Here, instead, all the associations found for VAB and IVF were matched, thus confirming the
rele-vance of these findings for glaucoma patients, whose vision loss is mainly peripheral. In line with existing literature, we found that the VFQ-25 subscales showing the lowest scores in POAG are driving, peripheral vision and activities involving both near and distant vision [20,21].
Our study has some limitations. Firstly, there are significant differences in the TTO, EQ-5D and SF-6D methods which limit their comparability. The TTO does not value health states worse than death, and is anchored differently (perfect vision/death) to the EQ-5D and SF-6D (perfect health/death). Since the implementation of this study, a debate has arisen as to whether utilities anchored at perfect vision/death are measuring the
same construct as those anchored at perfect health/ death, and therefore whether they are appropriate for calculating QALYs used in cost-utility analyses [51]. Secondly, the use of non-parametric statistical methods implies that patients’circumstances, which might influ-ence individual perceptions of sight loss as a disability, were not controlled for. However, univariable analyses showed that none of the socio-demographic and clinical characteristics were likely to confound the observed associations. Furthermore, recruitment from one single London-based hospital potentially limits the generalis-ability of findings. Finally, comparisons with other studies are hindered by the lack of an agreed system of glaucoma staging.
Conclusions
This study demonstrates that POAG reduces visual func-tioning (VFL, VA) and vision-related QOL (VFQ-25 scores), affecting the 3 UVs to different extents: those from TTO were the most sensitive, followed by SF-6D and then EQ-5D, which was mostly unaffected. In gen-eral, TTO utilities were highest in value and had the strongest relationship with IVF, VAB (known-group
dif-ferences) and the VFQ-25 composite score (convergent validity), implying higher overall sensitivity to glaucoma-induced QOL changes.
Abbreviations
POAG: Primary open-angle glaucoma; VF: Visual field; QALY: Quality-adjusted life years; UV: Utility value; QOL: Quality of life; VFL: Visual field loss; NICE: National institute for clinical excellence; VFQ-25: National Eye Institute 25-item visual function questionnaire; EQ-5D: EuroQoL quality of life scale; TTO: Time trade-off; SF-36: Medical outcomes study 36-item short form; SF-6D: 6-dimensions utility classification system for SF-36; VAB: Binocular
visual acuity; IVF: Integrated visual field; MEH: Moorfields Eye Hospital; IQR: Inter-quartile range; CI: Confidence interval; ANOVA: Analysis of variance; SD: Standard deviation.
Competing interests
This study was supported by an Investigator Initiated Research grant from Pfizer Inc., New York Headquarters (2005–0570).
Authors’contributions
FB performed the statistical analysis and drafted the manuscript. The study was conceived by YA, who carried out data collection and helped with drafting the manuscript. MJB collaborated with the study design and implementation. HK assisted with data analysis and provided feedback on successive drafts. All authors read and approved the final manuscript.
Acknowledgments
The authors wish to thank all participants that took part in the study and members of the Glaucoma Research Unit and the Research & Development department at Moorfields Eye Hospital, for their supervision and support during data collection.
Author details
1
London School of Hygiene and Tropical Medicine, Keppel Street, WC1E 7HT, London, UK.2City University, Economics, London, UK.
Received: 28 February 2012 Accepted: 25 July 2012 Published: 21 August 2012
References
1. Resnikoff S, Pascolini D, Etya'ale D,et al:Global data on visual impairment in the year 2002.Bulletin of the World Health Organ2004,
82:844–851.
2. Quigley HA, Broman AT:The number of people with glaucoma worldwide in 2010 and 2020.Br J Ophthalmol2006,90:262–267.
3. Kuper H, Jofre-Bonet M, Gilbert C:Economic evaluation for ophtalmologists.Ophtalmic Epidemiol2006,13:393–401.
4. Brazier J, Deverill M, Green C,et al:A review of the use of health status measures in economic evaluation.Health Technol Assess1999,3(9). 5. Kymes SM:An introduction to decision analysis in the economic
evaluation of the prevention and treatment of vision-related disease.
Ophtalmic Epidemiol2008,15:76–83.
6. McKean-Cowdin R, Varma R, Wu J,et al:Severity of visual field loss and health-related quality of life.Am J Ophthalmol2007,143:1013–1023. 7. Jaeschke R, Singer J, Guyatt GH:Measurement of health status.
Ascertaining the minimal clinically important difference.Contr Clin Trials 1989,10:407–415.
8. Aspinall PA, Johnson ZK, Azuara-Blanco A,et al:Evaluation of quality of life and priorities of patients with glaucoma.Invest Ophthalmol Vis Sci2008,
49:1907–1915.
9. Broman AT, Munoz B, Rodriguez J,et al:The impact of visual impairment and eye disease on vision-related quality of life in a Mexican-American population: proyecto VER.Invest Ophtalmol Vis Sci2002,43:3393–3398. 10. Evans K, Law SK, Walt J,et al:The quality of life impact of peripheral
versus central vision loss with a focus on glaucoma versus age-related macular degeneration.Clin Ophtalmol2009,3:433–445.
11. Gupta V, Srinivasan G, Mei SS,et al:Utility values among glaucoma patients: an impact on the quality of life.Br J Ophthalmol2005,
89:1241–1244.
12. Jampel HD:Glaucoma patients' assessment of their visual function and quality of life.Trans Am Ophtalmol Soc2001,99:2301–2317.
13. Mills RP:Correlation of quality of life with clinical symptoms and signs at the time of glaucoma diagnosis.Trans Am Ophtalmol Soc1998,
96:753–812.
14. Kopec JA, Willison KD:A comparative review of four preference-weighted measures of health-related quality of life.J Clin Epidemiol2003,56:317–325. 15. Dolan P, Lee H, Kling D,et al:How does NICE value health?BMJ2009,
339:371–373.
16. Payakachat N, Summers KH, Pleil AM,et al:Predicting EQ-5D utility scores from the 25-item National Eye Institute Visual Function Questionnaire (NEI-VFQ) in patients with age-related macular degeneration.Qual Life Res2009,18:801–813.
17. Hernandez R, Rabindranath K, Fraser C,et al:Screening for open angle glaucoma: systematic review of cost-effectiveness studies.J Glaucoma 2008,17:159–168.
18. Rein DB, Wirth KE, Johnson CA,et al:Estimating quality-adjusted life-year losses associated with visual field deficits using methodological approaches.Ophthalmic Epidemiol2007,14:258–264.
19. Kobelt G, Jonsson B, Bergstrom A,et al:Cost-effectiveness analysis in glaucoma: what drives utility? Results from a pilot study in Sweden.Acta Ophthalmol Scand2006,84:363–371.
20. Nelson P, Aspinall P, Papasouliotis O,et al:Quality of life in glaucoma and its relationship with visual function.J Glaucoma2003,12:2139–2150. 21. Ramulu P:Glaucoma and disability: which tasks are affected and at what
stage of disease?Curr Op Ophthalmol2009,20:92–98.
22. Tosh J, Brazier J, Evans P, Longworth L:HEDS Discussion paper 11/03. A review of generic preference-based measures of health-related quality of life in visual disordersThe University of Sheffield; 2011.
23. Alavi Y, Jofre-Bonet M, Bunce C,et al:Developing and algorithm to convert routine measures of vision into utility values for glaucoma.
Ophtalmic. Epidemiology2011,18:233–243.
24. Crabb DP, Viswanathan AC:Integrated visual fields: a new approach to measuring the binocular field of view and visual disability.Graefes Arch Clin Exp Ophthalmol2005,243:210–216.
25. Birt CM, Shin DH, Samudrala V,et al:Analysis of reliability indices from Humphrey visual field tests in an urban glaucoma population.
Ophthalmology1997,104:1126–1130.
26. Schulze-Bonsel K, Feltgen N, Burau H,et al:Visual acuities "hand motion" and "counting fingers" can be quantified with the Freiburg visual acuity test.Invest Ophthalmol Vis Sci2006,47:1236–1240.
27. RAND's Partners In Care:Depression screener. Available at: http://www.rand. org/content/dam/rand/www/external/health/surveys_tools/depression/ screener_eng.pdf.
28. Office for National Statistics:Deriving NS-SEC: Self-coded method. InThe National Statistics socio-economic Classification: User Manual. London: Pallgrave Macmillan; 2005.
29. Rabin R, de Charro F:EQ-5D: a measure of health status from EuroQol group.Ann Med2001,33:337–343.
30. Ware JE Jr:SF-36 health survey update.Available at: http://www.sf-36.org/ tools/sf36.shtml.
31. Wilson MR, Coleman AL, Yu F,et al:Functional status and well being in patients with glaucoma as measured by the Medical Outcomes Study Short Form-36 questionnaire.Ophthalmology1998,
109:1018–1022.
32. Brazier JE, Rowen D, Hanmer J:Revised SF-6D scoring programmes: a summary of improvements. InPatient-reported Outcomes Newsletter. Edited by. Available at: http://www.pro-newsletter.com/images/ PDF_articles/sf-6d.pdf.
33. Brown MM, Brown GC, Sharma S,et al:Quality of life associated with visual loss: a time tradeoff utility analysis comparison with medical health states.Ophthalmology2003,110:1076–1081.
34. Brown GC, Brown MM, Sharma S, Beauchamp G, Hollands H:The reproducibility of ophthalmic utility values.Trans Am Ophtalmol Soc2001,99:109–203. 35. Hollands H, Lam M, Pater J, Albiani D, Brown GC, Brown M,et al:
Reliability of the time trade-off technique of utility assessment in patients with retinal disease.Can J Ophthalmol-J Can D Ophtalmologie 2001,36:202–209.
36. Brown GC, Sharma S, Brown MM, Kistler J:Utility values and age-related macular degeneration.Arch Ophtalmol2000,118:47–51.
37. Schiffman RM, Walt JG, Jacobsen G, Doyle JJ, Lebovics G, Sumner W:Utility assessment among patients with dry eye disease.Ophthalmology2003,
110:1412–1419.
38. Sharma S, Brown GC, Brown MM, Hollands H, Robins R, Shah GK:Validity of the time trade-off and standard gamble methods of utility assessment in retinal patients.Br J Ophtalmol2002,86:493–496.
Bozzaniet al. BMC Ophthalmology2012,12:43 Page 8 of 9
39. Mangione CM:The National Eye Institute 25-item Visual Function Questionnaire (VFQ-25). Version 2000. Available at: http://www.nei.nih.gov/ resources/visionfunction/manual_cm2000.pdf.
40. National Institute for Health and Clinical Excellence (NICE):Guide to the methods of technology appraisal. London: National Institute for Health and Clinical Excellence; 2008.
41. Herdman M, Gudex C, Lloyd A, Janssen MF, Kind P, Parkin D, Bonsel G, Badia X:Development and preliminary testing of the new five-level version of EQ-5D (EQ-5D-5 L).Qual Life Res2011,20:1727–1736. 42. Walters SJ, Brazier JE:Comparison of the minimally important difference
for two health state utility measures: EQ-5D and SF-6D.Qual Life Res 2005,14:1523–1532.
43. Tosh J, Brazier J, Evans P, Longworth L:A review of generic preference-based measures of health-related quality of life in visual disorders.Value Health2012,15:118–127.
44. Espallargues M, Czoski-Murray CJ, Bansback NJ,et al:The impact of age-related macular degeneration on health status utility values.Invest Ophthalmol Vis Sci2005,46:4016–4023.
45. Harrison MJ, Davies LM, Bansback NJ,et al:The validity and responsiveness of generic utility measures in rheumatoid arthritis: a review.J Rheumatol 2008,35:592–602.
46. Szende A, Leidy NK,et al:Estimating health utilities in patients with asthma and COPD: evidence on the performance of EQ-5D and SF-6D.
Qual Life Res2009,18:267–272.
47. Dolan P:Thinking about it: thoughts about health and valuing QALYs. In Book Thinking about it: thoughts about health and valuing QALYs. 2010. 48. Black N, Browne J, van der Meulen J,et al:Is there overutilisation of
cataract surgery in England?Br J Ophtalmol2009,93:13–17.
49. Ravens-Sieberer U, Wille N, Badia X,et al:Feasibility, reliability, and validity of the EQ-5D-Y: results from a multinational study.Qual Life Res2010,
19:2887–2897.
50. Robinson A, Dolan P, Williams A:Valuing health states using the VAS and TTO: what lies behind the numbers?Soc Sci Med1997,45:1289–1297. 51. Lee BS, Kymes SM, Nease RF Jr,et al:The impact of anchor point on
utilities for 5 common ophthalmic diseases.Ophthalmology2008,
115:898–903 e894.
52. Kind P, Hardman G, Macran S:UK population norms for EQ-5D. InBook UK population norms for EQ-5D1999.
53. Brazier J, Roberts J, Deverill M:The estimation of a preference-based measure of health from the SF-36.J Health Econ2002,21:271–292.
doi:10.1186/1471-2415-12-43
Cite this article as:Bozzaniet al.:A comparison of the sensitivity of EQ-5D, SF-6D and TTO utility values to changes in vision and perceived visual function in patients with primary open-angle glaucoma.BMC Ophthalmology201212:43.
Submit your next manuscript to BioMed Central and take full advantage of:
• Convenient online submission
• Thorough peer review
• No space constraints or color figure charges
• Immediate publication on acceptance
• Inclusion in PubMed, CAS, Scopus and Google Scholar
• Research which is freely available for redistribution