υιπ^
Do the scientists engaged on biological research in the Commu-nity hare enough supporting staff.' See pages 114-116.
CONTENTS
98 WHAT FUTURE FOR P U M P E D S T O R A G E ?
Pumped slorage power seems marked out for a role complementary to that of nuclear power.
M I C H E L van MEERBEECK, Directorate general for Energy, Commission of the European Communities, and M I C H E L GIBB, Editor.
107 T H E B O I L I N G O F ALKALI METALS.
The behaviour of boiling water is well known by reason of its centuries-old use. How do boiling metals behave?
G Ü N T H E R GRASS and H E I N Z K O T T O W S K I , Heat Transfer Department, Ispra Establishment of the Joint Research Centre.
114 T H E ANATOMY O F B I O L O G I C A L R E S E A R C H IN T H E C O M M U N I T Y .
The results of the statistical part of an investigation on the state of biological research in the Community.
M I C H E L GIBB, Editor.
117 T H E PEBBLEBED R E A C T O R -BACKGROUND.
- S O M E T H I N G O F ITS DENIS T Y T G A T , Directorate general of the Joint Research Centre.
118 D O E S A PEBBLE-BED BEHAVE LIKE A FLUID?
The (low pattern of a pebble-bed can be predetermined with a sur-prising degree of accuracy.
D I E T R I C H B E D E N I G , Brown Boveri/Krupp Reak-toibau G m b H , Experimentelle Entwicklungsabteilung.
124 N E W S F R O M T H E E U R O P E A N C O M M U N I T I E S :
', ''■." ¡¡m
e υ r ci t o m
Quarterly Review of the European Atomic Energy Community (Euratom)
1968
The Community's mission is to create the conditions necessary for the speedy estab lishment and growth of nuclear industries in the Member States and thereby contrib ute to the raising of living standards and the development of exchanges with other countries (Article 1 of the Treaty instituting the European Atomic Energy Community).
A few weeks ago, the first annual
meeting was held at Ispra of the
"Working Group on Liquid Metal
Boiling", set up as a result of a
decision taken a year earlier at Aix
enProvence, during the International
Conference on Fast Reactor Safety.
The participants included some 30
experts from Belgium, France, Ger
many, Italy, the Netherlands and the
United Kingdom.
Liquid metals, which are among the
most suitable coolants for fast reac
tors, raise a great many problems
which need to be solved both in order
to advance the technology of these
rather unusual materials and to ensure
that reactors using them operate
safely—as is explained at length in
one of the articles contained in this
issue.
By the end of the century, our electricity may well be produced mainly by a network of nuclear power plants and pumped storage slations working in combination.
IT IS W E L L K N O W N that the irreg ularity of electricity consumption during the course of the day, the week and the year results in great differences in utilisation be tween one electrical power plant and another. Some run for only a few tens of hours while others operate annually at full power for more than 8,000 hours.
The structure of the production costs of the various units makes each unit more or less suitable for meeting different load demands. Broadly speaking, lowcost units will be installed to act as peakload plants, even though the proportional costs, i.e. mainly the fuel costs per kWh, may be high, or else use will be made of old units which are already amortised and whose efficiency is poor; on the other hand, machines with low proportional costs will be sought as base load units, even though they may entail larger investments. Nuclear power plants of course, come under this latter category.
During a study on the integration of nuclear power plants in electricity pro duction and distribution grids, the results of which were published in 1965', it emerged that, while the number of nuclear plants was on the increase, two factors tended to go counter to this trend. Firstly, the new nuclear power plants, having the lowest proportional costs, fill up the base of the production diagram and displace the first plants to be installed towards the top to a zone where the load factor decreases. Secondly, the operation of base load nuclear and conventional thermal power plants in a low utilisation zone of the production diagram raises technical prob lems of load modulation. Hence the idea of modifying the production diagram to the benefit of the baseload plants by storing the electrical energy they produce. At present the only method of storage which is economically viable is that of pumping water from one reservoir into another one higher up. The water thus
1. R e p o r t E U R 2453Γ
accumulated is brought down again through a turbine during peak hours (figures 1 and 2).
Economic justification of pumped storage
The economic justification for pumped storage schemes is based on the following considerations.
The cost of the energy fed into a grid
pumped storage. While the high capital costs of the nuclear plants penalise them as soon as their utilisation falls below 5,000 hours, their low proportional costs make their largescale use particularly economic (figure 4 right).
Let us see in more detail what are the advantages of pumped storage.
Its advantages . . .
Although the cost of building a pumped storage station is not low (e.g. about 6,000 BF/kW installed for the Coo station, in Belgium, and 5,000 BF/kW at Vianden, in Luxembourg), the fixed annual cost per k W installed is relatively modest, for the following reasons :
What future for punì
M I C H E L VAN M E E R B E E C KDirectorateGeneral for Energy
MICHEL GIBB Editor
varies greatly according to the overall load. When the load is low, only the baseload stations with low proportional costs are in service. The unit cost of this energy is thus relatively modest. On the other hand, at peak hours, practically all available plant is operating, including stations whose pro portional cost is very high.
It is thus economical to store cheap energy, produced at night or at weekends by base load units, and to return it at peak hours in place of costly production (see figure 3 and figure 4 left), on condition, of course, that the cost of the energy returned, taking into account efficiency, is lower than that of the energy which would have been pro duced by the peakload units which the pumped storage station is replacing. Γη this case the benefits to be derived from the pumped storage scheme during the whole of its lifetime must moreover be sufficient to offset its capital and maintenance costs. The largesize nuclear power plants thus seem to enhance the economic viability of
The plant operates in the cold state; it therefore has the advantage of not needing parts capable of withstanding high temper atures and pressures, the fabrication of which would necessitate the use of expen sive special materials and the lifetime of which would in any case be fairly short; maintenance is therefore inexpensive. The lifetime is considerably longer than that of other production units, a figure of 60 years being set for the civil engineering structures and 40 years for the electrical and mechanical components. The amorti sation payments are thus distributed over a longer period, reducing their share in the fixed annual costs.
staff to 0.025 man per MW. By compar-ison, about 1 man per MW is needed on the average for a conventional thermal plant of 250 MW and approximately
Figure 1: Principle of operation of a pumped storage scheme. Cheap energy available at certain hours is used to pump water into the upper reservoir (white arrows). At peak hours the energy is restored by the turbines (black arrows).
which, moreover, is bound to increase with the commissioning of large nuclear units of 600 MW and over in the next few years. Furthermore, like all hydraulic installations which work cold, pumped storage stations are simple and reliable. For this reason their availability factor is higher than that of conventional thermal units — 95 as against 80-85%.
One advantage of pumped storage plant
which must not be overlooked is the
particularly beneficial influence on other plant of the steadier load conditions which it brings about.
The effect on the base-load units of pump-ing durpump-ing the off-peak night hours is to permit the operation of units which it would otherwise have been necessary to shut down, and to enable others to operate at more economic loads.
This leads to a reduction in the start-up and fuel costs of these units, as well as to savings on the maintenance costs attribut-able to the thermal and mechanical stresses caused by sudden variations in load. A further effect is to lengthen their life, mainly through the reduction in the fre-quency of start-ups; it is difficult to give statistics owing to the limited experience as yet gained with recent sophisticated units of 125 and 250 MW and with nuclear power plant, but it is certain that these plants are lacking in flexibility and em-phatically not intended for discontinuous operation.
Yet another effect is that the utilisation of units with very high proportional costs is lessened, thus reducing the specific cost of electricity produced.
The most unusual advantage of the pumping stations is their
"self-modern-0.4 man per MW for a nuclear power plant of 600 MW.
Only turbojet units have a lower in-stallation cost, but with the drawback of a rather high proportional cost, which makes them economic only for operation during extreme peak-load periods.
Another advantage of pumped storage stations is their very great flexibility of adaptation to the load. At Vianden, for example, it takes less than two minutes to start the turbines or to switch over from pumping to turbine operation. This is equivalent to having a virtually instan-taneous reserve of about 1,600 MW. This property is very useful in the event of failure of one or more base-load units, for the start-up of stand-by base-load units is particularly long and difficult, thus necessi-tating a considerable spinning reserve,
Figure 2: Aerial view of the upper reservoir of the Vianden scheme, Luxembourg.
looMW
Figure 3: Typical daily load diagram of the missioning of the first two groups.
12 14 16 ig 2o ZI 24 Vianden pumped storage station after the
com-ising", for since they use energy supplied by base-load units, they profit by all the improvements in the design of these units, particularly the reduction in proportional costs. The coupling of pumped storage with nuclear power plants thus seems to be of immediate interest, since the propor-tional cost of the latter plants is extremely
low.
. . . and its disadvantages
Firstly, owing to the numerous trans-formations undergone by the energy supplied to a pumped storage station, ita efficiency is only about 70% (figure 5). Secondly, the profitability of a pumped storage scheme is largely dependent upon the site. The choice of a site is therefore generally very limited, mountainous regions remote from the high-consumption areas usually being selected. This entails invest-ing heavily on high-tension lines and transformer stations to carry the energy produced. Moreover, in spite of the high voltages used, it is not possible to avoid energy losses due to the long distances covered.
In contrast to other peak-load units, which can feed their energy into the
medium-tension grid (the site being judiciously chosen on the basis of the geographic distribution of the load), the pumped storage station, although a peak-load unit, must pass through the entire grid system
before its energy can be consumed. In addition, it is dependent upon the load diagram, since the slack night hours are used for pumping and the peaks for tur-bine operation. If the slack night periods become less marked or the peaks flatter (as a result of a better utilisation of energy by consumers), there will be less need for pumped storage power. However, it must be said at this juncture that in spite of the efforts of producers to improve it, the load factor has remained relatively constant as a result of the rapid increase in low ten-sion demand.
Repercussion on nuclear power plants
As has been seen, the coupling of nuclear power plants and pumped storage stations seems a priori well justified from the economic angle. This is why in 1966 Euratom asked the Belgian companies Electrobel and SOBEMAP {Société belge d'économie et de mathématique appliquées) to carry out a study aimed at elucidating in detail the effects of the construction of pumped storage stations on the economic situation of nuclear power plants. An attempt is made here to summarise its
main conclusions.
Figure 4: Daily load diagrams (typical of the Belgian grid). On the left a chronological diagram; on the right the corresponding diagram of the classified power outputs.
[image:6.595.220.570.507.719.2]Production centres The Vianden and Coo schemes
At the end of 1966, eleven pumped storage stations were in service within the Com-munity, representing a total installed power of 1,950 MWe.
Nine of them were situated in Germany (967 MWe in all), while the Grand Duchy of Luxembourg had the Vianden power plant with an output of 900 MWe. The Coo power plant (near Stavelot in Bel-gium), which is still under construction, will represent a turbine power of 720 MWe. The study devotes particular attention to the Vianden and Coo stations.
The Vianden plant, of the underground type, works mainly in conjunction with the German grid. The lower reservoir con-sists simply of a barrage on the river Our (figure 6); the water of this reservoir is thus continuously renewed and the losses due to evaporation and infiltration are automatically compensated.
The solution adopted for the turbo-pump units is that of independent pumps and turbines mounted on a horizontal axis on either side of the alternator (figure 7). This solution, adopted because at that time the technology of turbo-pumps of this size was not yet perfected, has the disadvantage of requiring the excavation of an underground gallery 330 metres long, and thus entailing major additional capital costs, and the advantage of being extremely flexible and hence particularly well adapted for synchronous compensa-tion.
The Coo power plant, also of the under-ground type, is under construction in the Ambleve valley and has the characteristic of possessing two genuine reservoirs, in the sense that the lower reservoir, instead of being, as in the majority of schemes, a simple dam over the river (which would have submerged the town of Coo), will be a distinct entity like the upper reservoir. This arrangement has a double disad-vantage : it is always the same water which is used, hence a risk of fouling of the machinery and, secondly, additional pump-ing is necessary from the Amblève river for the first filling and also to make up losses.
For this plant the solution of reversible groups has been adopted, so that the dimensions of the underground cavern (the Coo gallery is only half the size of
Transmission los-ses "outward"
Transformer losses
Motor losses
Pump losses
Pressure shaft los-ses
Pressure shaft los-ses
Turbine losses
Alternator losses
Transformer losses
Transmission losses "return"
stribution centres
that at Vianden for example) and hence capital costs can be considerably reduced. On the other hand, operation will be less flexible, a drawback which, however, will be without importance so long as the station is used only for peakload energy and not as a synchronous compensator.
Calculation of operating costs
One of the most important parts of the study carried out by Electrobel and SOBEM'AP consisted in an evaluation of the difference between the operating costs of an electricity producing system with and without pumped storage.
In order to be valid, such an evaluation must be based on an actual example. The example chosen is largely drawn from the situation of the Belgian grid, assuming completion of the Coo scheme.
The calculations were made first of all for the "ideal case", i.e. the operation of an installation situated in a perfect grid (without losses and without bottlenecks), made up of ideal machines (capable of coping with load variations from zero to maximum instantaneously and producing each unit of electricity at the same cost, regardless of load) and supplying power to a grid the demand of which is considered to be perfectly predictable at any given moment. If the overall management of the various power units is simplified in this way, the problem is essentially to calculate what it would have cost, with the aid of the other peakload stations, to produce the energy supplied by the storage scheme, and to subtract from this sum the cost of the energy required in order to raise water from the lower into the upper reservoir. The result represents the gain afforded by the pumped storage station. The factors which distort the ideal situation were then taken into account. In assessing their effect on the management of the station during the different phases of its existence, the study was limited to a small number of days distributed through time. Thus for each year considered (1973, 1983 and 1993), a "strong", a "medium" and a "weak" day were chosen.
The calculation proper was performed on the Mercury Ferranti computer at the Centre d'étude de l'énergie nucléaire, Mol, using a programme prepared by the U.C.P.T.E. (Union pour la coordination
Figure 6: The dam on the river Our, which forms the lower reservoir of the Vianden scheme.
4,462 MWh in the complete calculation. The loss of efficiency in pumping is almost nil since pumping takes place at optimum power, which is not true of turbine opera tion, which takes place most frequently at intermediate power.
Consequently an additional 88 MWh must be produced in the first case. Since these are produced by peakload machines, their mean cost is about 0.57 BF/kWh. The penalty is thus 50,000 BF/day in the actual situation as contrasted with the ideal situation.
On the other hand, the other terms are positive.
2. The fuel cost in the ideal case corre sponds to the fullload cost. In the detailed calculation account was taken of the additional costs due to idling and the additional fuel cost due to partload operation. The calculated gain is 843,000 BF/day. It would have been only 776,000 BF/day if the kWh had been counted at their nominal cost. The penalty for idling is thus 67,000 BF/day.
3. By dint of its great flexibility, the pumped storage station enables the ideal economic load distribution to be ap proached more closely, since it lessens the effect of certain restrictions such as the minimum power at which the various plants must run, the time they require for startup, the need for a spinning reserve, etc. Since
■ï Figure 7: Assembly work in progress in the gallery of the Vianden plant.
de la production et du transport de l'élec tricité) .
The results showed that nuclear power plants will not be used for pumping until after 1983 and then only on offpeak days such as Sunday, and that we must wait until 1993 for them to enter into an area of the production diagram where a daily shutdown is necessary. Thanks to pumped storage stations, these shutdowns are reduced but not entirely eliminated, because the load variation costs of such power plants are less than those of conventional steam units.
It is found that when account is taken of operating restrictions, the advantages
offered by pumped storage increase con siderably. The causes are mainly an appre ciable rise in the utilisation of baseload steam plants, which reach their maximum, and the drop in startup costs.
Although the pumped storage station be comes less and less important relative to the total installed power, it affords a steadilyincreasing absolute gain over the years.
The differences in the figures obtained for operating cost gains attributable to pumped storage between the complete calculation and the simplified calculation were so large (see Table I) that a more thorough analysis of their causes was thought necessary. For
this purpose, a day in midDecember 1983 was chosen.
Between these two calculations—the calcu lation corresponding to the ideal simplified situation and the complete calculation on the computer—four sorts of difference can be observed to account for the gain of 987,000 BF/day in the complete calculation as against 490,000 BF/day in the simplified case:
Day Dec. 73 Sept. 73 Dec. 83 March 83 Dec. 93 Sept. 93 June 93 Total cost— simplifi without p.s. (106 BF)
18.393 14.856 29.442 21.989 49.228 37.513 31.771 ed case with p.s. (IO6 BF)
18.137 16.692 28.941 21.625 48.114 36.695 30.961
Total cost —complete calculation with computer
without p.s. (106 BF)
19.112 15.346 30.546 23.515 52.480 41.171 34.994 with p.s. (106 BF)
18.505 14.737 29.560 22.682 51.112 39.506 33.641
Table I: Operating costs with and without pumped storage (for the Belgian grid; pumped storage station of 720 M W).
the simplified calculation fails to reveal these advantages clearly, they constitute the major difference between the two calculations. Allowing for the fact that the loss related to the station's efficiency reduces the corresponding gain, this difference may be estimated at 336,000 BF/ day.
4. The cost of start-ups, although relatively small, forms an appreciable part of the advantages afforded by pumped storage. The calculations give a gain of 144,000 BF/ day.
The real economic gains due to pumped storage thus appear much greater than those indicated by a simplified calculation.
Optimum composition of a system including pumped storage plant
We have seen above how an existing
pumped storage station should be operated in order to obtain the maximum benefit. The fixed costs due to the existence of the station were, of course, disregarded. On the other hand, when considering the
question of whether to construct a new
station, the fixed costs must also be taken into account and compared with those of rival types of equipment. Furthermore, the use of pumped storage, since it has an influence on the utilisation factors of the various units making up the system, may call into question the entire equipment programme.
104
We will not go into the details of the study
carried out by Electrobel and SOBEMAP,
but will merely give some of the major results.
A detailed examination of the different technical and economic parameters makes it quite clear that the pumped storage station is an intermediate utilisation unit and must play a part similar to that of units such as gas turbines. Secondly, taking as the hypothetical optimum composition of a system—here again for the Belgian grid—that worked out during the previous study already quoted (Report E U R 2453 f —see Table II), it is possible to calculate the influence which the use of a pumped storage station has on the energy pro duction cost.
A numerical example based on the in clusion of a 720 MW pumped storage station in this system gives the following figures :
[image:9.595.400.583.369.723.2]— cost of the station: 3,567,750,000 BF and cost of the lines 678,000,000 BF; fixing the annual capital charges at the rate of 11.3%, conversion to present worth over 20 years at 8% gives 6,285,000,000 BF. — assuming that the non-installed units correspond to 220 MW of gas turbines and
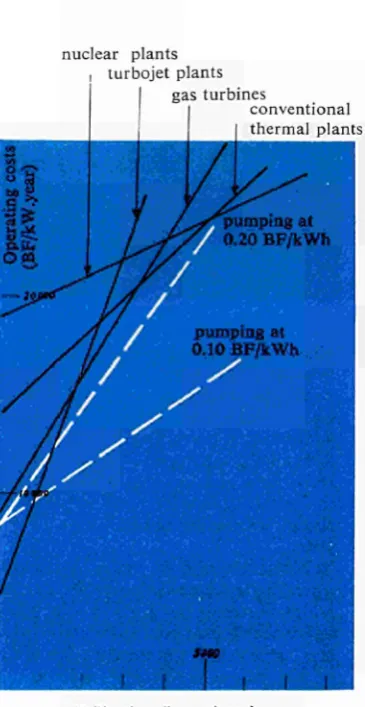
Figure 8: Annual operating costs of the various electrical production units as a function of their utilisation time. (This graph, based on target data, serves essentially to show the effect of different cost structures.)
to 500 MW of turbojets, a saving on fixed costs of 4,819,000,000 BF is obtained, also converted to present worth over 20 years. — the saving on the fuel and start-up costs converted to present worth over 20 years has been assessed at 1,700,000,000 BF. The benefit, converted to present worth, of the introduction of the pumped storage station is thus equal to
— 6,285 + 4,819 + 1,700 = 234 million BF.
The value of pumped storage stations being thus definitely proved by the calculations, the optimum part which they ought to play in the composition of the system must now be determined.
In order to solve this problem, it was necessary to simplify it by adopting certain hypotheses. For example, the cost struc tures of the various production units were assumed to correspond to those shown in figure 8. These costs were calculated, as regards pumped storage stations, for the case in which the energy supplied to the
nuclear plants ι turbojet plants
gas turbines
conventional thermal plants
idear pia: Conventional steam plants Gas turbines Turbojet plants
Power
% max. Fixed cost
power req. % max. inst. power BF/kW. year kWh/year cost BF/kWh Total BF (hours) produced Proportional Utilisation
Table 11: Energy produced and annual cost for 1 kW of peak-load power required (assuming optimum composition of the production system as given in EUR report 2453 f).
[image:10.595.204.569.433.728.2]plant would cost 10 centimes /kWh and that in which it would cost double this amount, or 20 centimes /kWh; this gives production costs of 14.3 and 28.6 centimes/ kWh respectively. The fixed costs used for the pumped storage station (7,300 BF/kW and 823 BF/kW.year) include the trans-mission lines. One remarkable finding is that, apart from very low utilisation ratings, i.e. less than 1,000 hours per year, pumped storage stations are the most economical units.
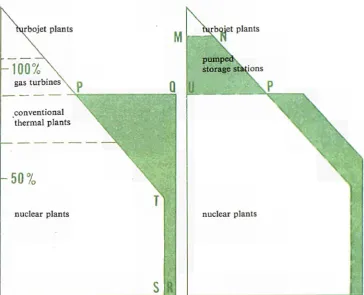
Figure 9 indicates how a pumped storage station distorts the production diagram. It can be seen that the utilisation of the base-load units is increased and that, inas-much as the capacity of the reservoirs and pumps permits, the maximum pumping energy corresponds to the surface PQRST (figure 9a).
But in actual fact a diagram similar to that in figure 9b is obtained, which only takes into account the energy which it is econom-ic to pass through a turbine (represented by the surface MNPU). For low utilisation factors it is more economic to install turbojet machines and for higher factors to use base-load plants.
Thus there is a level PQ for which the energy available for pumping is equal to the energy which it is economic to pass down through the turbines. It has been calculated that this level corresponds to about 70% of the system.
In view of this, the utilisation factor of the base-load machines remains high, never falling below 6,000 hours. Consequently there is no reason to install conventional
thermal units and the optimum proportion of nuclear power plants amounts to 70%. The optimum system is then made up as follows :
— nuclear units: 70%
— pumped storage stations : 22% — turbojets: 8%
It should be pointed out, however, that it is not in all parts of the world that a
Figures 9a and 9b: Modifications made to a hypothetical production diagram by the introduction of pumped storage. (It is assumed that the maximum installed power of the system is 124 % of the maximum power actually required). Figure 9a represents the production diagram of a system without pumped storage and figure 9b that of a system including an optimum proportion of pumped storage.
View of the Our Valley downstream of the dam forming part of the Vianden scheme.
sufficient number of sites are available to install this kind of pumped storage capacity at the capital costs used in the calculations. In other words, the installed pumped storage power is limited in practice by natural factors.
It should be emphasised that the statistics used in the study just outlined should only be taken as orders of magnitude valid in the present economic context. However this may be, the study clearly demon-strates the attraction of pumped storage stations and shows them to be the ideal unit for use in conjunction with nuclear power plants.
(EREA-A 7-14)
The boiling of alkali metals
GÜNTHER GRASS
and
HEINZ KOTTOWSKI,
Heat Transfer Department, Ispra
Establishment of the Joint Research Centre
The design of certain reactor types, and in particular fast-neutron reactors, is based on the
use of liquid metals for heat transport. This, by comparison with the centuries-old use of
water for this purpose, is something entirely new. It is therefore advisable, partly for safety
reasons but also in order to derive the greatest possible advantage from them, to study the
behaviour of such metals very closely.
INVESTIGATIONS into the suitability
of alkali metals like sodium and potassium
or their alloys as coolants did not begin until
after 1950. Research on the boiling
be-haviour of sodium subsequently received a
fresh impetus, especially because of the
need for accident analyses in respect of fast
breeder reactors. Sodium boiling cai; occur
in a fast breeder reactor, both in a power
excursion and in a coolant flow failure.
Both types of accident can result in the
boiling temperature being exceeded.
Besides, in the last few years, technological
development has opened up fields of
application in which sodium vapour has
proved superior to conventional media.
The carrying-out of such projects is at the
present time still limited by the reliability
of suitable construction materials. Taking
the present status of materials
develop-ment as a starting point, it is none the less
already technically feasible to build, inter
alia, reliable alkali-metal vapour driven
turbines for low powers (around 300 kW)
and saturated steam conditions of up to
1,200°C and 5 bars, but initially their
application would be confined to space
travel. In addition, the feasibility of using
sodium and sodium vapour in
closed-cycle operation, for example in direct
magnetohydrodynamic energy conversion
(MHD) and for the transport of process
heat in the iron and steel industry, is
definitely established.
The sodium and potassium boiling studies,
which started out from the safety angle,
very soon developed into basic
investiga-tions into the boiling behaviour of alkali
metals in general, under various conditions.
While the flow pattern of water under pool
boiling and forced convection conditions
was quite well known, there existed at that
time only theoretical models of the flow
pattern in boiling liquid metals which, as it
subsequently transpired, are of limited or
no validity. If the hydrodynamic flow
conditions are taken to be the primary
characteristic of each type of boiling, the
following distinctions can be drawn :
1. stagnation, )
2. natural convection, > in a channel
3. forced convection, )
4. film boiling,
5. transpiration and perspiration cooling
(evaporation).
Cases 1 and 2 can arise if, for example, the
pumps in a fast breeder cut out suddenly
and reactor power is not turned off
quickly enough. Case 3, boiling with forced
convection in the reactor, may occur if the
sodium flow rate in a reactor channel drops
or if the reactor power is excessive. Film
boiling takes place when a reactor cooling
channel is emptied for any reason and a
fluid film is left on the walls. By
evapora-tion cooling is meant evaporaevapora-tion through
a porous wall (e.g. sintered metal), which
permits a heat transfer that is self-adjusting
over a wide range.
On account of its greater interest, boiling
under flow conditions 3), 4) and 5) is
discussed in detail below.
Various boiling mechanisms in forced
convection
By boiling in forced convection (Fig 1) is
normally meant the conditions that prevail
in, for example, a once-through boiler: a
coolant enters the boiler undercooled at a
particular flow rate, evaporates either
completely or partially on its way through
and accordingly comes out as pure steam
or a liquid vapour mixture. The channel
wall is heated with a heat flux that is
constant in time but may vary locally in
certain circumstances. The saturation
temperature of the liquid (T
sin Fig.
la)-falls on the way through the channel in
line with the decrease in total pressure,
which is due to friction pressure losses and
also, in the case of vertical channels, to the
change in hydrostatic pressure. The liquid
temperature rises in line with the flow rate
and heat flux (T
Fin Fig. la). The two
curves intersect at a distance L
sfrom the
inlet at the saturation point. Downstream
of the saturation point the temperature of
the mixture ceases to rise with the T
Fcurve,
if it is assumed that thermodynamic
balance conditions prevail at every point,
but corresponds to the saturation
temper-ature T
s.
In the channel, the liquid/vapour mixture
goes through a number of flow conditions
which in particular cases may be wholly or
only partially present, depending on the
pressure, mass flow, steam content at outlet
and other parameters (Fig. lb):
A: pure, undercooled liquid;
B: surface boiling;
C: nucleate boiling;
D : slug flow ;
E: annular flow;
F: fog;
υ
ρ ρ
U,
Β
c
Ι«
Ts = saturation temperature
TF = temperature of the liquid metal
I
■ τ ^
L0
LL,
LH,
H B |*C4*O—4"—
E — ► M
-* ^
GH
inlet saturation point outlet
[image:13.595.25.390.29.377.2]Fig. 1: The liquid metal temperature and saturation temperature in the case of forced-convection boiling in a vertical tube. At b) is a diagrammatical representation of v/hat hap-pens in water at a pressure of 70 bars with a heat flux of 100 W¡cm2, i.e. the normal conditions in a boiling-water reactor; at c) and d) is shown what happens to liquid metals at 2 bars with a heat flux of 350 fV/cm2 in conditions of thermodynamic equilibrium (c), and in—more usual—delayed-boiling condi-tions (d).
Fig. lb illustrates in the most general way what occurs at every point during "steady" boiling under forced convection conditions typical of a boiling water power reactor (70 bars). The steam content rises con-stantly, the state of the mixture at every
Temperature at centre > Boiling
of axis temperature
point is clear-cut and virtually constant in time.
The boiling of liquid metals, on the other hand, is totally different at low pressures1,
where the vapour and liquid density differ by about a factor of a thousand, i.e. a small volume of evaporating liquid pro-duces a very large volume of vapour. Furthermore, pure liquid metals contain exceptionally few physical or chemical boiling nuclei, in addition to which they apparently neutralise to a large extent surface irregularities, which also act as boiling nuclei. This results in a very marked tendency toward retardation of boiling. (In potassium at its purest, super-heating up to 830°C has been measured.) The good thermal conductivity of liquid metals entails, under forced convection conditions, radial temperature gradients which are slight in relation to the possible superheat, i.e. the superheat in liquid metals can be uniformly very high through-out the volume considered.
Because of all these factors, liquid metal boiling follows a different pattern from that usually observed in water. The
I. In the typical case of alkali metals, confine-ment to low pressures results from the limita-tions set by the properties of the construction materials at the high boiling temperatures in-volved.
Bulk tempe
time time
Fig. 2: Liquid metal boiling during forced con-vection with superheat.
temperature a) Surface boiling b) Single-bubble c) Single-bubble
with condensation formation; formation; in main stream slow volume increase rapid volume increase
[image:13.595.215.576.486.728.2]temperature TF ot the liquid metal (Fig. la)
continues to rise downstream of the saturation point Ls (up to a maximum of
TF A), so that at the outlet a superheat of
Δ TSHA = TF A — TSA can occur without
boiling taking place at all. An analysis of the physical properties of sodium and potassium (see Table I) shows that super heating and hence retardation of boiling is a characteristic property of sodium and potassium. Initiation of boiling in the superheated range Ls to LA leads to the
formation of large separate vapour bubbles (Fig. Id).
If, on the other hand, we assumed the same boiling mechanism as for water, the transition from liquid flow to vapour flow in liquid metals at low pressures would be so rapid, owing to the high specific vapour volume, that the ranges B, C, D and E in Fig. l b would disappear completely. While in boiling water channels these ranges may take up lengths of about SO SO cm at 70 bars and a heat flux of 100 W/ cm2, in liquid metals this transition would
theoretically take place over a few milli metres at 2 bars and 350 W/cm2, as
illustrated in Fig. lc.
On the basis of the experimental data which are available today it is already possible to make reliable predictions about the boiling behaviour of sodium and potassium for the conditions permitted by the present state of technology (i.e. up to 5 bars and 1,200° C). Two quite distinct stages must be considered, namely a) the actual onset of boiling and b) boiling some time after the onset.
The critical phase in the boiling of sodium and potassium (and with other alkali metals it will be similar) is the onset of boiling. In the transition from the sub cooled to the superheated condition, either of the following two boiling processes are possible (shown in Fig. 2), namely surface boiling and retardation of boiling with the formation of separate bubbles.
The form in which boiling sets in depends on the activation of the boiling nuclei on the wall surface. The types of boiling shown in Fig. 2 will occur with equal probability. Surface boiling (Fig. 2a) is possible even if the liquid is superheated downstream. Surface boiling does not, however, remain stable for any length of time. It changes into another form of boiling (Figs. 2a and 2b: slow or fast
growing separate bubbles) and the surface boiling is inhibited. When separatebubble formation occurs, a residual film remains behind on the wall, its thickness depending on the velocity and acceleration of the liquid in the channel. Cooling is main tained by film evaporation.
After a transitional period characterised by the alternate formation and condensa tion of bubbles, the flow conditions shown in Fig. lc are established. The amount of liquid present in the boiling channel varies according to the heat flux and the mass flow of the coolant. In this case, too, superheating can cause retardation of boiling, accompanied by an ejection of columns of liquid, resulting in the build up of a new film on the wall surface. This flow pattern, too, is of an unstable character, owing to the high superheating capacity of alkali metals. The channel may even be completely flooded with superheated liquid metal. Boiling breaks out in the super heated liquid (because of boiling nuclei on the wall surface, say) and this leads on again to retardation of boiling and the formation of large separate bubbles. It is seen that in liquid metal boiling delayed boiling with the formation of large separate bubbles is the prevailing mode, unless mechanical or chemical expedients are adopted to prevent superheating. Thus a graphic picture is afforded by the use of the term "separatebubble ejections" in order clearly to distinguish this form of boiling from both steadystate boiling and ejection phenomena in the form of two phase mixtures.
The properties of sodium
Table 1 shows the properties of sodium and, for comparison purposes, of potas sium and water. It is the physical properties which determine the velocity and tempera ture profiles. They also determine boiling behaviour.
In detail, it can be said that the tendency boiling with ejection of separate bubbles is all the greater :
— the lower the number of boiling nuclei per unit volume,
— the higher the liquid vapour density ratio and hence the volume occupied by the proportion of the liquid which is evaporating,
condenser
4
s*
by-pass
φι = 2C
φο = 2
Sg i = i
vz *
ÜL
\
.^^P{~ m ~^^^H ^p^^ll 1
'*y^r
—
^ ^ ■ t ö ~ ~
! TFW) —
Twu — —
—
TW40 _
Tws — — Tu Λ
* O
- rMR3
- 7 * * 2
-THP1
TFX2
Pe TFPI
=
~
~ ! Î
?
ρ Γ"
" L r , ,
_ _
Tw3 — = .TUlt — —
TW3
ν — —
1=1
V tzulcza
A
I
■ ..Ί I M B M
** )
Γ .Λ7
κ—■■£y
7 V4
1 / _ !
= J Π
= í
)
( / ] o 1■8
1 ,
o· -β.-«, q
73 ° '
'i
ι « 1
c . f u
«-.o ~T <
α
i
1
)
j 3 8
i '
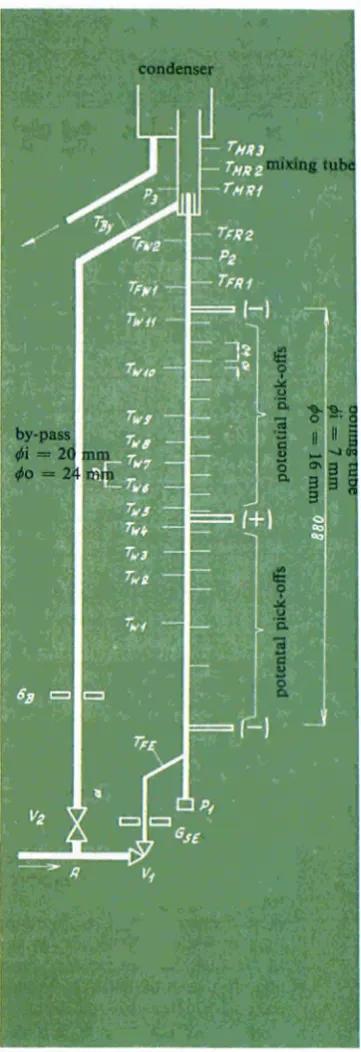
Fig. 3: Experimental loop for boiling tests with liquid metals installed at Ispra. At the various points shown, measurements are made bearing on velocity (vu v2), mass flow (GSE,
GB etc.), pressure (Pu P2 etc.) and tempera
[image:14.595.404.585.99.626.2]Description
Saturation temperature
Density of liquid at sat. temp.
Density ratio Surface tension Superheat Thermal conductivity Heat diffusivity Specific heat Latent heat
Ratio of stored heat to ejection heat Viscosity Prandtl number Quantit) Ts Pi
P F / P V
a
Δ Τ5 Η
λ α Cp A ' Unit °C kg/m3
N / m
°C
W/m°C
m2/sec
J/kg°C
J/kg
Cp. A T S H . P F
A pv
η
Pr
N a 2.0 bar
962 713 1240 0.106 30-400 43.7 47.0-10"6 1.31-103 3.7-106 22.0 A Ts H= 5 0 ° C
kg/m sec 1.6-10- 4
0.48-10-2
N a 1.3 bar
913 745 2440 0.108 30-400 46.3 48.0-10"6 1.29-103 3.74-106
K 0.55 bar
685 679 2340 0.07 30-400 32.5 61.0-10-6 0.78-103 1.95-106
H20 1.3 bar
107.2 955 1265 0.059 3.0 0.68 0.17-10-6
4 . 2 0 1 03
2.23-106
42.0 46.8 7.2 A Ts H= 50°C A Ts H= 50°C A Ts H= 3°C
[image:15.595.405.580.341.719.2]1.65-10-4 0.4610-2 1.4-10-4 0.3410-2 2.65-10-4 1.63
Table 1: Physical properties of sodium, potassium and water at saturation.
— the greater the tendency toward super
heating and hence the ratio of stored heat
to latent heat,
— the flatter the temperature profile in the
stream before the onset of boiling, i.e. the
higher the proportion of the total volume
which is subjected to high superheating,
— the greater the thermal conductivity
and hence the possibility that the evapo
rating fraction can utilise the heat stored
in the surrounding fraction which is not
evaporating.
The deficiency of pure liquid metal in
'boiling nuclei is well known. But, even
aside from this, perusal of Table 1 shows
plainly that there must be a tendency in
liquid metals toward separate-bubble
ejection; indeed, this is almost equally
true of sodium as it is of potassium.
The technique of experimental investigations
into boiling
Experiments with boiling sodium require
considerable expenditure owing to this
metal's high boiling point (962°C at 2 bars).
The loop initially used for this purpose at
Ispra (Fig. 3) was thus kept as simple as
possible as regards handling while, on the
other hand, great stress was laid on the
best possible leaktightness. The leak rate
was less than 5 χ IO-
6torr l/sec.
In consequence, the purity of the metal,
which was fresh before the experiment,
hardly altered over the course of the
experiments. The pattern followed by the
experiments was exactly the same at the
beginning and end of the series of tests.
The experimental section (Figs. 3 and 4)
consisted of two tubes, one in which boiling
was conducted, the other arranged to
form an unheated by-pass, both installed
vertically with the flow from bottom to top.
The metal vapour was mixed with
sub-cooled metal in the mixing section of the
experimental· equipment and condensed
largely through direct contact. Heat was
applied straight to the boiling tube using
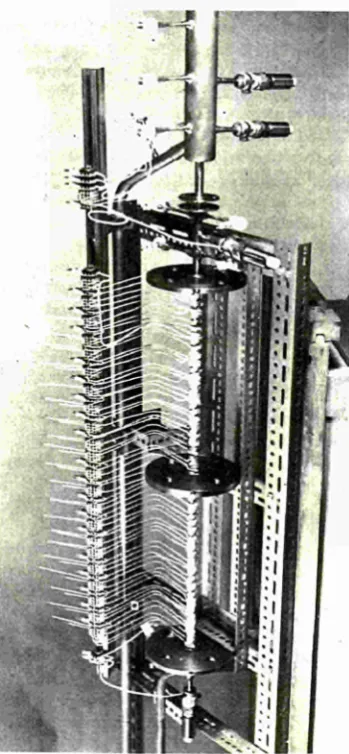
Fig. 4: View of the loop sketched at Fig. 3
direct current in order to maintain the
necessary heat fluxes.
Direct heating, in which the current flows
in the same way through both the liquid
metal and the tube wall, also makes it
possible to establish the electrical resistance
of any desired number of tube sections of
any desired length by means of potential
pick-offs.
Since a fairly constant heating current is
passing through the sodium-filled (or
locally non-filled) boiling section, any
considerable vapour formation between
two potential pick-offs results in a reduc
tion in the voltage drop owing to the in
crease in the electrical resistance. Thus it
is possible to ascertain, precisely and satis
factorily, when the portion of tube between
the relevant potential pick-offs is empty or
full. By this means, the exact moment at
Superheat (°C)
εοα 700
Saturation temperature
[image:16.595.4.199.64.303.2]which a bubble boundary (i.e. a liquid/
vapour phase boundary) has passed
through this portion of tube can be pin
pointed. By interpreting the recorded
potential values obtained by this method of
measurement, therefore, the distance cov
ered by the columns of liquid metal can be
determined with very great accuracy and
(by double differentiation of the distance)
the velocity and acceleration can be cal
culated.
Fig. 5: Measured superheat in potassium.
of time and so cease to be active boiling
nuclei. The behaviour in time is dependent
in very large measure upon the experi
mental conditions and the leaktightness of
the installation.
The maximum possible level of super
heating of a liquid metal is therefore any
thing but a constant property of the
material and must be viewed as a variable
quantity.
The growth, and hence the ejection, of the
vapour bubble will proceed at a greater
or lesser rate depending upon the super
heat, i.e. the temperature differential
between the liquid temperature and the
,
cboiling point at the place where retarda
tion of boiling occurs. Inside the vapour
space of a bubble taking up the entire
cross-section of the channel is set up a
pressure approximately in line with the
temperature of the film adhering to the
wall
1. This pressure is superimposed on
the system pressure and ejects the column
of liquid from the tube.
1. The time for thermodynamic equilibrium to
appear in the vapour space of a 7 mm diameter
tube is of the order of 10"' sec.
Film boiling
As said above, a residual film of liquid
metal is left on the wall during each ejec
tion. Owing to the increasing area of the
residual film during ejection, the rate of
evaporation increases with the length of
the bubble. Only this makes possible the
high ejection and expansion velocities
observed. If the walls were dry and only
the small surfaces of the ejected volumes
of liquid metal could contribute to evap
oration, then the bubble's internal pressure
would certainly drop during ejection, which
would be delayed thereby.
Film evaporation is thus a determining
factor in the ejection sequence. But it is
also interesting from another standpoint:
it enables liquid metals to be vaporised
without superheating, and hence a more
stable evaporation process can be ensured.
How to secure sufficiently steady condi
tions in an evaporation film, e.g. a trickle
film, forms the subject matter of various
projects in hand at Ispra, amongst other
places, and has considerable relevance to
the possible practical utilisation of liquid
metal evaporation for cooling or
vapour-generating purposes.
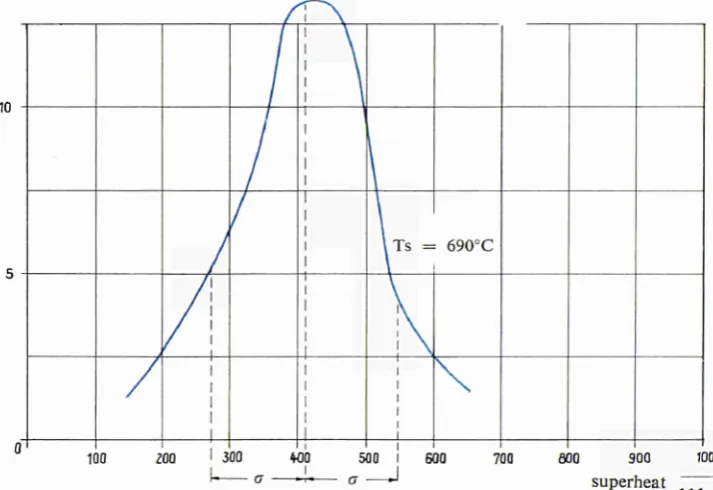
Fig. 6: Distribution of superheat measured in potassium.
Superheating and separate-bubble ejection
Measurements of initial superheating are
particularly important because this is a
determining factor in separate-bubble
ejection. By way of example, Fig. 5 shows
the superheat measured at Ispra in very
pure potassium. Fig. 6 gives the statistical
distribution of these experimental results —
which is approximately Gaussian. The
scatter of the measured superheat is
characteristic of liquid metals and is caused
both by their physical properties and by
the random distribution of the active
boiling nuclei along the tube wall.
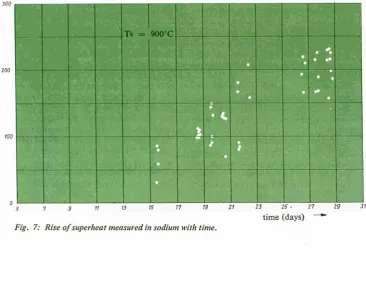
It was also observed that the measured
superheat tends upwards with the passage
of time (Fig. 7). This can probably be
attributed to the fact that wall cavities which
are filled with extraneous gas or vapour
will become filled with metal in the course
eoo 300superheat
[image:16.595.221.578.491.736.2](J 300
Λ
Ι Ο
D.
I
Ts = 900'C
^^3
ï Vi time (days) Fig. 7: Rise of superheat measured in sodium with time.
Fig. 8: Perspiration cooling. An increase in pressure from Ρ to P± in the spacefilled with vapour entails a reduction in mass flow through the wall and at the same time a rise in the saturation temperature. As a result, the evaporation process is slowed down and the pressure can return to its original level. Should the pressure drop from Ρ to P2, the phenomena are reversed.
heating element
vapour
porous tube
vapour
PII
Tfl
3S
~Τ
ΔΡ'
■
P■ p i
-ΛΡ
τ,
■ T
Tz
Transpiration and perspiration cooling
Liquid metals can also be evaporated through small pores and this process can be used to cool a surface, just as in the case of the human body. Depending on whether the heat of evaporation is supplied to the evaporating surface from inside or outside, this is termed "transpiration cooling" or "perspiration cooling". The former is used, in engineering, on rocket nozzles and the heat shields of satellites and may be considered as relatively well understood.
If, on the other hand, it is desired to remove a considerable amount of heat originating from within, another problem arises, namely that of transferring the heat from the inside to the outside without the liquid metal further inside beginning to boil.
For instance, if it is assumed that a rod shaped fuel element (Fig. 8 left) is to be cooled in this way, it can be encased in a porous tube and the annular space filled with liquid metal. As soon as heat is generated in the element, a temperature gradient is set up between the rod centre and the outer surface of the porous tube. When the outside temperature of the porous tube corresponds to the saturation temperature, the liquid diffusing through the porous wall evaporates at the surface without being superheated. This process is currently being further investigated at Ispra. It is especially attractive because it constitutes a selfregulating cooling system (Fig. 8 right).
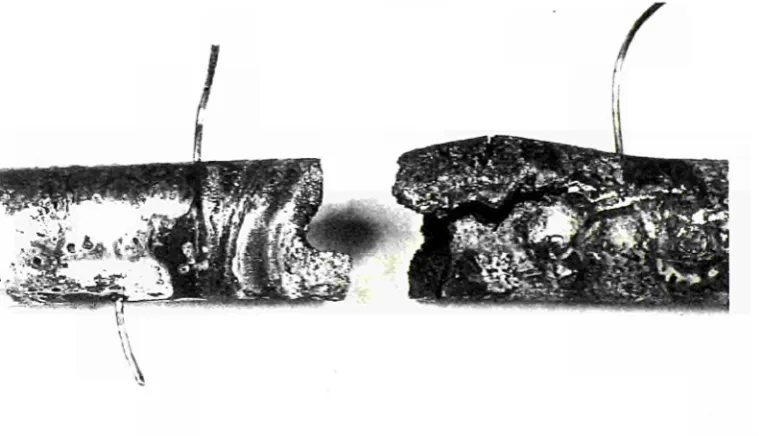
Burn-out
A further problem in connection with the evaporation of alkali metals must finally be mentioned; this is the phenomenon known as burnout. The term burnout is generally used to describe the very rapid rise in the temperature of liquidcooled surfaces following a failure or reduction, for any reason, in their cooling. By extension of this definition, burnout also occurs in the case of separatebubble ejection. During the time of ejection, a coolant channel may be filled temporarily with only vapour instead of liquid. As a rule, a residual film of liquid metal con tinues to adhere to the wall and maintains cooling by evaporation for a varying length
[image:17.595.31.398.96.398.2] [image:17.595.20.395.493.729.2]Fig. 9: Hot spot due to local temperature
excursion.
of time. This film may, depending on the
heat flux, be totally evaporated before fresh
liquid is fed to the surface by a restored
flow or reverse flow. If we define the start of
burn-out as the point in time at which the
residual film of liquid on the heated wall
has just been completely evaporated, then
the ensuing rapid temperature rise can be
equated with the well-known phenomenon
of burn-out.
In the case of liquid metals, therefore, the
presence of a critical heat flux is not a
sufficient indication as to whether or not
burn-out can occur, unlike the well-known
case of boiling water. Fig. 9 shows a hot
spot due to a local temperature excursion
and Fig. 10 an experimental tube after a
burn-out. (EREA-A 7-15)
Bibliography <1) G. GRASS, H. KOTTOWSKI, B. MILLIOT: Beitrag zur Untersuchung des Siedens von Flüssigmetallen bei erzwungener Konvektion. Nukleonik 8, S. 273-282 (1966). (2) G. GRASS, H. KOTTOWSKI, R. WARNSING: Das Sieden von flüssigen Alkalimetallen, ATKE 12-16 (1967), p. 101-110. (3) R. C. NOYES, L. LURIE, A. A. JARRET: The Development and Growth of Incore Voids due to Boiling during Fast Reactor Gradients. Proceedings of the Conference on Safety, Fuelsand CoreDesign inLargeFastPower Reactors, Oct. 11-14 (1965). Argonne National Laboratory, p. 881. (4) W. PEPPLER, E. G. SCHLECHTENDAHL, G. F. SCHULTHEISS, D. SMIDT: Sodium Boiling and Fast Reactor Safety. Report KFK 612, paper presented at the "Conférence internationale sur la sûreté des réacteurs à neutrons rapides, (1967). Aix-en-Provence. (5) A. M. J U D D : Boiling and Con-densation of Sodium in Relation to Fast Reactor Safety. Conférence internationale sur la sûreté des réacteurs à neutrons rapides. Aix-en-Provence. (6) G. GRASS, H. KOTTOWSKI, K. H. SPIL-LER: Measurement of the Superheating and Studies about Boiling Phenomena in Liquid Metals. Conférence internationale sur la sûreté des réacteurs à neutrons rapides. 1967, Aix-en-Provence.
[image:18.595.23.403.488.706.2]The anatomy of biological research in the Community
AN ENQUIRY recently conducted by the Commission of the European Communities has yielded interesting data on the state of research in biology, medicine, and agri-culture in the Common Market countries. The study was carried out under the terms of Article 5 of the Euratom Treaty. During 1966 and 1967, questionnaires were sent to some 2,700 research centres, in-stitutes and departments of the Com-munity. A total of 1,179 replies were received, of which 756 were very detailed.
1. 1 EMA u.a. = 1 US dollar.
Although the overall result was not representative in every respect, a fairly precise picture emerged after analysis of the replies. In particular, the statistical part of the investigation contained data on the personnel and funds available for research in the three sectors under study.
Expenditure per scientist
Figure 1 shows a breakdown of the average expenditure per scientist in the
institutes which answered the questionnaire. This includes not only personnel costs (i.e. the salaries of the scientists themselves, engineers, technicians, assistants, adminis-trative staff, etc.), but also running ex-penses and investment costs.
The most marked difference is seen between the university and research institutes: in all member countries the average expenditure per scientist is much higher in the research institutes.
[image:19.1174.22.1161.326.727.2]On the other hand, regardless of whether
Figure 3: Staff breakdown—relation between scientific personnel and other employees (NB: in some cases no statistical analysis was figure 1: Average expenditure per scientist Figure 2: Average expenditure per person possible).
(in thousands of 'u.a.1) for biology, medicine and engaged in biology, medicine and agriculture
agriculture. (in thousands of u.a.) ft ., . .
' U university institutes
g university institutes
S research institutes
M university institutes
£§ research institutes
U research institutes
a) Biology
institutes were engaged in research into biology, medicine or agriculture, the statistics revealed only slight differences between the various fields. Figure 1 therefore shows merely the overall situa-tion.
Expenditure per employee
In figure 2 also, which shows expenditure per employee, no distinction has been made between the three sectors. Contrary to the average expenditure per scientist, it varies surprisingly little from one member country to another, and (with the exception of French institutes) lies between 4,100 and 5,100 u.a. in university institutes and be-tween 5,900 and 6,300 u.a. in research institutes.
b) Medicine
Composition of staff
Apart from the funds available to the scientist in order to do his job satisfac-torily, the composition of staff in itself is particularly interesting. Figure 3 shows the ratio between scientific personnel and other employees.
Again, one is first struck by the fact that in all cases the research institutes have considerably more staff per scientist than the universities. Actually the figures do not give the complete picture, in the sense that, at the university, a scientist has to spend more time teaching than he does in a research establishment, while his assistants are solely occupied in research work. Besides, the calculations do not take into account any rôle played by the students. It was worth finding out whether there are any significant differences in staff
composi-c) Agriculture
tion between the various sectors. Figure 3 shows that there is hardly any disparity between the scientific research establish-ments working on biology and medicine. In both types of establishment the require-ments, methods and available resources are very similar. However, it was observed that agricultural research requires more assistant personnel than do the other two sectors. Finally, it is worth pointing out the differences from one country to another, particularly in university institutes.
Staff expenses
Staff expenses come under figure 4 and are expressed in terms of average salary per employee. So that these statistics make sense, the personnel breakdown given in figure 3 must be taken into account. Although the number of scientists, and
d) Mean for biology, medicine and
agricul-ture.
Country
Average staff per institute - university institutes - research institutes
Average number of scientists per institute
- university institutes - research institutes
Average expenditure per institute (in thousands of u.a.) - university institutes - research institutes
a
15.8 24.9
7.7 6.4
79 154
D
29.4 90.3
8.3 18.7
121 570
F
27.2 39.9
10.5 11.4
198 283
I
25.3 41.8
7.9 12.8
74 245
NL
34.7 75.7
11.3 13.9
[image:20.595.24.390.77.292.2]177 445
Table 1: The relative size of university and research institutes.
techniques in their research. The number of establishments in the different member countries of the Community which use or are interested in nuclear techniques can not be worked out exactly, because of the lack of information on institutes which did not reply to the questionnaire or did not receive it. However, the percentage of biological, medical and agricultural re-search institutes which are interested in or use nuclear techniques can be put at 20 or 30%.
Among the institutes which filled out the questionnaire, the percentage of those using nuclear techniques varies from country to country between 30 and 4 0 % . Of these, about 70% use these techniques to a limited extent, 20% use them to an extent which may be considered as medium in relation to the institute's other activities, and 10% use them on a large scale or even exclusively. therefore the number of more highly-paid
personnel, is greater, the average salaries are lower in the universities than in the research institutes (except in France).
Other costs
Under this heading are included running expenses and investment costs. Figure 5 shows the other costs as a percentage of the average expenditure per scientist. In the Community countries this percentage is generally between 30 and 50% of the total costs.
Size of institutes
From the angle of attempting to determine the size of the institutes, the concept itself of an institute is somewhat ambiguous owing to the fact that replies were received from vastly different establishments. Thus, in drawing up Table 1, only independent institutes and individual research institutes were taken into account, the larger establishments which administrate these smaller institutes being ignored.
In each Community country, the university institutes differ considerably from the research establishments as regards staff size and overall expenses. On the other hand, the number of scientists in all the countries is, with one exception, virtually the same in both university and research institutes.
The use of nuclear techniques
[image:20.595.217.583.380.712.2]Some of the questions put to these insti-tutes dealt with the importance of nuclear
Figure 4: Average salary per person (mean for biology, medicine and agriculture in thousands of u.a.).
(EREA-A 7-16) Michel GIBB
Figure 5: Breakdown of expenditure (mean for biology, medicine and agriculture).
university institutes Rfflfl] personnel costs
tgjgl running expenses and investment research institutes
personnel costs