Workload Modelling and Elasticity
Management of Data-Intensive
Systems
Alireza Khoshkbarforoushha
A thesis submitted for the degree of
Doctor of Philosophy
The Australian National University
Except where otherwise indicated, this thesis is my own original work.
in collaboration with other researchers.
Journal Papers
• A. Khoshkbarforoushha, A. Khosravian, and R. Ranjan. ”Elasticity manage-ment of streaming data analytics flows on clouds”, Journal of Computer and System Sciences (JCSS), 2016, http://doi.org/10.1016/j.jcss.2016.11.002.
• A. Khoshkbarforoushha, R. Ranjan, R. Gaire, E. Abbasnejad, L. Wang, A. Zomaya, ”Distribution Based Workload Modelling of Continuous Queries in Clouds”, IEEE Transactions on Emerging Topics in Computing (TETC), 5.1 (2017): 120-133.
Conference Papers
• A Khoshkbarforoushha, R Ranjan, ”Resource and Performance Distribution Prediction for Large Scale Analytics Queries”. In Proceedings of the 7th ACM/SPEC on International Conference on Performance Engineering (pp. 49-54). ACM.
• A Khoshkbarforoushha, R Ranjan, Q Wang, C Friedrich, ”Flower: A Data Ana-lytics Flow Elasticity Manager”. Proceedings of the VLDB Endowment 10, no. 12 (2017): 1893-1896.
Apart from the publications above, I published the following papers during my PhD studies, the results of which are not presented in this thesis.
• A Khoshkbarforoushha, M Wang, R Ranjan, L Wang, L Alem, S U Khan, and B Benatallah. ”Dimensions for evaluating cloud resource orchestration frame-works”. Computer, 49(2):24-33, 2016.
Acknowledgments
PhD is an unsurpassed journey with lots of ups and downs. It is my great pleasure to thank those who made this once in the life journey possible. I am indebted to my supervisor, Dr. Rajiv Ranjan for his supports which has started even long before my official PhD commencement, for his superb guidance, and for believing in me at all stages of my PhD. I learnt a lot from him and will never forget his supportive attitude and big heart.
I would like to thank my panel, Professor Alistair Rendell, Peter Strazdins and John Hosking for their valuable comments. I also like to give my special thanks and appreciation to my collaborators Dr. Alireza Khosravian, Dr. Raj Gaire, Dr. Ehsan Abbasnejad, Dr. Prem Prakash Jayaraman, and Dr. Qing Wang for their invaluable comments and discussions we had during my PhD studies. I would also like to acknowledge the academic, technical and financial support of the Data61 CSIRO and Australian National University.
I want to express my gratitudes to a marvellous group of friends in Canberra, Khosro, Mohammad Sara, Fatemeh Sadegh, Mehdi Marzieh, Abbas Nojan, Monaj, Hajar, Morteza Sahba, Mohsen Sara, Mohammad Ladan, Mohammad Sousan, Alireza Zahra, Salim, Ehsan, Ehsan, Fatemeh, Omid, Dash Zahra, Majid Fatemeh, Behrouz Fatemeh, Mousa, Arash Pegah, Mahmoud Mahtab, Meisong, Tony, Miranda, Andy, Matt.
In the end, I would like to thank my wife and family. Words are incapable of expressing my deepest love and appreciation to Masoumeh for her endless supports and encouragements and to Aghajan, Maman, Maryam, Marzieh, Hosein, Yasamin, Baba, Maman, Zahra, Maryam, Hamid, Mohammad.
Abstract
Efficiently and effectively processing large volume of data (often at high velocity) using an optimal mix of data-intensive systems (e.g., batch processing, stream pro-cessing, NoSQL) is the key step in the big data value chain. Availability and af-fordability of these data-intensive systems as cloud managed services (e.g, Amazon Elastic MapReduce, Amazon DynamoDB) have enabled data scientists and software engineers to deploy versatile data analytics flow applications, such as click-stream analysis and collaborative filtering with less efforts. Although easy to deploy, run-time performance and elasticity management of these complex data analytics flow applications has emerged as a major challenge. As we discuss later in this thesis, the data analytics flow applications combine multiple programming models for per-forming specialized and pre-defined set of activities, such as ingestion, analytics, and storage of data. To support users across such heterogeneous workloads where they are charged for every CPU cycle used and every data byte transferred in or out of the cloud datacenter, we need a set of intelligent performance and workload man-agement techniques and tools. Our research methodology investigates and develops these techniques and tools by significantly extending the well known formal mod-els available from other disciplines of computer science including machine learning, optimization and control theory.
To this end, this PhD dissertation makes the following core research contribu-tions: a) investigates a novel workload prediction models (based on machine learn-ing techniques, such as Mixture Density Networks) to forecast how performance parameters of data-intensive systems are affected due to run-time variations in data flow behaviours (e.g. data volume, data velocity, query mix) b) investigates control-theoretic approach for managing elasticity of data-intensive systems for ensuring the achievement of service level objectives. In the former (a), we propose a novel appli-cation of Mixture Density Networks in distribution-based resource and performance modelling of both stream and batch processing data-intensive systems. We argue that distribution-based resource and performance modelling approach, unlike the existing single point techniques, is able to predict the whole spectrum of resource usage and performance behaviours as probability distribution functions. Therefore, they provide more valuable statistical measures about the system performance at run-time. To demonstrate the usefulness of our technique, we apply it to undertake following workload management activities: i) predictable auto-scaling policy setting which highlights the potential of distribution prediction in consistent definition of cloud elasticity rules; and ii) designing a predictive admission controller which is able to efficiently admit or reject incoming queries based on probabilistic service level agreements compliance goals.
In the latter (b), we apply advanced techniques in control and optimization
Contents
Acknowledgments vii
Abstract ix
1 Introduction 1
1.1 Research Motivation and Objectives . . . 2
1.2 Research Challenges . . . 2
1.3 Research Questions and Contributions . . . 3
1.4 Thesis Outline . . . 4
2 Background 7 2.1 Big Data Analytics Ecosystem . . . 7
2.1.1 Data Ingestion Layer . . . 8
2.1.2 Data Analytics Layer . . . 9
2.1.2.1 Batch Processing Systems . . . 9
2.1.2.2 Stream Processing Systems . . . 12
2.1.3 Data Storage Layer . . . 13
2.2 Data-Intensive System Performance Prediction . . . 14
2.2.1 White-box and Black-box Approaches . . . 14
2.2.2 Machine Learning Driven Performance Prediction . . . 15
2.2.2.1 Predicting Performance as a Single Point Value . . . 15
2.2.2.2 Predicting Performance as a Distribution . . . 17
2.3 Elasticity Management of Data Analytics Flows on Cloud . . . 19
2.3.1 Multi-Objective Optimization . . . 19
2.3.2 Elasticity Controller . . . 20
2.4 Summary . . . 21
3 Distribution-Based Resource Usage Prediction of Continuous Queries 23 3.1 Motivation . . . 24
3.2 Approach Overview . . . 25
3.3 Related Work . . . 27
3.4 Resource Usage Prediction . . . 29
3.4.1 Single Continuous Query . . . 29
3.4.2 Concurrent Workload . . . 29
3.4.2.1 Stream Processing Optimizations . . . 30
3.4.2.2 Resource Contention . . . 31
3.4.3 Model Selection . . . 32
3.4.3.1 Mixture Density Networks . . . 33
3.5 Experiment . . . 34
3.5.1 Experimental Setup . . . 34
3.5.1.1 Dataset and Workload . . . 34
3.5.1.2 Training and Testing Settings . . . 37
3.5.2 Evaluation: CPU and Memory Usage . . . 37
3.5.2.1 Error Metrics . . . 37
3.5.2.2 Evaluation Results . . . 39
3.5.3 Training Times and Overhead . . . 41
3.6 Distribution-Based Workload Management . . . 41
3.6.1 Predictable Auto-Scaling Policy Setting . . . 41
3.6.2 Distribution Based Admission Controller . . . 45
3.7 Summary . . . 48
4 Distribution-Based Workload Modelling of Large-Scale Batch Queries 49 4.1 Approach Overview . . . 49
4.2 Related Work . . . 51
4.3 Performance Modelling of Hive . . . 51
4.3.1 Query Execution in HiveQL . . . 52
4.3.2 MDN Technique . . . 52
4.4 Experimental Evaluation . . . 53
4.4.1 Experimental Setup . . . 53
4.4.2 Error Metrics . . . 54
4.4.3 State of the Art Techniques . . . 54
4.4.4 Evaluation: Single Point Estimators . . . 55
4.4.5 Evaluation: Distribution-Based Prediction . . . 56
4.4.6 Training Times and Overhead . . . 58
4.5 Distribution-Based Prediction Utilization . . . 58
4.6 Summary . . . 60
5 Elasticity Management of Data Analytics Flows on Clouds 61 5.1 Challenges in Elasticity Management of Data Analytics Flows . . . 61
5.2 Related Work . . . 62
5.3 Proposed Solution . . . 64
5.3.1 Solution Overview . . . 64
5.3.2 Resource Share Analysis . . . 66
5.3.3 Elasticity Controller . . . 68
5.3.3.1 A Framework for Controller Design . . . 68
5.3.3.2 A Generic Adaptive Controller . . . 69
5.3.3.3 Gain Function (lk) Behavior Analysis . . . 72
5.4 Automated Control of a data analytics flow . . . 74
5.4.1 Data Ingestion Layer Controller . . . 74
5.4.2 Data Analytics Layer Controller . . . 74
Contents xiii
5.5 Experimental Results . . . 76
5.5.1 Experimental Setup . . . 76
5.5.2 Evaluation Results: Optimized Resource Share Determination . 77 5.5.3 Evaluation Results: Adaptive Controller Performance . . . 77
5.5.4 Evaluation Results: Automated Control of the Flow . . . 80
5.6 Summary . . . 82
6 Flower: A System for Data Analytics Flow Management 83 6.1 Related Work . . . 83
6.2 Flower Architecture . . . 85
6.2.1 Resource Share Analysis . . . 85
6.2.2 Resource Provisioning . . . 86
6.2.3 Cross-Platform Monitoring . . . 86
6.3 Flower Workflow . . . 87
6.4 Flower is Action . . . 87
6.5 Summary . . . 92
7 Conclusion 93 7.1 Resource Performance Prediction for Data-intensive Systems . . . 93
7.2 Data Analytics Flow Elasticity Management . . . 94
7.3 Elasticity Management Tool Support . . . 94
List of Figures
2.1 A high-level architecture of the data-driven analytics services. . . 8
2.2 A simple instance of large-scale data stream-processing service. . . 8
2.3 Amazon Kinesis stream architecture. . . 9
2.4 Hadoop architecture. . . 10
2.5 Query processing in Hive. . . 11
2.6 Apache Storm architecture. . . 13
2.7 CPU usage of CurActiveCars query against average arrival rates show-ing the multi-valued mappshow-ing situation from the same input. . . 16
2.8 One hidden layer MLP. . . 17
2.9 MDN approximates distribution parameters, conditioned on the input vector. . . 18
3.1 (a) CPU usage of the query against 500 and 10Ktuple/sec arrival rates. (b) Normalized histogram and KDE fitted to CPU usage of CurActive-Cars query against 10Kdata arrival rate. . . 25
3.2 Sample distribution prediction of CPU usage for NegAccTollStr query. Actual PDF is a fitted KDE function against the actual CPU usage which is used for clarity and comparison with the prediction. . . 26
3.3 Our approach builds an MDN model based on the historical logs of queries to pedict distribution of new incoming workloads. The pre-dicted PDFs are then used for developing two novel workload man-agement strategies: a) Distribution based admission control, and b) Auto-scaling policy setting. . . 27
3.4 Overview of the proposed approach for predicting the resource usage distribution of continuous queries. . . 32
3.5 Best fit of sent tuple per second against different distribution models. The figures contain probability density of average tuple sent per sec-ond for the speed rate of (a) 50Kand (b)100Kfor two different queries. 36 3.6 (a) predicted PDF and the observation (b) schematic sketch of the CRPS as the difference between CDFs of prediction and observation. . . 38
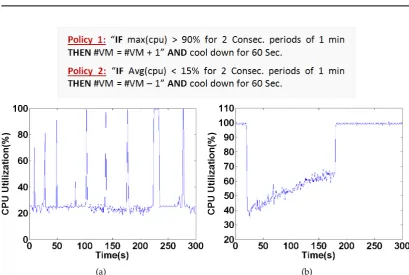
3.7 The CPU utilization of (a) NegAccTollStr and (b) SegToll queries for 5 minutes. The sample auto-scaling policies cause osiliation behaviour in NegAccTollStr workload, since they have been defined irrespective of the workload CPU usage distribution. . . 43
3.8 The probabilities of the randomly generated auto-scaling policies for 12 (out of 32) mixes of test queries. Each query mix evaluated against 4 auto-scaling policies as shown in the form of bright and dark coloured bars. The bright and dark bars within each policy set respectively show the activated and not activated rules at run-time. Our technique has successfully characterized the highly possible policies for all mixes but Mix 4, 8, and 12. . . 45 3.9 The CPU utilization beyond 95% hits the throughput (tuple/sec) of the
query. . . 46 3.10 Single point and distribution based admission controller performance
under different decision making thresholds. In single point case we set t1=25%, t2=45%, t3=65%, and t4= 85%. . . 47 4.1 Two sample predicted distributions for (a) CPU and (b) Execution Time
for a sample input from Q7 of TPC-H. The histograms show respec-tively the actual CPU and Runtime values for 30 different instance queries generated based on template-7 and executed in the cluster. . . . 50 4.2 (a) CPU and (b) Response time prediction for Hive queries, modelled
using the Table 1 feature set. . . 55 4.3 Relative error (%) for (a) CPU and (b) Response time prediction using
SVM, REPTree, and MLP techniques. . . 56 4.4 Sample PDF predictions for (a) CPU and (b) Execution Time of Hive
queries based on TPC-H workload. . . 59 5.1 A data analytics flow that performs real-time sliding-windows analysis
over click stream data. . . 62 5.2 The data arrival rate at the ingestion layer (Amazon Kinesis in Fig.5.1)
is strongly correlated (coefficient = 0.95) with the CPU load at the an-alytics layer (Apache Storm in Fig.5.1). . . 63 5.3 The proposed solution for managing heterogeneous workloads of the
data analytics flows on clouds. . . 65 5.4 a) Input-output linear model, b) Control feedback loop. . . 69 5.5 Gain parameter behavior under different load scenarios. . . 73 5.6 VMs are launched at different time slots so that they are of different
cost to stop. Thus, it is more economical to stop a VM with the mini-mum remaining time. . . 75 5.7 a) Given the 32.25$ daily budget and the dependency between data
ingestion and analytics layer, six optimal solutions are generated. b) Since we have three objectives the Pareto front is a surface in 3d space. 77 5.8 a) The data producer puts the same records to the three identical
Kine-sis streams, regulated by the controllers. b) Our implementation writes three copies of the results to the three identical DynamoDB tables. . . . 78 5.9 The RMSE measures for both a) Kinesis and b) DynamoDB workloads
LIST OF FIGURES xvii
5.10 Throughput QoS for Kinesis workload. . . 79
5.11 Performance comparison of our adaptive controller and the fixed-gain and quasi-adaptive ones in Amazon Kinesis workload management withyr=70%. . . 80
5.12 Performance comparison of our adaptive controllers and the fixed-gain and quasi-adaptive ones in DynamoDB workload management with yr=60%. . . 81
5.13 Adaptive controller’s performance in elasticity management of a) data ingestion (yr=60%), b) analytics (yr=40%), c) and storage (yr =70%) layers of the click-stream analytics flow withlk =0.03 andγ=0.0001. . 82
6.1 Conceptual design of theFlowersystem. . . 84
6.2 Flowerhigh-level architecture. . . 85
6.3 All-in-one-place visualizer user interface. . . 86
6.4 The high-level sequence diagram of how to run an elasticity controller inFlower . . . 88
6.5 Flower’s flow builder interface . . . 89
6.6 Elasticity flow configuration interface . . . 89
6.7 Elasticity service control and monitoring interface . . . 90
List of Tables
3.1 Feature input for training model. . . 30
3.2 Trained classifiers performance as per LRB workload. . . 40
3.3 Trained classifiers performance as per LRB Mix Workload. . . 40
3.4 Trained classifiers performance as per TPC-H workload. . . 40
3.5 Training times in seconds as regards to different workload sizes for 1K iterations. . . 41
4.1 Feature set for resource modelling of Hive queries. . . 53
4.2 MDN performance compared with its competitors. . . 57
4.3 Training times in seconds with regard to different workload sizes for 500 iterations. . . 58
5.1 List of key notations used in this chapter. . . 67
Chapter1
Introduction
Data-driven products and services are revolutionizing nearly every aspect of our lives ranging from enterprises to consumers and science to government, and now are the fundamental part underpinning real-time decision making by transforming insights to value. In this regard, efficiently and effectively processing large volume of batch or streaming data using a chain of data-intensive systems is the key step in the big data value chain [39]. For example, by analyzing data using data analytics flows, real-time situational awareness can be developed for handling events such as natural disasters and major traffic incidents. Similarly, online retail companies can offer dynamically priced and customized product bundles using data analytics flows that process real-time click stream data and up-to-the minute inventory status on the fly.
Data analytics flows typically operate on three layers including ingestion, analyt-ics, and storage [106, 83]. The data ingestion layer accepts data from multiple sources such as online services or back-end system logs. The data analytics layer consists of many platforms including stream or batch processing systems, and scalable machine learning frameworks that ease implementation of data analytics use-cases such as col-laborative filtering and sentiment analysis. The ingestion and analytics layers make use of different databases during execution and where required persist the data in the storage layer.
Recent analysis of cloud providers’ service portfolios [74] shows that the num-ber of data-intensive systems within each layer offered as cloud managed services (e.g, Amazon Elastic MapReduce [4], Amazon Kinesis Streams [5], Microsoft Azure HDInsight [18], Google BigQuery [17]) has surged. Because, they are well appreci-ated by the users, releasing them from the hassle of platforms or cluster setup and maintenance. Availability and affordability of these cloud services have enabled data scientists and software engineers to easily build versatile data analytics flow appli-cations. Although easy to orchestrate and create, their workload management is a challenge.
1
.
1
Research Motivation and Objectives
To architect a cloud-hosted data analytics flow, a mix of data-intensive systems are needed as a number of studies [81, 76] have already reported performance problems induced by following the ”one size fits all” notion. Therefore, data analytics flows are built via orchestrating data processing systems across a network of unlimited computing and storage resources.
To support users across such complex heterogeneous workloads where they are charged for every CPU cycle used and every data byte transferred within the cloud, we need a set of performance and workload management policies and mechanisms. Our hypothesis is that with the right set of techniques and tools from machine learn-ing, optimization and control theory, complex data analytics flows can be managed automatically for enabling different service level objectives.
In recent years, numerous studies [51, 82, 96, 90, 111] have shown the benefits of adapting concepts and tools from statistical machine learning, optimization and control theory in workload management of data-intensive systems. This study aims to take the next step in performance modelling and workload management of data-intensive systems by: a) investigating and adapting new class of machine learning techniques in performance and workload management, b) enhancing the existing resource management techniques and tailoring them for a chain of data-intensive systems as required by the data analytics flows.
1
.
2
Research Challenges
Workload management operations including a) resource and performance prediction, b) optimal resource share analysis, and c) accurate and timely resource provisioning for the data analytics flow applications are highly challenging given the following unique characteristics of data analytics services.
Changing resource and performance behaviour. The data analytics flow ap-plications often deal with immense data volume which, together with uncer-tain velocity of data streams, leads to changing resource consumption patterns. This mandates resource management techniques that could sustain workload fluctuations time efficiently.
Heterogeneity of workloads. In big data analytics workloads, a typical data analytics flow consists of multiple processing tasks, each of which is executed using different data processing platforms (e.g. batch/stream processing frame-works, NoSQL) across a cluster of machines. In this context, performance and cost optimized elasticity management of a data analytics flow is problematic due to the heterogeneity of the workloads pertaining to different platforms with different performance and cost measures.
§1.3 Research Questions and Contributions 3
compute servers and storage throughputs capacity, each of which exhibits dif-ferent performance behaviours and difdif-ferent pricing schemes. In this setting, resource allocation techniques need to cater for diverse resource requirements and their associated cost dimensions to meet the users’ Service Level Objectives (SLOs).
1
.
3
Research Questions and Contributions
To achieve the objectives stated in Section 1.1, we formulate three research questions that are addressed in this thesis.
(I) How can we predict the resource and performance distribution of data-intensive workloads? More specifically:
(i) How can we predict the resource usage distribution of centralized stream processing workloads?
(ii) Is the distribution-based workload modelling approach applicable to re-source management problems of stream processing systems?
(iii) How can we predict the resource and performance distribution of large scale analytics queries?
(II) How to satisfy the performance objectives of a data analytics flow application despite its dynamic runtime workload? More specifically:
(i) What share of different resources does each layer of a data analytics flow need to operate, given the budget constraints?
(ii) How would we cope with the variable resource requirements across the layers for handling variation in volume and velocity of the data analytics flow?
(III) How to design and implement a holistic elasticity management system for the data analytics flows? More specifically:
(i) How to implement a resource share analyser module?
(ii) How to implement an adaptive control system and tailor it to the inges-tion, analytics and storage layer of the data analytics flow?
(iii) How to design and implement a holistic monitoring module that could operate across the layers of the data analytics flows?
• Introducing a new distribution-based performance modelling technique for batch and stream processing systems. The proposed approach is based on the statistical machine learning techniques and is easy to adapt to a wide variety of systems modelling problems. To demonstrate the usefulness of the distribution-based workload modelling, we also design and implement two workload man-agement mechanisms including i) predictable auto-scaling policy setting; and ii) predictive admission controller. In the former, we put forward the claim that the workload behaviour distribution prediction provides reliable information enabling consistent auto-scaling policy setting in public clouds. In the latter, we experimentally take the first step towards developing an admission control which is able to react as per the probabilistic service level agreements (SLAs). These contributions have been published in [70, 71].
• Investigating the problem of multi-layered resource allocation of complex data analytics flows deployed on public clouds. For this purpose, we present a meticulous dependency analysis of the workloads along with the mathematical formulation of the problem as per the data ingestion, analytics, and storage layers of a data analytics flow. We then design and implement a new adaptive control framework by employing tools from classic nonlinear control theory for dynamic provisioning of data analytics flows. The proposed control systems is able to continuously detect and self-adapt to workload changes for meeting users’ SLOs. This contribution has been originally published in [69].
• Designing and implementing a system calledFlowerfor holistic elasticity man-agement of data analytics flows on clouds. Flower provides the user with a suite of rich functionalities including workload dependency analysis, optimal resource share analysis, dynamic resource provisioning, and cross-platform monitoring. This contribution has been published in [73].
1
.
4
Thesis Outline
ana-§1.4 Thesis Outline 5
Chapter2
Background
This chapter provides required background about well-established theories, tech-niques and technologies which are used in this thesis. In this regard, we first explore a number of major data-intensive systems in big data analytics ecosystem in Section 2.1. We then discuss about the usage of statistical machine learning techniques in workload performance modelling of data-intensive systems in Section 2.2. We finally discuss about the elasticity management of data-intensive workloads on clouds in Section 2.3.
2
.
1
Big Data Analytics Ecosystem
As we delve deeper into the digital universe, we are witnessing explosive growth in the variety, velocity, and volume of data being transmitted over the Internet. This data are generated mainly from Internet search, social media and mobile devices [97].
Such big data sets are too complicated to be managed and processed by con-ventional data processing platforms including relational databases and data mining frameworks. In response, a mix of large-scale data processing platforms - also known as data-intensive systems - are used. These systems can be categorized in three lay-ers including ingestion, analytics, and storage as per the specific types of workloads and functionalities as shown in Fig. 2.1. More specifically, Fig. 2.2, illustrates an instance of a large-scale data stream processing service, where Apache Kafka [10] serves as a high-throughput distributed messaging system, Apache Storm [12] as a distributed and fault-tolerant real-time computation, and Apache Cassandra [6] as a NoSQL Database. It is worth mentioning that some of the platforms are able to play roles in more than one layer. For example, Amazon Kinesis [5] and Apache Kafka as distributed message queueing systems can also be used in data analytics layer in order to provide real-time data analytics and stream processing.
These systems are often available as cloud managed services 1. Because, cloud
1Managed cloud services, unlike unmanaged ones, do not require the user to take care of issues like
how the service responds to changes in load, errors, and situations where resources become unavailable. For example, AWS EC2 is an unmanaged service whereas AWS DynamoDB or AWS RDS are fully manged solutions.
Figure 2.1: A high-level architecture of the data-driven analytics services.
Figure 2.2: A simple instance of large-scale data stream-processing service.
resources are a natural fit for processing data-intensive workloads as they allow the underlying parallel distributed programming and database frameworks to run at a scale in order to handle uncertain data volume and velocity. However, big data systems provide many configuration options which often significantly impact their performance. To understand and predict the effect of configuration options, novel techniques need to be investigated and proposed for cloud services.
2.1.1 Data Ingestion Layer
Data ingestion layer accepts data from multiple sources such as website click streams, financial transactions, social media feeds, IT infrastructure log data, and location-tracking events. In this layer, distributed message queuing frameworks such as Amazon Kinesis and Apache Kafka, provide a powerful set of primitives for reli-able, high-throughput and low-latency queuing of real-time data streams.
§2.1 Big Data Analytics Ecosystem 9
Figure 2.3: Amazon Kinesis stream architecture.
Kinesis is a high-throughput streaming data platform that enables rapid and con-tinuous data intake and aggregation. The core concept of Kinesis is stream, an or-dered sequence of data records. The data records in the stream are distributed into shards. In other words, a stream is composed of one or more shards as shown in Fig. 2.3. Each shard provides a fixed unit of capacity.
The data capacity of the stream is determined by the number of shards that are provisioned for the stream. As the data rate increases, more shards need to be added to scale up the size of the stream. In contrast, shards can be removed as the data rate decreases. Kinesis as a cloud managed service provides all the infrastructure, storage, networking, and configuration required to transparently handle the shard provisioning process. Nevertheless, specifying the right number of shards as per the incoming data rates and volume is left to the user.
2.1.2 Data Analytics Layer
Data analytics layer consists of many systems such as stream, batch processing sys-tems and scalable machine learning frameworks that ease implementation of data analytics use cases such as collaborative filtering and sentiment analysis. These use cases typically make necessary to get both batch and stream processing platforms to work side by side. For example, in Lambda architecture [88] - as one of the main big data processing architecture - to balance between latency and throughput both batch and stream processing platforms are simultaneously used to provide respec-tively comprehensive and real-time views of batch and streaming data. These views are then joined before presentation.
2.1.2.1 Batch Processing Systems
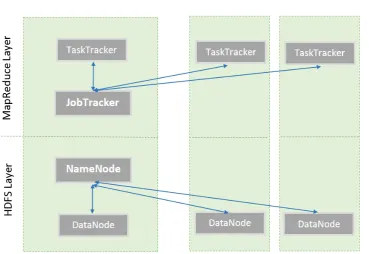
Figure 2.4: Hadoop architecture.
systems, unlike stream processing platforms, are not meant to have low response time and latency. In the subsequent subsection we will briefly present two of the main batch processing platforms in the big data ecosystems, Apache Hadoop [8] and Hive [9].
Apache Hadoop
Apache Hadoop is an open-source framework used for distributed storage and processing of large datasets. Hadoop has two main components including MapRe-duce and Hadoop Distributed File System (HDFS) which are inspired by Google papers on their MapReduce [40] and the Google File System (GFS) [52].
HDFS has a master/slave architecture. It has two key software components: Na-meNode and DataNode. NaNa-meNode as a master keeps track of which blocks make up a file and where they are stored, and DataNodes as slaves keep the actual data, one or more blocks of data. Similarly, MapReduce has a master/slave architecture and it has JobTracker and TaskTracker as the main software components. JobTracker as a matser schedules the jobs’ component tasks on the slaves, monitors them and re-executes the failed tasks. TaskTrackers as slaves executes the tasks as directed by the master. Typically the compute nodes and the storage nodes are the same, that is, the MapReduce and the HDFS are running on the same set of nodes as shown in Fig. 2.4.
§2.1 Big Data Analytics Ecosystem 11
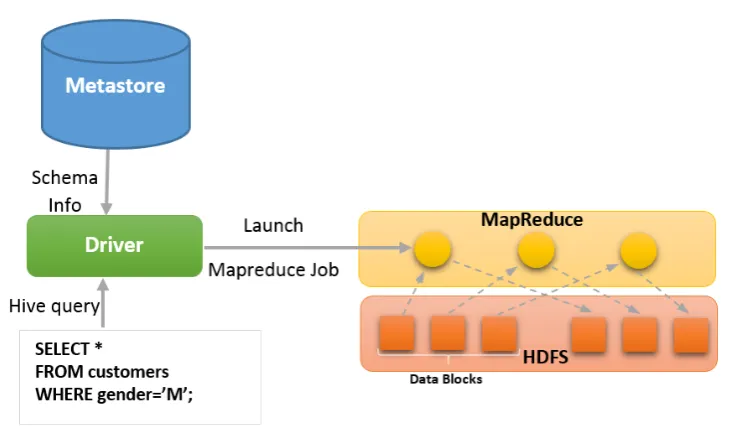
Figure 2.5: Query processing in Hive.
as a series of key-value pairs which are processed by a number of map tasks in paral-lel. The map functions execute the predefined logic and output resultant temporary data as a set of key-value pairs which are then fed into reduce function to perform aggregation and collect the final set of results.
Apache Hive
Although MapReduce concept is simple, writing MapReduce programs in proce-dural languages such as Java, Scala and Python is not approachable for anyone. In response and to facilitate querying the data resides on HDFS, Hive was introduced by Facebook [107]. Apache Hive is a data warehouse infrastructure built on top of Hadoop that facilitates querying and managing large datasets residing in distributed storage. It provides a mechanism to project structure onto this data and query the data using a SQL-style language, HiveQL. HiveQL is a language that allows software engineers and more importantly data scientist write analytics queries in a declarative way.
2.1.2.2 Stream Processing Systems
The early efforts for processing streaming data started since 2000 with different re-search projects such as NiagaraCQ [36] and Cougar [32]. These systems shaped the grounds for today’s centralized Stream Processing Engines (SPEs) such as Es-per [15], Odysseus [23] and Oracle Complex Event Processing (CEP) [19]. However, increasing volume of data stresses the need for scalable frameworks that support dis-tributed or parallel-disdis-tributed computation of data streams. Because, the centralized in-memory stream processing systems would no longer be sufficient for real-time computation of huge amounts of streaming data.
In centralized architecture all the query computations and state management are handled in-memory and the granularity of parallel execution tasks are as big as distinct queries which are deployed at multiple SPE instances. In distributed ap-proach, different operators belonging to the same query are executed at different SPE instances, whereas in parallel-distributed approach even a single operator can be executed in parallel via multiple SPE instances. Evidently, parallel-distributed architecture promises thoroughly scalable systems comparing to the others [55]. In the subsequent subsections we will briefly present Oracle CEP as a centralized and Apache Storm as a parallel-distributed stream processing systems.
Oracle CEP
Oracle CEP is a centralized in-memory stream processing system designed to support event-driven applications such as algorithmic trading, security and fraud detection. In fact, Oracle CEP is a high performance continuous query engine for fast processing of streaming data. For this purpose, it offers a Continuous Query Language (CQL) similar to SQL with added constructs that supports filtering, cor-relation, and aggregation of streaming data from one or more streams. Using CQL, one can query data streams to perform complex event processing.
Apache Storm
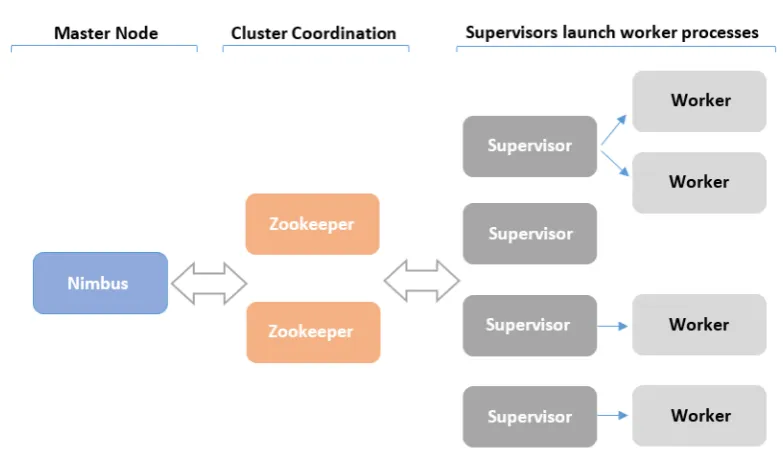
Apache Storm [12] is a distributed fault-tolerant system for processing stream data at scale. A Storm cluster is superficially similar to a Hadoop cluster, whereas on Hadoop jobs are spawned across the cluster, on Stormtopologies. Unlike Hadoop jobs, a topology processes messages forever, unless it is killed. Storm cluster consists of the master node and the worker nodes which are coordinated by Apache ZooKeeper [14], Fig. 2.6.
The master node runs a daemon called Nimbus which is responsible for dis-tributing code around the cluster, assigning tasks to machines, and monitoring for failures. Each worker node runs a daemon called the Supervisor that listens for work assigned to its machine and starts and stops worker processes as necessary based on what Nimbus has assigned to it. The Nimbus and Supervisor daemons are fail-fast and stateless as all the states are kept in Zookeeper or on local disk.
§2.1 Big Data Analytics Ecosystem 13
Figure 2.6: Apache Storm architecture.
directly from an API and emit a new transformed stream. A bolt consumes input streams, does some processing such as running functions, filtering, aggregations, joins, and possibly emits new streams. Networks of spouts and bolts are packaged into a topology that is submitted to Storm clusters for execution. A topology is a graph of stream transformations where each node is a spout or bolt and edges indi-cate which bolts are subscribing to which streams.
2.1.3 Data Storage Layer
Data storage layer consists of next-generation database systems for storing and in-dexing final as well as intermediate datasets. NoSQL database frameworks, such as Cassandra [6] and Amazon Dynamo [3], along with elastic cashing systems are the major storage systems at this layer.
DynamoDB
DynamoDB [3] is a NoSQL database system that provides a scalable architecture for managing key-value and document data structures. In key-value data structure, given the exact key, the value is returned. This well-defined data access pattern results in better scalability and performance predictability that is suitable for storing and indexing real-time streams of big datasets. DynamoDB as a document store supports querying and updating items in a document format such as JSON, XML, and HTML.
capacity as the table size grows. However, specifying the right size of provisioned throughput (i.e. read or write capacity units) for a particular table to handle the workload dynamics is left to the user.
2
.
2
Data-Intensive System Performance Prediction
System performance prediction is central to the design and development of various workload management strategies such as:
• System resizing: dynamic provisioning of resources such as CPU, Memory and Network as per the workload changes.
• Workload scheduling: reordering and scheduling different jobs and queries.
• Admission control: admitting or rejecting an incoming workload.
As discussed in Section 1.2 performance prediction and workload management across multiple big data systems is a challenging task due to a) changing resource consumption pattern and performance behaviour, b) heterogeneity of workloads, and c) diversity of involved cloud resources. In this section, we will discuss different approaches in workload performance modelling and motivate the needs for a new class of techniques in order to improve workload management.
2.2.1 White-box and Black-box Approaches
System performance modelling and prediction techniques broadly use either white-box, black-white-box, or combination of both approaches. In white-box modelling, perfor-mance models are built based on the understanding of the internals of the system, its components and their interaction with each other and with operating system mod-ules. For example, in [29], the authors use Actor Model theory to build analytical performance models for Apache Storm.
In black-box approach, the system is given as a black-box and the performance model is built based on the relationship between the system input workload and configuration features and output performance or resource usage. Black-box models are primarily developed using Machine Learning (ML) techniques which involves four steps: i) initial feature set identification, ii) ML model selection, iii) feature selection, and iv) training and testing.
§2.2 Data-Intensive System Performance Prediction 15
In this thesis, we use black-box approach in workload performance modelling of two major platforms in the big data ecosystem. Because, even though white-box ap-proaches do not need training data and unlike sophisticated statistical models, they are easy to understand and offer a higher extrapolation power, developing, enhanc-ing and maintainenhanc-ing analytical models for ever-changenhanc-ing data-intensive systems is quite challenging.
2.2.2 Machine Learning Driven Performance Prediction
In recent years, different statistical ML techniques such as multilayer perceptron (MLP) [99], Kernel Canonical Correlation Analysis (KCCA) [26], regression trees [33], and Support Vector Machines (SVM) [104] have been used for system resource usage and performance prediction.
We argue that these techniques are inadequate for performance prediction of data-intensive systems. Because these systems deal with immense data volume which, together with uncertain velocity of data streams, leads to changing resource consumption patterns. However, the classic statistical ML techniques are only able to model the statistical properties of data generator as a conditional average which is aSingle-point Value. This means that if the data has a complex structure, for example it is a one-to-many mapping, then these techniques are not able to model the whole spectrum performance behaviour [31].
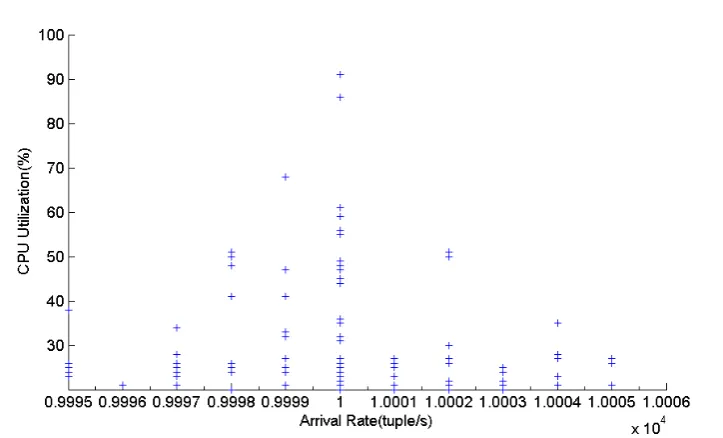
For example, consider Fig. 2.7 which shows the scatter plot of CPU usage against average data arrival rates for CurActiveCars continuous query from Linear Road Benchmark [25]2. The figure clearly illustrates the multi-valued mapping point, meaning that for the same data arrival rate such as 10K (tuple/second) there are multiple CPU usage values which range from 20 to 90 percent. Therefore, the con-ditional distribution - which can be visualized by considering the density of points along a vertical slice through the data - for many input values such as 10Kor 9998 is multi-modal. Such a multi-modality can be poorly represented by the conditional av-erage. Therefore, we need the techniques that could capture the multi-modal nature of the target data as probability distribution functions.
To address the issue above, in this thesis we introduce distribution-based per-formance prediction techniques as superior predictors compared to single point techniques for data-intensive workloads. In the subsections below, we will discuss various single-point estimator techniques and also briefly discuss our proposal in distribution-based performance prediction.
2.2.2.1 Predicting Performance as a Single Point Value
In this section, we briefly explore prominent ML algorithms used in this thesis as baseline competing techniques to distribution-based ones.
2This result is based on one of the experiments conducted on Linear Road Benchmark. The complete
Figure 2.7: CPU usage of CurActiveCars query against average arrival rates showing the multi-valued mapping situation from the same input.
Multilayer Perceptron
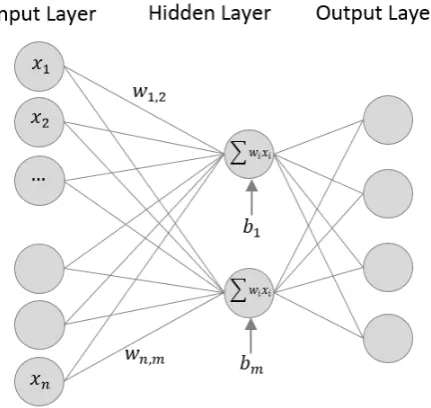
An MLP [99] is a feedforward Artificial Neural Network (ANN) model. An MLP is a multi-layer network of simple neurons called perceptrons that forms a directed graph. Given a set of input features and a target, an MLP approximates the output by forming a linear combination using the input weights and putting the output through some activation function. In mathematical terms, it can be formulated as:
y= ϕ
n
∑
i=1
(wixi+b) = ϕ(WTX+b) (2.1) where wdenotes the vector of weights, x is the input vector, bis the bias and ϕ is the non-linear activation function.
An MLP network typically consists of an input layer, one or more hidden layers and anoutput layer as shown in Fig. 2.8. The input layer consists of a set of neurons
{xi|x1,x2, ...,xn} representing the input features. Each neuron in the hidden layer
transforms the values from the previous layer with a weighted linear summation w1x1+w2x2+...+wnxn, followed by a non-linear activation function such as the
logistic sigmoid 1/(1+e−x) or the hyperbolic tangent tanh(x). The output layer transforms the received values from the last hidden layer into output values.
The MLP has the ability to learn non-linear models. However, building an MLP model requires a fair amount of tuning. Because, there are a number of hyper-parameters such as the number of hidden neurons, layers, and iterations that need to be specified beforehand.
Decision Tree Learning
§2.2 Data-Intensive System Performance Prediction 17
Figure 2.8: One hidden layer MLP.
for predictive modeling. Prediction trees have two variants, classification trees and regression trees. When the target variable takes a finite set of categorical values we use classification trees to identify the classes that a target variable likely belongs to. Regression trees are for dependent variables that takes continuous values.
In this method, the models are built by recursively partitioning the data space into smaller regions and fitting a simple prediction model within each partition. Prediction trees can be graphically represented as decision tree [84] where each node represents a partition, attached to it a simple model which applies in that partition only [59].
In the scope of this thesis, we use REPtree method [46]. REPtree is a standard tree model that has been utilized by the existing workload prediction techniques [116]. This method partitions the feature space in a top-down and non-linear fashion and builds a decision tree using information gain. It then prunes the tree using reduced-error pruning [46].
Support Vector Machines
Support vector machines are a set of supervised learning models used for classifi-cation, regression and outlier detection. SVMs are very effective in high dimensional data spaces and they are flexible in the sense that different kernel functions can be specified for the decision function. In this thesis, we use a regression variant of SVMs as it has been utilized by the existing workload prediction techniques [22].
2.2.2.2 Predicting Performance as a Distribution
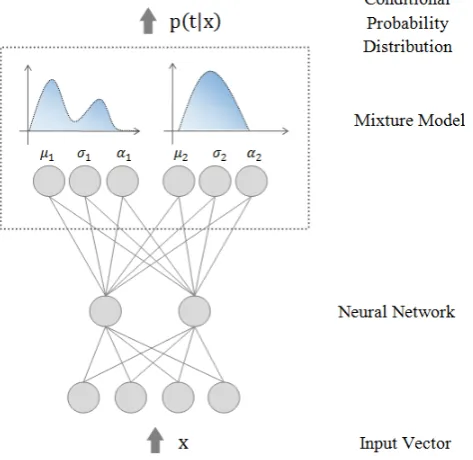
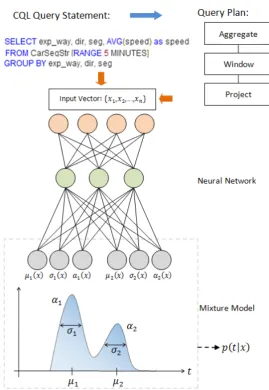
Figure 2.9: MDN approximates distribution parameters, conditioned on the input vector.
available to predict the probability density functions (PDFs). In this thesis, we inves-tigate the MDN to predict resource usage and performance of both batch and stream processing workloads.
Although MDN has been introduced two decades ago, it is still one of the best-performing conditional density estimator [105]. More importantly, the benefit of using MDN is due to its ability to model unknown distributions as exhibited by data-intensive system workloads [37]. In addition, it has already been successfully applied in other domains such as speech synthesis, wind speed and power forecasting.
Mixture Density Networks
MDN is a special type of ANN, in which the target is represented as a conditional probability density function. The conditional distribution represents a complete de-scription of data generation. A classic MDN fuses a Gaussian mixture model (GMM) with MLP. In MDN, the distribution of the outputs t is described by a parametric model whose parameters are determined by the output of a neural network, which takes xas inputs.
Fig. 2.9 gives an overview of MDN in which the neural network is responsible for mapping the input vector x to the parameters of the mixture model (αi,µi,σ2), which in return provides the conditional distribution. An MDN, in fact, maps input features x to the parameters of a GMM: mixture weights αi, mean µi, and variance
§2.3 Elasticity Management of Data Analytics Flows on Cloud 19
2
.
3
Elasticity Management of Data Analytics Flows on Cloud
In recent years, numerous large-scale data processing platforms have been offered as cloud managed services such as Kinesis, Elastic MapReduce and DynamoDB. The selling point of these services is having infinite elasticity feature which allows them to adapt to workload changes by provisioning and de-provisioning resources to match the demand as closely as possible [61].
Cloud managed services are able to adapt to the workload changes either manu-ally or automaticmanu-ally, such as acting appropriately when some threshold is reached. Manual adaptation does not provide any autoscaling facility; in the best case, the service alerts the administrator through an email of the need to manually configure the instances to adapt to new conditions. Services with automatic adaptation will adapt to exceptions through the use ofreactiveandpredictivetechniques [49].
Reactive techniques respond to events only after reaching a predefined threshold that is determined through monitoring the state of hardware and software resources. Although these techniques are simple to define and implement (nothing more than if-then-else statements), they are not sufficient to ensure SLOs in some cases, such as during a peak demand for resources.
Predictive techniques can dynamically anticipate and capture the relationship between an application’s SLO targets, current hardware resource allocation, and changes in application-workload patterns to adjust hardware allocation. Overall, predictive techniques build on the integration of theoretical workload prediction and resource performance models. Workload prediction models forecast workload be-havior across applications in terms of CPU, storage, I/O, and network bandwidth requirements.
In recent years several reactive and predictive provisioning techniques [110, 98, 101, 34] have been proposed with focus on traditional web applications. None of these techniques are capable of provisioning big data processing platform across multiple cloud resources while ensuring strict guarantees on performance targets. Some recent techniques have been proposed for automated provisioning of individ-ual platforms such as NoSQL database [75], distributed streaming systems [55], batch processing systems [82], while largely ignoring an end-to-end provisioning needs as required by big data analytics flow applications.
In response, we propose a holistic elasticity management system that exploits ad-vanced optimization and control theory techniques to manage elasticity of complex data analytics flows on clouds. In the following subsections, we explore the basics of the multi-objective optimization and feedforward control theories.
2.3.1 Multi-Objective Optimization
conflicting objective functions [89]. Mathematically it can be written as: max(f1(x),f2(x), ...,fn(x))
s.t. x∈ X (2.2)
where the variablen ≥2 is the number of objectives and the setX is the feasible set of solutions.
In multi-objective optimization, there does not typically exist a solution that min-imizes or maxmin-imizes all objective functions simultaneously. Thus, attention is paid to Pareto optimal solutions; those that cannot be improved in any of the objectives without degrading at least one of the other objectives. This important concept is called domination [28]. Put formally, a solution x1 ∈ X is said to dominate another solutionx2∈ Xif:
1. ∀i∈ {1, 2, ...,n}: fi(x1)≥ fi(x2)and
2. ∃i∈ {1, 2, ...,n}: fi(x1)> fi(x2)
Quite simply, this definition implies thatx1is Pareto optimal if there exists no feasible vector of decision variables ~xi ∈ ~R which would increase some criterion without
causing a simultaneous decrease in at least one other criterion. Therefore, solving a multi-objective problem would not end up with a single solution, but rather a set of solutions called the Pareto front.
2.3.2 Elasticity Controller
Elasticity and auto-scaling techniques have been studied extensively in recent years [85]. Different techniques such as Control theory [86], Queueing theory [109], Fuzzy logic [117], Markov decision process [75] have been applied to tackle the problem with respect to different resource types such as Cache servers [64], HDFS storage [82], or VMs [48]. However, recent studies in resource management using control theory [82, 86, 65, 66] have clearly shown the benefits of dynamic resource alloca-tions against fluctuating workloads. What makes the control theory approach stands out in workload management techniques is the fact that it neither relies on any prior information about the workload behavior nor does it impose any strong assump-tions on the system model (e.g. as in queueing model). Such features lead to a simple yet effective approach that would sustain any workload’s shape and dynam-ics. Therefore, in this thesis, we propose a framework for design and asymptotic stability analysis of adaptive controllers by employing tools from classic nonlinear control theory. We further design and tailor adaptive controllers for different layers across a data analytics flows.
§2.4 Summary 21
controllers [42]. In this thesis, we propose a noveladaptive controller which is based upon the basics of the feedback control systems as discussed next.
A feedback control is mathematically defined as:
u(t) =u0+Lc∗e(t), (2.3)
whereu(t)represents the controller output,u0represents the input, Lcrepresents
the controller’s gain, ande(t) =yr−yrepresents the error. The control objective is to
design the control inputu0 such that the outputu(t)remains bounded for all times and converges to a reference (desired) constant valueyr∈Rastgoes to infinity.
2
.
4
Summary
In this chapter we discussed background information about well-established con-cepts, techniques and technologies used in this thesis. In this regard, we introduced a number of data-intensive systems including Kinesis, Hadoop, Hive, Storm, Oracle CEP and DynamoDB. We discussed the roles and the main functionalities of these systems in terms of typical data ingestion, analytics and storage layers.
Chapter3
Distribution-Based Resource Usage
Prediction of Continuous Queries
Efficient resource consumption estimation in response to a query processing task is central to the design and development of various workload management strategies such as dynamic provisioning, workload scheduling, and admission control [27, 116]. All of these strategies typically possess a prediction module which can provide ac-curate estimations guidance on run-time operations such as adding more resources, reordering query execution, or admitting or rejecting an incoming query.
The data stream processing workload mainly consists of registered continuous queries and data arrival rate distribution models. The key to proper exploitation of elasticity is to have intelligence to predict how changing data velocity and mix of con-tinuous queries will affect the performance of the underlying virtualized resources (e.g. CPU). Therefore, building resource usage estimation for continuous queries is vital, yet challenging due to: (i) variability of the data arrival rates and their distribu-tion models, (ii) variable resource consumpdistribu-tion of data stream processing workload, (iii) the need to process different mixes of continuous queries, and (iv) uncertainties of the underlying cloud resources.
These complexities challenge the task of efficiently processing such streaming workloads on cloud infrastructures where users are charged for every CPU cycle used and every data byte transferred in and out of the datacenter. In this context, cloud service providers have to intelligently balance between various variables including compliance with Service Level Agreements (SLAs) and efficient usage of infrastruc-ture at scales while handling simultaneous peak workloads from many clients.
In this chapter, we address first (i) and second (ii) part of the research question (I) as specified in Section 1.3. To this end, we present a novel approach of using mixture density networks to estimate the whole spectrum of resource usage as probability density functions. We evaluate our technique using the Linear Road Benchmark (LRB) [25] and TPC-H [20] in both private and public clouds. We also demonstrate the efficiency and applicability of the proposed approach via two novel applications: i) predictable auto-scaling policy setting which highlights the potential of distribution prediction in consistent definition of cloud elasticity rules; and ii) a distribution based admission controller which is able to efficiently admit or reject incoming queries
based on probabilistic service level agreements compliance goals.
3
.
1
Motivation
Recent work has studied SQL query resource estimation and run-time performance prediction using machine learning (ML) techniques [22, 50, 80]. These techniques treat the database system as a black box and try to predict based on the training dataset provided. These techniques offer the promise of superior estimation accuracy, since they are able to account for factors such as hardware characteristics of the systems as well as interaction between various components. All these techniques approximate resource usage for each query as a single point value.
Unlike standard SQL queries that may (not) execute multiple times (often each execution is independent of the previous one), continuous queries are typically reg-istered in stream processing systems for a reasonable amount of time and streams of data flow through the graph of operators over this period. Rapidly time-varying data arrival rates and different query constructs (e.g. time and tuple-based windows) cause the resource demand for a given query to fluctuate over time. To illustrate how streaming workload resource demands fluctuate with time, we executed the follow-ing simple CurActiveCars query from the linear road benchmark:
SELECT DISTINCT car_id
FROM CarSegStr [RANGE 30 SECONDS];
Fig. 3.1(a) illustrates the CPU usage for this query against two different arrival rates: 500 tuple/sec and 10K tuple/sec. As expected, the data arrival rates affect the stream processing system resource demand drastically over time. For example, the fitted Probability Density Function (PDF) of the CPU usage for the query (Fig. 3.1(b)), shows that even though the query is highly likely to consume between 20% and 35% CPU, we need to allow for possible peak demands (i.e. 90%) to avoid a performance hit. Under these circumstances, how can we address questions such as: How much memory and CPU share will the query require if the arrival rates double? or What would be the shape of CPU usage for more complex queries?
For problems involving the prediction of continuous variables (e.g. resource con-sumption), the single point estimation which is, in fact, a conditional average, pro-vides only a very limited description of the properties of the target variable. This is particularly true for a data stream processing workload in which the mapping to be learned is multi-valued and the average of several correct target values is not necessarily itself a correct value. Therefore, single point resource usage estimation [22, 50, 80] is often not adequate for streaming workload, since it is neither expressive enough nor does it capture the multi-modal nature of the target data.
§3.2 Approach Overview 25
(a) (b)
Figure 3.1: (a) CPU usage of the query against 500 and 10K tuple/sec arrival rates. (b) Normalized histogram and KDE fitted to CPU usage of CurActiveCars query
against 10Kdata arrival rate.
mixture density network (MDN) [31], which approximates the probability distribu-tion over target values.
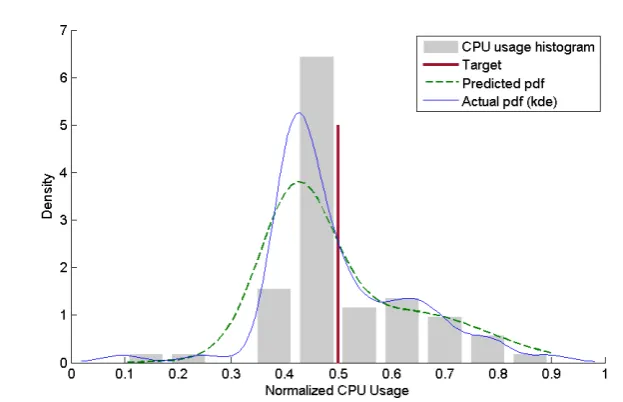
To illustrate one of the possible advantages of using the proposed approach, con-sider Fig. 3.2. It displays a sample predicted PDF and actual CPU usage in terms of normalized histogram and fitted Kernel Density Estimation (KDE) for one of the ex-periments on linear road benchmark queries [25]. As we can see, the estimated PDF approximates the actual resource usage PDF closely. The predicted PDF provides a complete description of the statistical properties of the CPU utilization through which we are not only able to capture the observation point, but also the whole spectrum of the resource usage. In contrast, a best approximation from the exist-ing resource estimation techniques [22, 50, 80] merely provides the point which is visualized by a solid vertical line. Unlike PDFs, with such estimation we are not able to directly calculate any valuable statistical measures (e.g. variance, confidence interval) about the target data.
3
.
2
Approach Overview
Fig. 3.3 shows the workflow of our approach as discussed next. In the proposed ap-proach, we use ML technique to train a model on the historical logs. Once the model is built, the workload manager of the stream processing system is able to employ it in order to predict the distribution of a new incoming workload (i.e. query). The pre-dicted PDFs (or mixture models) are then used for different workload management strategies such as admission control and auto-scaling rule setting.
Figure 3.2: Sample distribution prediction of CPU usage for NegAccTollStr query. Actual PDF is a fitted KDE function against the actual CPU usage which is used for
clarity and comparison with the prediction.
To do so, we firstly execute the training query workload and profile its resource usage values along with predefined query features. Secondly, we input the query features and data arrival rates to the MDN model for training. Following this, the model sta-tistically analyzes the input features’ values and actual observation of the resource consumption of the training set and predicts the probability distribution parameters (i.e. mean, variance, and mixing coefficients) over target values. Once the model is built and materialized, it can then be used to estimate the resource usage value of new incoming queries based on the query features’ values. Section 3.4 covers the details of the technique thoroughly.
Auto-scaling Policy Setting: Once the resource distribution prediction becomes available, its exploitation in data stream processing workload management is yet an-other challenge. Auto-scaling policy setting application demonstrates that the distri-bution prediction provides a reliable source of information for defining appropriate resource elasticity rules. To do so, the probability of auto-scaling policy activation is calculated. This estimation is then used as a critical parameter for analysing and predicting the impacts of the defined rules on the resources. This feature allows us to define consistent auto-scaling policies or revisit the existing thresholds if needed. More details of the application will be given in Section 3.6.1.
§3.3 Related Work 27
Figure 3.3: Our approach builds an MDN model based on the historical logs of queries to pedict distribution of new incoming workloads. The predicted PDFs are then used for developing two novel workload management strategies: a) Distribution
based admission control, and b) Auto-scaling policy setting.
3
.
3
Related Work
There are two lines of related work; one directly investigates query performance prediction and the other uses estimations for workload management. In this section, we will discuss both and highlight the research gap.
Workload Performance Prediction. Query processing run-time and resource es-timation has been investigated in recent years. This line of work explores the esti-mation of run-time and also resource consumption of SQL queries in the context of both interleaved [22, 44, 80] and parallel execution [21, 44, 90, 112]. In the majority of related work, different statistical ML techniques are applied for query performance estimation. Specifically, techniques such as Kernel Canonical Correlation Analysis (KCCA), Multiple Additive Regression-Trees (MART), and Support Vector Machines (SVM) have been respectively built upon query plan features [50], operator level fea-tures [80], or both [22].
interval about the target data.
Data Processing Workload Management. Workload management and resource sizing for data and stream processing systems use either reactive (e.g. using system load dynamics monitoring)[35], or predictive techniques (e.g. estimating the work-load performance) [27, 38, 60, 115, 116] for decision making. In all these predictive approaches, they estimate the workload performance as a single point value [27, 60], assume that the PDF for the workload execution time is already available [116], or estimate (and not predict) the PDF using sampling based techniques [38, 115].
Specifically, [27] proposes an input and query aware partitioning technique which relies on the input rate estimation using time series forecasting. However, predicting workload using a time series analysis is not adequate because event rates usually change in an unpredictable way and a single point estimate does not reflect the distribution. In this regard, although the authors in [116] voiced the issue, they assume that the PDF for the execution time of a query is already available to the service provider. As the single point estimation gives no clue of the confidence on the estimation, they use a committee based ML model in the next work[115]. Along similar lines, [38] approximates the probability distribution using a histogram-based approach. However, this approach is only a simple approximation of distribution based on a number of already collected query execution times. This means it is incapable of predicting the PDF based on the features of a new incoming query.
Concluding Remarks. Based on the above discussions, readers may have noticed the broken link between the two threads of work. Most of the existing techniques for query resource or performance prediction contemplate the target as a single point value, whereas the techniques proposed in recent studies for workload management [38, 115, 116] rely on the whole spectrum of performance or resource usage because even in an Online Transaction Processing (OLTP) workload, queries with the same query time may follow different query time distributions [116]. The authors in [114] propose a white-box technique for quantifying the uncertainties of query execution time prediction. It treats fixed constant values of operators selectivities, unit cost of single CPU or I/O operation as random variables and develop analytics techniques to infer distribution of likely running times. Although the work differs to ours as they do not target continuous queries and resource usage distribution prediction, it does have the following limitations. The technique is limited to the PostgreSQL optimizer cost model, and more importantly it does not consider concurrent query execution.
§3.4 Resource Usage Prediction 29
3
.
4
Resource Usage Prediction
The technique we describe in this chapter combines the knowledge of continuous query processing with statistical models. Employing an ML technique requires ful-filling the following tasks: i) feature identification and selection, ii) model selection, and iii) training and testing.
3.4.1 Single Continuous Query
A streaming application is represented by a directed graph whose vertices are oper-ators and whose edges are streams. In our approach, the continuous query feature set and data arrival rate distribution models form the input vector. This exploits an important observation, that data stream processing workload behaviour is predomi-nantly the function of query features along with data arrival rates.
Key to the accuracy of a prediction model is the features used to train the model. We identify a set of potential features that affect the stream processing performance and the query resource usage. The potential features are gathered by analyzing those considered in related work [22, 50] and those we observed in various performance test analyses. Intuitively, not all features have high-correlation with the target of the model and thus we need to select only those features with high predictive capability. To this end, we use a correlation-based feature subset selection method [57] along with best-first search for identifying the most effective attributes from feature vector spaces.
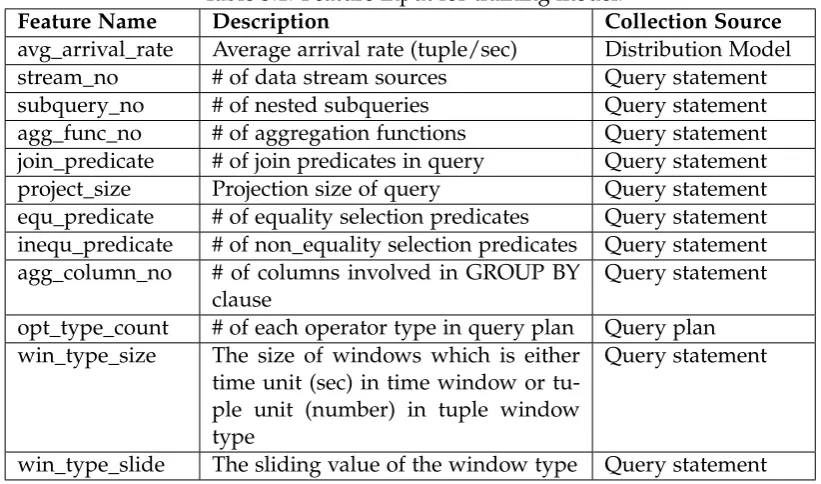
Table 3.1 lists the feature set used as an input to the model. The attributes are extracted from multiple sources such as query statement text (e.g. win_type_size), distribution model (e.g. avg_arrival_rate), or query plan (e.g. opt_type_count). Al-though previous studies [22] showed that the selectivity of operators and cardinality estimates are useful features for execution time prediction, the reason why they were not considered in our feature set is discussed in Section 3.4.2.1. Note that the above list is further customized based on the target prediction, because attributes have dif-ferent predictive impact on CPU and memory usage estimation. A feature that highly correlates memory consumption might have no correlation with CPU usage. For ex-ample, the feature selection task shows that the window size has an insignificant effect on CPU usage prediction, while it affects memory usage prediction heavily.
3.4.2 Concurrent Workload
A streaming application typically consists of a number of continuous queries simul-taneously being processed by the system. This means a resource usage modelling technique has to consider resource consumption estimation in the presence of con-current executions and the combined workload of a large number of queries.
Table 3.1: Feature input for training model.
Feature Name Description Collection Source
avg_arrival_rate Average arrival rate (tuple/sec) Distribution Model stream_no # of data stream sources Query statement subquery_no # of nested subqueries Query statement agg_func_no # of aggregation functions Query statement join_predicate # of join predicates in query Query statement project_size Projection size of query Query statement equ_predicate # of equality selection predicates Query statement inequ_predicate # of non_equality selection predicates Query statement agg_column_no # of columns involved in GROUP BY
clause
Query statement
opt_type_count # of each operator type in query plan Query plan win_type_size The size of windows which is either
time unit (sec) in time window or tu-ple unit (number) in tutu-ple window type
Query statement
win_type_slide The sliding value of the window type Query statement
hardware resources to identify possible negative effects on the mix performance. These two issues are studied in the following sub-subsections respectively.
3.4.2.1 Stream Processing Optimizations
The first step toward modelling concurrent workload is feature set extension. This process is, in fact, adapting the features for isolated query resource usage prediction to include features from concurrent executions. Since the proposed technique is based upon continuous query features, the key to successful modelling of combined workloads is the function of understanding the way the system applies optimizations. The main optimization techniques are operator reordering, redundancy elimination, placement, state sharing, and so on [62] that are somewhat supported by today’s stream processing systems. For example, Odysseus [23] supports query rewrite (e.g. selection and projection push down) and query sharing. Note that the mentioned optimization strategies are not exclusive to multi-query execution. However, some strategies such as sub-graph sharing or state sharing are more likely to be applied in the case of concurrent workload.