urostat
LANDWIRTSCHAFT
Statistisches Jahrbuch
AGRICULTURE
Statistical yearbook
AGRICULTURE
Annuaire statistique
1994
OFICINA ESTADÍSTICA DE LAS COMUNIDADES EUROPEAS
DE EUROPÆISKE FÆLLESSKABERS STATISTISKE KONTOR
STATISTISCHES AMT DER EUROPÄISCHEN GEMEINSCHAFTEN
ΣΤΑΤΙΣΤΙΚΗ ΥΠΗΡΕΣΙΑ ΤΩΝ
ΕΥΡΩΠΑΪΚΩΝ ΚΟΙΝΟΤΗΤΩΝ
STATISTICAL OFFICE OF THE EUROPEAN COMMUNITIES
OFFICE STATISTIQUE DES
COMMUNAUTÉS EUROPÉENNES
ISTITUTO STATISTICO DELLE COMUNITÀ EUROPEE
BUREAU VOOR DE STATISTIEK DER EUROPESE GEMEENSCHAPPEN
SERVIÇO DE ESTATÍSTICA DAS COMUNIDADES EUROPEIAS
L2920 Luxembourg Tél. 43 011 Télex COMEUR LU 3423
B1049 Bruxelles, rue de la Loi 200 Tél. 299 11 11
Las publicaciones de Eurostat están clasificadas por temas y por series. La clasificación se encuentra al final de
la obra. Para mayor información sobre las publicaciones, rogamos se pongan en contacto con Eurostat.
Para los pedidos, diríjanse a las oficinas de venta cuyas direcciones figuran en la página interior de la
contracubierta.
Eurostats publikationer er klassificeret efter emne og serie. En oversigt herover findes bag i hæftet. Yderligere
oplysninger om publikationerne kan fås ved henvendelse til Eurostat.
Bestilling kan afgives til de salgssteder, der er anført på omslagets side 3.
Die Veröffentlichungen von Eurostat sind nach Themenkreisen und Reihen gegliedert. Die Gliederung ist hinten in
jedem Band aufgeführt. Genauere Auskünfte über die Veröffentlichungen erteilt Eurostat.
Ihre Bestellungen richten Sie bitte an die Verkaufsbüros, deren Anschriften jeweils auf der dritten Umschlagseite
der Veröffentlichungen zu finden sind.
Οι
εκδόσεις της Eurostat ταξινομούνται κατά θέμα και κατά σειρά. Η ακριβής ταξινόμηση αναφέρεται στο
τέλος κάθε έκδοσης. Για λεπτομερέστερες πληροφορίες σχετικά με τις εκδόσεις, μπορείτε να
απευθύ-νεσθε στην Eurostat.
Για τις παραγγελίες μπορείτε να απευθύνεσθε στα γραφεία πώλησης, των οποίων οι διευθύνσεις
αναγράφονται στη σελίδα 3 του εξωφύλλου.
Eurostat's publications are classified according to themes and series. This classification is indicated at the end of
the publication. For more detailed information on publications, contact Eurostat.
Orders are obtainable from the sales offices mentioned on the inside back cover.
Les publications d'Eurostat sont
classées par thème et par série. Cette classification est précisée à la fin
de l'ouvrage. Pour des informations plus détaillées sur les publications, contactez Eurostat.
Pour les commandes, adressez-vous aux bureaux de vente dont les adresses sont indiquées à la page 3
de la couverture.
Le pubblicazioni dell'Eurostat sono classificate per tema e per serie. Tale classificazione è precisata alla fine
dell'opera. Per informazioni più dettagliate sulle pubblicazioni rivolgersi all'Eurostat.
Per eventuali ordinazioni rivolgersi a uno degli uffici di vendita i cui indirizzi figurano nella 3a pagina della
copertina.
De publikaties van Eurostat zijn ingedeeld naar onderwerp en serie. Deze indeling is achter in het boek
opgenomen. Voor nadere informatie over de publikaties kunt u sich wenden tot Eurostat.
Gelieve bestellingen op te geven bij de verkoopbureaus, waarvan de adressen op bladzijde 3 van de omslag zijn
vermeld.
As publicações do Eurostat estão classificadas por tema e por série. Esta classificação está indicada no firn da
obra. Para mais informações sobre as publicações é favor contactar Eurostat.
LANDWIRTSCHAFT
Statistisches Jahrbuch
AGRICULTURE
Statistical yearbook
AGRICULTURE
Annuaire statistique
Cataloguing data can be found at the end of this publication.
Une fiche bibliographique figure à la fin de l'ouvrage.
DE: Deutscher Text ab Seite 3.
EN: English text begins on page 9.
FR: texte français à partir de la page 15.
Luxembourg: Office des publications officielles des Communautés européennes, 1994
ISBN 92-826-7906-3
© EGKS-EG-EAG, Brüssel · Luxemburg, 1994
Nachdruck — ausgenommen zu kommerziellen Zwecken — mit Quellenangabe gestattet.
© ECSC-EC-EAEC, Brussels · Luxembourg, 1994
Reproduction is authorized, except for commercial purposes, provided the source is acknowledged.
© CECA-CE-CEEA, Bruxelles · Luxembourg, 1994
Reproduction autorisée, sauf à des fins commerciales, moyennant mention de la source.
Printed in Belgium
Das vorliegende Jahrbuch umfaßt die wichtigsten Angaben aus Eurostats
Spezialveröffent-lichungen über Landwirtschaft, Forstwirtschaft und Fischerei in gekürzter Form.
Gegenüber früheren Fassungen wurde dieses Jahrbuch in vielen Teilen überarbeitet. Es
bezieht sich im wesentlichen auf die Entwicklung im Zeitraum 1983-1992. Detaillierte Daten
enthält dieses Jahrbuch für das Jahr 1992 bzw. 1991. Im übrigen wird auf die
SpezialVeröffentlichungen von Eurostat verwiesen (siehe Anhang, Seite 229).
Die Angaben wurden von den nationalen Statistischen Ämtern bzw. den statistischen
Diensten der Ministerien auf der Grundlage gemeinschaftlicher Konzepte und Methoden
ermittelt. Eine Kurzfassung der wichtigsten angewandten gemeinschaftlichen Methoden
enthalten die einzelnen Kapitel.
Für die Bundesrepublik Deutschland beziehen sich die Daten in den meisten Tabellen für
den Zeitraum 1983-1990 auf den Gebietsstand vor dem 3. Oktober 1990 und für die Jahre
1991 und 1992 auf den Gebietsstand nach der Vereinigung. In Fußnoten wird auf den
jeweiligen Gebietsstand hingewiesen.
Die in den Tabellen angeführten Gesamtzahlen für EUR 12 ist die Summe der 12
Mitgliedsstaaten, unabhängig davon, ob einige Mitgliedstaaten für den entsprechenden
Zeitraum bereits Mitglied der Union waren oder nicht.
Vorwort 3
Abkürzungen 8
Zeichenerklärung 8
1. Allgemeiner Teil
Schaubilder
1.1
Aufgliederung der Gesamtfläche nach Hauptkategorien 1992 23
1.2 Ausgewählte pflanzliche Erzeugung in der Welt 1992 32
1.3 Tierbestand in der Welt 1992 33
1.4 Fleischerzeugung in der Welt 1992
34
Tabellen
1.1 Gesamtfläche und landwirtschaftliche Fläche 1982 und 1992 23
1.2 Zivil Erwerbstätige nach Wirtschaftsbereichen 1981 und 1991 24
1.3 Bruttowertschöpfung zu Faktorkosten nach Wirtschaftsbereichen
1981 und 1991 25
1.4 EU-Handel mit landwirtschaftlichen Produkten 1991 und 1992 26
1.5 Intra-Handel mit Nahrungsmittel und lebenden Tieren in der
Europäischen Union 1992 28
1.6 Außenhandel der Mitgliedstaaten
Nahrungsmittel und lebende Tiere 1992 29
1.7 Außenhandel der Europäischen Union
Nahrungsmittel und lebende Tiere 1992 30
1.8 Außenhandel der Mitgliedstaaten
Nahrungsmittel und lebende Tiere 1983-1992 31
1.9 Ausgewählte pflanzliche Erzeugung in der EU und in der Welt,
1986 und 1992 32
1.10 Tierbestand in der EU und in der Welt, 1986 und 1992 33
1.11 Fleischerzeugung in der EU und in der Welt, 1986 und 1992 34
2. Fläche und pflanzliche Erzeugung
Schaubilder
2.1 Aufgliederung der landwirtschaftlich genutzten Fläche nach
Mitglied-staaten 1992 38
2.2 Aufgliederung der Gesamtfläche nach Mitgliedstaaten 1992 38
2.3 Aufgliederung der geernteten Erzeugung nach Mitgliedstaaten 1992... 49
2.4. Entwicklung der Erträge wichtiger pflanzlicher Erzeugnisse 1983-1992 50
2.5 Aufgliederung der Obstbaumflächen nach Mitgliedstaaten 1990 57
2.6 Aufgliederung der Obsterzeugung nach Mitgliedstaaten 1990 57
Tabellen
2.1 Gesamtfläche und landwirtschaftliche Fläche nach Hauptkategorien
2.4 Wichtige pflanzliche Erzeugnisse, geemtete Fläche und Erzeugung
1983-1992 40
2.5 Wichtige Getreidearten, geerntete Fläche und Erzeugung 1992 48
2.6 Wichtige Arten von Frischgemüse, geerntete Fläche und Erzeugung
1983-1992 52
2.7 Geerntete Erzeugung ausgewählter Arten von Frischgemüse 1992 56
2.8 Wichtige Obstarten, Hauptanbaufläche und geemtete Erzeugung
1983-1992 58
2.9 Versorgungsbilanz, Getreide 1982/83-1991/92 62
2.10 Versorgungsbilanz, Ölsaaten 1982/83-1991/92 65
2.11 Versorgungsbilanz, Hülsenfrüchte 1982/83-1991/92 68
2.12 Versorgungsbilanz, Zucker 1982/83-1991/92 70
2.13 Versorgungsbilanz, Wein 1982/83-1991/92 73
2.14 Pflanzliche Erzeugnisse, Selbstversorgungsgrad und
Bruttonahrungs-verbrauch 1991/92 76
Text Methodische Erläuterungen über Anbauflächen und
Versorgungs-bilanzen 77
3. Tierische Erzeugung
Tabellen
3.1. Rinderbestand im Dezember 1983-1992 85
3.2 Rinderbestand nach Kategorien 1992 86
3.3 Struktur der Rinderhaltung insgesamt 1991 87
3.4 Struktur der Milchkuhhaltung 1991 88
3.5 Struktur der Haltung von sonstigen Kühen 1991 89
3.6 Schweinebestand im Dezember 1983-1992 90
3.7 Schweinebestand nach Kategorien 1992 91
3.8 Struktur der Schweinehaltung insgesamt 1991 92
3.9 Struktur der Mastschweinehaltung 1991 93
3.10 Struktur der Zuchtsauenhaltung 1991 94
3.11 Schaf- und Ziegenbestand im Dezember 1983-1992 95
3.12 Versorgungsbilanz, Fleisch 1983-1992 96
3.13 Selbstversorgungsgrad und Nahrungsverbrauch - Fleisch 1992 99
3.14 Vollmilch auf dem Hof, Erzeugung und wichtigste Verwendungen
1983-1992 100
3.15 Vollmilch in den Molkereien, Verfügbarkeit und wichtigste
Verwen-dungen 1983-1992 101
3.16 Selbstversorgungsgrad und Nahrungsverbrauch - Milcherzeugnisse
1992 103
3.17 Nutzung der Brütereien, Aufstauung von Küken 1983-1992 104
Tabellen
4.1 Betriebe und Flächen 1970/71-1989/90 109
4.2 Rechtspersönlichkeit und Verwaltung des Betriebes 1970/71 -1989/90 110
4.3 Besitzverhältnisse 1970/71-1989/90 111
4.4 Betriebe nach Größenklassen 1975-1989/90 112
4.5 Landwirtschaftlich genutzte Fläche nach Größenklassen
1975-1989/90 114
4.6 Betriebe nach Standarddeckungsbeitragklassen 1975-1989/90 116
4.7 Standarddeckungsbeitrag nach Größenklassen 1975-1989/90 118
4.8 Betriebe nach wirtschaftlicher Ausrichtung 1975-1989/90 120
4.9 Standarddeckungsbeitrag nach wirtschaftlicher Ausrichtung
1975-1989/90 123
4.10 Arbeitskräfte, Anzahl der Personen 1970/71-1989/90 126
4.11 Arbeitskräfte in Jahresarbeitseinheit 1970/71-1989/90 127
4.12 Betriebe nach Bodennutzung 1970/71-1989/90 128
4.13 Betriebe nach Viehhaltung 1970/71-1989/90 133
Text
Methodische Erläuterungen über betriebswirtschaftliche Ausrichtung,
Standarddeckungsbeitrag, Betriebsgröße und Jahresarbeitseinheit.. 137
5. Preise und Preisindizes
Tabellen
5.1 Verkaufspreise pflanzlicher Produkte 1983-1992 142
5.2 Verkaufspreise tierischer Produkte 1983-1992 148
5.3 Einkaufspreise landwirtschaftlicher Betriebsmittel 1983-1992 153
5.4 EU Index der Erzeugerpreise landwirtschaftlicher Produkte, nominale
Preisindizes, 1983-1992 156
5.5 EU Index der Erzeugerpreise landwirtschaftlicher Produkte,
deflatio-nierte Preisindizes, 1983-1992 157
5.6 EU Index der Erzeugerpreise landwirtschaftlicher Produkte nach
wichtigen Produkten, nominale Preisindizes, 1983-1992 158
5.7 EU Index der Erzeugerpreise landwirtschaftlicher Produkte nach
wichtigen Produkten, deflationierte Preisindizes, 1983-1992 160
5.8 EU Index der Einkaufspreise landwirtschaftlicher Betriebsmittel,
nominale Preisindizes, 1983-1992 162
5.9 EU Index der Einkaufspreise landwirtschaftlicher Betriebsmittel,
deflationierte Preisindizes, 1983-1992 163
5.10 EU Index der Einkaufspreise landwirtschaftlicher Betriebsmittel nach
wichtigen Betriebsmitteln, nominale Preisindizes, 1983-1992 164
5.11 EU Index der Einkaufspreise landwirtschaftlicher Betriebsmittel nach
wichtigen Betriebsmitteln, deflationierte Preisindizes, 1983-1992 166
5.12 Index der Verbraucherpreise für Nahrungsmittel, 1983-1992 168
Text
Methodische Erläuterungen über Agrarpreise und
Schaubild
6.1 Anteil der einzelnen Mitgliedstaaten am Wert der Produktion der EU
1992 193
Tabellen
6.1 Endproduktion, Vorleistungen und Wertschöpfung 1983-1992 175
6.2 Volumenindizes, Endproduktion, Vorleistungen und Wertschöpfung
1983-1992 180
6.3 Bedeutende Positionen von Endproduktion und Vorleistungen
1983-1992 182
6.4. Indizes der Nettowertschöpfung zu Faktorkosten der Landwirtschaft
1983-1992 190
6.5 Indizes der Nettoeinkommen des Arbeitseinsatzes insgesamt
1983-1992 191
6.6 Indizes der Nettoeinkommen des Familienarbeitskräfteeinsatzes
1983-1992 192
Text
Methodische Erläuterungen zur Gesamtrechnung 194
7. Forstwirtschaft
Schaubild
7.1 Wald und andere Holzflächen in Prozent der Gesamtfläche 205
Tabellen
7.1 Waldfläche und andere Holzflächen 201
7.2 Landwirtschaftliche Betriebe mit Forstfläche
Betriebe 1989/90 202
7.3 Landwirtschaftliche Betriebe mit Forstfläche
Forstfläche 1989/90 203
7.4 Rundholz-Produktion 1983-1991 204
7.5 Versorgungsbilanz, Rundholz 1983-1991 206
Text
Methodische Erläuterungen über Forstflächen und Versorgungsbilanz 208
8. Fischfang
Tabellen
8.1 Fischerei 1983-1992 212
8.2 Fänge nach Fanggebieten 1983-1992 213
8.3 Fänge der wichtigsten Fischarten 1983-1992 216
8.4 Fischereiflotte 1990-1992 222
Text
Methodische Erläuterungen zu den Fängen und der Fischereiflotte.. 224
9. Anhang
9.1 Eurostats Veröffentlichungen über Landwirtschaft, Forstwirtschaft
Einheiten :
BT
ECU
EGE
ha
hl
JAE
kg
I
m
3Mio
Mrd
t
Mitgliedstaaten
B
DK
D
GR
E
F
IRL
I
L
NL
Ρ
UK
Bruttoregistertonnen
Europäische Währungseinheit
Europäische Größeneinheit
Hektar = 10.000 m2
Hektoliter = 100 1
Jahresarbeitseinheit
Kilogramm
Liter
Kubikmeter
Million
Milliarde
Tonne
Belgien
Dänemark
Deutschland
Griechenland
Spanien
Frankreich
Irland
Italien
Luxemburg
Niederlande
Portugal
Vereinigtes Königreich
Andere Abkürzungen
:
EFTA
=
Europäische Freihandelszone
EG
=
Europäische Gemeinschaften
EU
=
Europäische Union
EUR 12
=
Alle EUMitgliedstaaten
Eurostat
=
Statistisches Amt der Europäischen Gemeinschaften
FAO
=
Ernährungs und LandwirtschaftsOrganisation der Vereinten
Nationen
MwSt
=
Mehrwertsteuer
OECD
=
Organisation für wirtschaftliche Zusammenarbeit und
Entwicklung
SITC
=
Internationales Warenverzeichnis für den Außenhandel
UEBL/BLEU =
BelgischLuxemburgische Wirtschaftsunion
0
l
0,0
(
I
l
(
ZEICHENERKLÄRUNG
Nichts
Weniger als die Hälfte der verwendeten Einheit
Fragestellung trifft nicht zu
Vertrauliche Angabe
Kein Nachweis vorhanden
Vorläufige oder geschätzte Angabe
Neuaufgenommene oder berichtigte Angabe
This Yearbook contains the most important information from Eurostat's special publication
on agriculture, forestry and fisheries in abbreviated form.
The previous versions of this Yearbook have been revised in many parts. It concentrates
on developments in the period 1983-1992, giving detailed data for the years 1992 and 1991.
The reader is also referred to the Eurostat special publications (See Annex, page 231).
The data were produced by the national statistics offices or the statistical services of the
ministries on the basis of Community concepts and methodology. The most important
Community methods used are briefly summarised in each chapter.
For the Federal Republic of Germany, the data in most of the tables refer to the period
1983-1990 and to its territorial status before 3 October 1990, and for the years 1991 and
1992 to the territorial status after unification. The territorial status is indicated in footnotes.
The overall figures for EUR 12 given in the tables are the totals for the twelve Member
States, whether some Member States were already members of the Union for the period in
question or not.
Preface 9
Abbreviations used 14
Symbols used
14
1. General
Figures
1.1 Distribution of total area by main category 1992 23
1.2 Selected crop production in the world 1992 32
1.3 Livestock numbers in the world 1992 33
1.4 Meat production in the world 1992
34
Tables
1.1 Total and agricultural area 1982 and 1992 23
1.2 Civilian employment by sector of activity 1981 and 1991 24
1.3 Gross value added at factor cost by group of economic branches
1981 and 1991 25
1.4 EU trade in agricultural commodities 1991 and 1992 26
1.5 Intra trade in the European Union, food and live animals 1992 28
1.6 External trade of the Member states, food and live animals 1992 29
1.7 External trade of the European Union, food and live animals 1992 30
1.8 External trade of the Member states, food and live animals
1983-1992 31
1.9 Selected crop production in EU and in the world, 1986 and 1992 32
1.10 Livestock numbers in EU and in the world, 1986 and 1992 33
1.11 Meat production in EU and in the world, 1986 and 1992 34
2. Area and crop production
Figures
2.1 Distribution of the utilised agricultural area by Member states 1992 38
2.2 Distribution of total area by Member states 1992 38
2.3 Distribution of harvested production by Member states 1992 49
2.4. Development of yields of important crops 1983-1992 50
2.5 Distribution of fruit trees areas by Member states 1990 57
2.6 Distribution of fruit trees production by Member states 1990 57
Tables
2.1 Total and agricultural area by main category 1983-1992 36
2.2 Arable land by category 1992 39
2.3 Land under permanent crops by category 1992 39
1983-1992 52
2.7 Harvested production of selected fresh vegetables 1992 56
2.8 Important fruits, main area and harvested production 1983-1992 58
2.9 Supply balance sheet, cereals 1982/83-1991/92 62
2.10 Supply balance sheet, oilseeds 1982/83-1991/92 65
2.11 Supply balance sheet, dried pulses 1982/83-1991/92 68
2.12 Supply balance sheet, sugar 1982/83-1991/92 70
2.13 Supply balance sheet, wine 1982/83-1991/92 73
2.14 Crop products, self sufficiency and human consumption 1991/92 76
Text
Methodological notes : area and supply balance sheets 79
3. Animal production
Tables
3.1. Bovine livestock, December 1983-1992 85
3.2 Bovine livestock by category 1992 86
3.3 Structure of cattle holders, total 1991 87
3.4 Structure of dairy cows holders 1991 88
3.5 Structure of non-dairy cow holders 1991 89
3.6 Pig population, December 1983-1992 90
3.7 Pig population by category, 1992 91
3.8 Structure of pig holders, total 1991 92
3.9 Structure of holders of pigs for fattening 1991 93
3.10 Structure of sows holders 1991 94
3.11 Sheep and goat population, December 1983-1992 95
3.12 Supply balance sheet, meat 1983-1992 96
3.13 Self sufficiency and human consumption - meat 1992 99
3.14 Whole milk on farms. Production and main uses 1983-1992 100
3.15 Whole milk in dairies. Availability and main uses 1983-1992 101
3.16 Self sufficiency and human consumption - dairy products 1992 103
3.17 Utilisation of hatcheries. Chicks placed 1983-1992 104
Text
Methodological notes : supply balance sheets 105
4. Structure of agricultural holdings
Tables
4.1 Holdings and area 1970/71-1989/90 109
4.2 Legal personality and management of the holding 1970/71-1989/90 110
1975-1989/90 116
4.7 Distribution of the standard gross margin by size classes
1975-1989/90 118
4.8 Holdings by type of farming 1975-1989/90 120
4.9 Distribution of the standard gross margin by farm type
1975-1989/90 123
4.10 Labour force, number of persons 1970/71-1989/90 126
4.11 Labour force in annual work units 1970/71-1989/90 127
4.12 Holdings by land use 1970/71-1989/90 128
4.13 Holdings by breeding stock 1970/71-1989/90 133
Text
Methodological notes : type of farming, standard gross margin,
economic size of holdings and annual work units 138
5. Prices and price indices
Tables
5.1 Selling prices of crop products 1983-1992 142
5.2 Selling prices of animal products 1983-1992 148
5.3 Purchase prices of the means of agricultural production 1983-1992 153
5.4 EU index of producer prices of agricultural products, nominal price
indices, 1983-1992 156
5.5 EU index of producer prices of agricultural products, deflated price
indices, 1983-1992 157
5.6 EU index of producer prices of agricultural products by important
products, nominal price indices, 1983-1992 158
5.7 EU index of producer prices of agricultural products by important
products, deflated price indices, 1983-1992 160
5.8 EU index of purchase prices of the means of agricultural production,
nominal price indices, 1983-1992 162
5.9 EU index of purchase prices of the means of agricultural production,
deflated price indices, 1983-1992 163
5.10 EU index of purchase prices of the means of agricultural production
by important means, nominal price indices, 1983-1992 164
5.11 EU index of purchase prices of the means of agricultural production
by important means, deflated price indices, 1983-1992 166
5.12 Consumer prices index for food, 1983-1992 168
Text
Methodological notes : agricultural prices and EC indices of
agricultural prices 171
6. Agricultural accounts
Figure
6.1 Individual Member states shares in the value of output in the EU
6.1
6.2
6.3
6.4.
6.5
6.6
Text
7. Forestry
Figure
[image:15.595.85.517.53.688.2]7.1
Tables
7.1
7.2
7.3
7.4
7.5
Text
8. Fisheries
Tables
8.1
8.2
8.3
8.4
Text
9. Annex
9.1
9.2
Final output, intermediate consumption and value added 1983-1992 175
Volume index numbers. Final output intermediate consumption and
value added 1983-1992 180
Main items of final output and intermediate consumption 1983-1992 182
Indices of net value added at factor cost in agriculture 1983-1992.... 190
Indices of net income of total agricultural labour 1983-1992 191
Indices of net income of agricultural family labour 1983-1992 192
Methodological notes : agricultural accounts 195
Forest and other wooded area in percentage of total area 205
Forest area and other wooded area 201
Agricultural holdings with wooded area
Holdings 1989/90 202
Agricultural holdings with wooded area
Woodland 1989/90 203
Roundwood production 1983-1991 204
Supply balance sheet for roundwood 1983-1991 206
Methodological notes : wooded area and supply balance sheets 208
Fisheries 1983-1992 212
Catch by fishing region 1983-1992 213
Catch by main species 1983-1992 216
Fishing fleet 1990-1992 222
Methodological notes : catches and fishing fleet 224
Eurostat publications on agriculture, forestry and fisheries 231
Units
AWU
ECU
ESU
GT
ha
hi
kg
I
m
3Mio
Mrd
t
Annual work unit
European currency unit
European size unit
Gross tonnage
Hectare = 10.000 m
2Hectolitre = 100 1
Kilogram
Litre
Cubic metre
Million
Milliard
Tonnes
Member states :
B
DK
D
GR
E
F
IRL
I
L
NL
Ρ
UK
Other abbreviations
EC
EFTA
EU
EUR 12
Eurostat =
FAO
OECD
SITC
UEBL/BLEU =
VAT
Belgium
Denmark
Germany
Greece
Spain
France
Ireland
Italy
Luxembourg
Netherlands
Portugal
United Kingdom
European Communities
European Free Trade Area
European Union
Total of the member countries of the EU
Statistical office of the European Communities
Food and Agriculture Organisation of the United Nations
Organisation for Economic Cooperation and Development
Standard International Trade Classification
Belgo-Luxembourg Economic Union
Value added tax
SYMBOLS USED
o I
0,0
f
-
f
Nil
Less than half the final digit shown
Not applicable
Confidential data
Data not available
Provisional or estimated figures
¡filli
AVANT-PROPOS
Le présent annuaire reprend sous une forme synthétique les principales informations des
publications spécialisées d'Eurostat dans les domaines de l'agriculture, de la sylviculture et
de la pêche.
Comparativement aux versions précédentes, la publication de cette année comporte un
nombre important de subdivisions. Retraçant pour l'essentiel l'évolution au cours de la
période 1983-1992, elle contient des informations détaillées relatives à l'année 1992, voire
1991, et renvoie en outre aux publications spécialisées d'Eurostat (voir annexe, page 233).
Les informations ont été recueillies par les instituts statistiques nationaux et les services
statistiques des ministères concernés sur la base de méthodologies harmonisées, dont les
principales sont présentées succinctement aux différents chapitres.
Pour ce qui est de l'Allemagne, les données de la majorité des tableaux relatifs à la période
1983-1990 se rapportent au territoire tel qu'il était avant le 3 octobre 1990 et, pour les
années 1991 et 1992, au territoire unifié. Il est précisé systématiquement en note de bas de
page à quel territoire il est fait référence.
Les chiffres globaux indiqués dans les tableaux pour EUR 12 correspondent à la somme
des douze Etats membres, même si certains d'entre eux ne faisaient pas encore partie de
l'Union au cours de la période observée.
Avant-propos 15
Abréviations 20
Signes employés 20
1 . Partie générale
Graphiques
1.1 Répartition de la superficie totale par grandes catégories 1992 23
1.2 Production végétale sélectionnée dans le monde 1992 32
1.3 Effectif animal dans le monde 1992 33
[image:18.595.113.508.160.539.2] [image:18.595.115.504.564.788.2]1.4 Production de viande dans le monde 1992
34
Tableaux
1.1
Superficie totale et agricole 1982 et 1992 23
1.2 Emploi civil par groupes de branches économiques 1981 et 1991 24
1.3 Valeur ajoutée brute au coût des facteurs par groupes de branches
économiques 1981 et 1991 25
1.4 Commerce de l'UE avec des produits agricoles 1991 et 1992 26
1.5 Commerce intra dans l'Union Européenne avec des produits
alimen-taires et des animaux vivants 1992 28
1.6 Commerce extérieur des Etats membres
Produits alimentaires et animaux vivants 1992 29
1.7 Commerce extérieur de l'Union Européenne
Produits alimentaires et animaux vivants 1992 30
1.8 Commerce extérieur des Etats membres
Produits alimentaires et animaux vivants 1983-1992 31
1.9 Production végétale sélectionnée en UE et dans le monde,
1986 et 1992 32
1.10 Effectif animal en UE et dans le monde, 1986 et 1992 33
1.11 Production de viande en UE et dans le monde, 1986 et 1992 34
2. Superficie et production végétale
Graphiques
2.1 Répartition de la superficie agricole utilisée par Etat membre 1992 38
2.2 Répartition de la superficie totale par Etat membre 1992 38
2.3 Répartition de la production récoltée par Etat membre 1992 49
2.4 Evolution des rendements de cultures principales 1983-1992 50
2.5 Répartition des superficies fruitières par Etat membre 1990 57
2.6 Répartition de la production fruitière par Etat membre
1
990 57
Tableaux
2.1 Superficie totale et agricole par grandes catégories 1983-1992 36
2.2 Terres arables par catégories 1992 39
2.3 Superficie des cultures permanentes par catégories 1992 39
1983-1992 52
2.7 Production récoltée de certaines cultures légumières 1992 56
2.8 Principaux produits fruitiers, superficie principale et production
récoltée 1983-1992 58
2.9 Bilan d'approvisionnement, céréales 1982/83-1991/92 62
2.10 Bilan d'approvisionnement, oléagineux 1982/83-1991/92 65
2.11 Bilan d'approvisionnement, légumes secs 1982/83-1991/92 68
2.12 Bilan d'approvisionnement, sucre 1982/83-1991/92 70
2.13 Bilan d'approvisionnement, vin 1982/83-1991/92 73
2.14 Production végétale, auto-approvisionnement et consommation
humaine 1991/92 76
Texte
Notes méthodologiques concernant les superficies et bilans
d'approvi-sionnement 81
3. Production animale
Tableaux
3.1 Effectifs bovins en décembre 1983-1992 85
3.2 Effectifs bovins par catégorie 1992 86
3.3 Structure des élevages de bovins, total 1991 87
3.4 Structure des élevages de vaches laitières 1991 88
3.5 Structure des élevages de vaches non laitières 1991 89
3.6 Effectifs porcins en décembre 1983-1992 90
3.7 Effectifs porcins par catégories 1992 91
3.8 Structure des élevages porcins, total 1991 92
3.9 Structure des élevages de porcs à l'engraissement 1991 93
3.10 Structure des élevages de truies 1991 94
3.11 Effectifs des ovins et caprins en décembre 1983-1992 95
3.12 Bilan d'approvisionnement, viande 1983-1992 96
3.13 Auto-approvisionnement et consommation humaine, viande 1991 ... 99
3.14 Lait entier à la ferme, production et principales utilisations
1983-1992 100
3.15 Lait entier dans les laiteries, disponibilités et principales utilisations
1983-1992 101
3.16 Auto-approvisionnement et consommation humaine, produits
laitiers 1992 103
3.17 Activité des couvoirs, mise en place de poussins 1983-1992 104
Texte
Notes méthodologies concernant les bilans d'approvisionnement 106
4. Structure des exploitations agricoles
Tableaux
4.1
Exploitations et superficie 1970/71-1989/90 109
4.2 Personnalité juridique et gestion de l'exploitation 1970/71-1989/90 .. 110
4.5 Superficie agricole utilisée parolasses de grandeur 1975-1989/90... 114
4.6 Répartition des exploitations par classe de marge brute standard
1975-1989/90 116
4.7 Répartition de la marge brute standard par classe de grandeur
1975-1989/90 118
4.8 Orientation technico-économique des exploitations 1975-1989/90.... 120
4.9 Répartition de la marge brute standard par orientation
technico-économique 1975-1989/90 123
4.10 Main-d'oeuvre, nombre de personnes 1970/71-1989/90 126
4.11 Main-d'oeuvre en unité de travail/année 1970/71-1989/90 127
4.12 Exploitations par utilisation du sol 1970/71-1989/90 128
4.13 Exploitations par élevage des animaux 1970/71-1989/90 133
Texte
Notes méthodologiques concernant l'orientation
technico-économique, la marge brute standard, la dimension d'une
exploitation et l'unité travail/année 139
5. Prix et indices de prix
Tableaux
5.1 Prix de vente des produits végétaux, 1983-1992 142
5.2 Prix de vente des produits animaux, 1983-1992 148
5.3 Prix d'achat des moyens de production agricole, 1983-1992 153
5.4 Indice UE des prix à la production des produits agricoles, indices
des prix nominaux, 1983-1992 156
5.5 Indice UE des prix à la production des produits agricoles, indices
des prix défiâtes, 1983-1992 157
5.6 Indice UE des prix à la production de produits agricoles importants,
indices des prix nominaux, 1983-1992 158
5.7 Indice UE des prix à la production de produits agricoles importants,
indices des prix défiâtes, 1983-1992 160
5.8 Indice UE des prix d'achat des moyens de production agricoles,
indices des prix nominaux, 1983-1992 ; 162
5.9 Indice UE des prix d'achat des moyens de production agricoles,
indices des prix défiâtes, 1983-1992 163
5.10 Indice UE des prix d'achat des moyens de production agricoles
importants, indices des prix nominaux, 1983-1992 164
5.11 Indice UE des prix d'achat des moyens de production agricole
importants, indices des prix défiâtes, 1983-1992 166
5.12 Indices des prix à la consommation pour denrées alimentaires,
1983-1992 168
Texte
Notes méthodologies sur les prix agricoles et les indices de prix
agricoles 172
6. Comptes de l'agriculture
Graphique
6.1 Part des Etats membres dans la valeur de la production de l'UE
6.1 Production finale, consommation intermédiaire et valeur ajoutée
1983-1992 175
6.2 Indices de volume production finale, consommation intermédiaire
et valeur ajoutée 1983-1992 180
6.3 Principaux postes de la production finale et de la consommation
intermédiaire, 1983-1992 182
6.4 Indices de la valeur ajoutée nette au coût des facteurs en
agriculture, 1983-1992 190
6.5 Indices du revenu net de la main-d'oeuvre agricole totale,
1983-1992 191
6.6 Indices du revenu net de la main-d'oeuvre agricole familiale,
1983-1992 192
Texte
Notes méthodologiques sur les comptes de l'agriculture 197
7. Sylviculture
Graphique
7.1 Forêts et autres superficies boisées en pourcentage de la superficie
totale 205
Tableaux
7.1 Forêts et autres superficies boisées 201
7.2 Exploitations agricoles et superficie boisée
Exploitations 1989/90 202
7.3 Exploitations agricoles et superficie boisée
Superficie boisée 1989/90 203
7.4 Production de bois rond, 1983-1991 204
7.5 Bilan d'approvisionnement de bois rond, 1983-1991 206
Texte
Notes méthodologiques sur les superficies boisées et les bilans
d'approvisionnement 209
8. Pêche
Tableaux
8.1 Pêche 1983-1992 212
8.2 Capture par zone de pêche, 1983-1992 213
8.3 Capture des espèces principales, 1983-1992 216
8.4 Flotte de pêche, 1990-1992 222
Texte
Notes méthodologiques sur la capture et la flotte de pêche 225
9. Annexes
9.1 Publications d'Eurostat sur l'agriculture, la sylviculture et la pêche... 233
9.2 Liste des adresses des Instituts statistiques nationaux et des
Unités
:
ECU
ha
hl
kg
I
m
3Mio
Mrd
t
TJ
UDE
UTA
Unité monétaire européenne
Hectare = 10.000 m
2Hectolitre = 100 1
Kilogramme
Litre
Mètre cube
Million
Milliard
Tonne
Tonnage de jauge brut
Unité de dimension européenne
Unité travail/année
Etats membres :
B
DK
D
GR
E
F
IRL
I
L
NL
Ρ
UK
Autres abréviations
:
Belgique
Danemark
Allemagne
Grèce
Espagne
France
Irlande
Italie
Luxembourg
Pays-Bas
Portugal
Royaume Uni
AELE
CE
EUR 12
Eurostat
FAO
OCDE
S ITC
TVA
UE
UEBL
Association européenne de libre échange
Communautés européennes
Ensemble des pays membres de l'UE
Office statistique des Communautés européennes
Organisation des Nations unies pour l'alimentation et l'agriculture
Organisation de coopération et de développement économique
Classification standard du commerce international
Taxe à la valeur ajoutée
Union européenne
Union économique belgo-luxembourgeoise
0
0,0
#
I
ι
-
r
SIGNES EMPLOYÉS
Néant
Donnée inférieure à la moitié de l'unité utilisée
Non applicable
Donnée secrète
Donnée non disponible
Donnée provisoire
Estimation d'Eurostat
1
1.1
1.1
GESAMTFLÄCHE UND
LANDWIRTSCHAFTLICHE FLÄCHE
TOTAL AND AGRICULTURAL
AREA
SUPERFICIE TOTALE ET
AGRICOLE
GESAMTFLÄCHE TOTAL AREA SUPERFICIE TOTAL
1982 1992
(1000 ha)
LANDWIRTSCHAFTLICHE FLÄCHE UTILISED AGRICULTURAL AREA SUPERFICIE AGRICOLE UTILISEE
1982 1992
ACKERLAND ARABLE U N D TERRES ARABLES
1982 1992
EUR 12
Belgique / België Danmark Deutschland Ellada España France Ireland Italia Luxembourg Nederland Portugal United Kingdom
225571
3052 4308 24869 13199 50471 54909 7028 30128 259 3731 9207 24411
236805
3052 4309 35695 13196 50468* 54909
7029 30131 257 4148 9199 24414
130097*
1433 2883 12139 5740* 27278 31635
5708* | 17850
127 2014* 4533* 18757*
:
1371 2768 16943
:
30335 4413
126 1995'
17716
67718*
741 2631 7240 2925* 15602 17386 1102 9380 55 830 2906 6920*
:
820* 2548 11468 2925*
:
17810
:
:
55 920 2906* 6541
Ab 1991 beziehen such die Daten für EUR 12 From 1991 the data for EUR 12 and Germany A partir de 1991. les données pour EUR 12 et
und Deutschland auf den Gebietsstand nach dem 3.10.90 refer to Germany as constituted after 3.10.90.
l'Allemagne se réfèrent au territoire allemand après le 3.10.90.
1.1
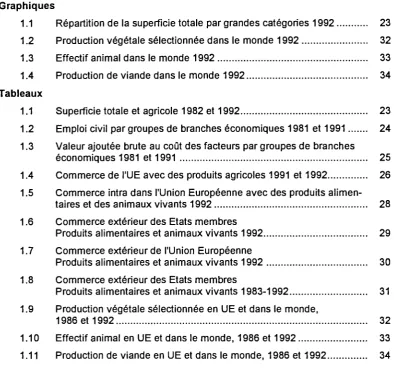
AUFGLIEDERUNG DER
GESAMTFLÄCHE NACH
HAUPTKATEGORIEN
DISTRD3UTION OF
TOTAL AREA
BY MAIN CATEGORY
1992
1.1
REPARTITION DE LA
SUPERFICffi TOTALE PAR
GRANDES CATEGORIES
EUR12
ACKERLAND ARABLE LAND TERRES ARABLES
30%
GEWÄSSER WATER
EAUX 2%
ÜBRIGE FLÄCHE OTHER AREA AUTRE SUPERFICIE
18%
DAUERKULTUREN
PERMANENTCROPS CULTURES PERMANENTES5% DAUERGRÜNLAND
PERMANENT GRASSLAND SUP. TOUJ. COUV. D'HERBE
19%
FORSTFLACHE WOODED AREA SUPERFICIE BOISÉE
1.2
1.2
ZIVIL ERWERBSTÄTIGE
NACH
WIRTSCHAFTS-BEREICHEN
EUR 12
Belgique / België
Danmark
Deutschland
Ellada
Espana
France
Ireland
Italia
Luxembourg
Nederland
Portugal
United Kingdom
EFTA
Austria
Finland
Iceland
Norway
Sweden
Switzerland
USA
Nippon
INSGESAMT
TOTAL
TOTAL
1981 |
123 322
3 538
2 508
26 498
3 526
11 216
21 335
1 131
20 361
158
5 072
3 969
24 011
14913
3 090
2 343
111
1 904
4 225
3 240
100 397
55 810
1991
132 951
3 686
2 607
28 533
3 632
12 608
22 131
1 113
21 410
196
6 444
4 833
25 757
15915
3 482
2 330
140
1 973
4 430
3 560
116 877
63 690
CIVILIAN EMPLOYMENT
BY SECTOR OF
OF ACTIVITY
(1000)
LANDWIRTSCHAFT,
FORSTWIRTSCHAFT,
FISCHEREI
AGRICULTURE
FORES-TRY AND FISHERIES
AGRICULTURE ,
SYLVI-CULTURE ET PECHE
1981 I
11 501
113
197
1 367
1 082
2 108
1 754
196
2 732
8
247
1 059
639
1245
317
305
14
159
237
213
3 519
5 570
1991
8 228
98
144
957
807
1 345
1 196
154
1 823
6
293
848
557
925
256
198
15
116
143
197
3 390
4 270
INDUSTRIE
INDUSTRY
INDUSTRIE
1981 | 1991
45 378
1 193
680
11 383
1 022
3 957
7 516
363
7 647
59
1 517
1 448
8 593
1 236
827*
38"
557
1 323
30190
19 700
42 280
1 050
689
11 189
1 001
4 167
6 538
322
6 916
58
1 645
1 630
7 076
4 944
1 284
682
36*
466
1 250
1226
29 557
21930
EMPLOI CIVIL
PAR SECTEUR
D'ACTIVITE
DIENST-LEISTUNGEN
SERVICES
SERVICES
1981 | 1991
66 426
2 232
1 630
13 749
1 421
5 140
12 065
572
9 982
91
3 308
1 456
14 780
1 535
1 211
59
1 185
2 666
66 688
30 420
82 440
2 537
1 775
16 387
1 825
7 095
14 398
636
12 671
132
4 506
2 354
18 124
10013
1 923
1 448
89
1 385
3 031
2137
83 929
37 190
EUR 12
Belgique / België
Danmark
Deutschland
Ellada
España
France
Ireland
Italia
Luxembourg
Nederland
Portugal
United Kingdom
100
100
37
32
54
62
100
100
100
100
100
100
100
100
100
100
100
100
100
100
100
100
100
100
100
100
100
100
100
100
3
8
5
31
19
8
17
13
5
5
27
3
3
6
3
22
11
5
14
9
3
5
18
2
34
27
43
29
35
35
32
38
37
30
36
36
28
26
39
28
33
30
29
32
30
26
34
27
63
65
52
40
46
57
51
49
58
65
37
62
69
68
57
50
56
65
57
59
67
70
49
70
EFTA
Austria
Finland
Iceland
Norway
Sweden
Switzerland
USA
Nippon
100
100
31
63
100
100
100
100
100
100
100
100
100
100
100
100
100
100
100
100
10
13
13
8
6
7
4
10
8
8
11
6
3
6
3
7
40
35
34
29
31
30
35
37
29
26
24
28
34
25
34
50
52
53
62
63
66
55
55
62
64
70
68
60
72
58
Die Daten für EUR 12 und Deutschland beziehen sich auf Deutschland in seinem Gebietsstand vor dem 3. Oktober 1990. Data for EUR 12 and Germany refer to Germany in its boundries prior to 3 October 1990.
1.3
1.3
BRUTTOWERTSCHÖPFUNG
ZU FAKTORKOSTEN
NACH WIRTSCHAFTSBEREICHEN
GROSS VALUE ADDED
AT FACTOR COST BY
ECONNOMIC BRANCHES
VALEUR AJOUTEE BRUTE AU
COÛT DES FACTEURS PAR
BRANCHES ECONOMIQUES
INSGESAMT
TOTAL
TOTAL
1981 | 1991
LANDWIRTSCHAFT,
FORSTWIRTSCHAFT,
FISCHEREI
AGRICULTURE,
FORES-TRY AND FISHERIES
AGRICULTURE,
SYLVI-CULTURE ET PECHE
1981 I 1991
INDUSTRIE '
INDUSTRY
1INDUSTRIE *
1981 | 1991
DIENST-LEISTUNGEN
SERVICES
SERVICES
1981 | 1991
EUR 12
Belgique / België
Danmark
Deutschland
Ellada
España
France
Ireland
Italia
Luxembourg
Nederland
Portugal
United Kingdom
2 286
4 672
82
45
568
30
164
480
15
363
4
120
21
394
149
94
1 185
49
392
886
33
893
7
221
53
710
(Mrd ECU)
94
2
3
13
5
10
22
2
21
0
5
2
9
143
3
4
17
8
19
30
3
34
0
9
4
12
825
26
12
227
9
59
160
5
132
2
41
8
144
1 471
44
25
428
13
136
259
12
270
2
66
20
196
1 367
54
30
328
16
95
298
8
210
2
74
11
241
3 058
102
65
740
28
237
597
18
589
5
146
29
502
EUR 12
Belgique / België
Danmark
Deutschland
Ellada
Espana
France
Ireland
Italia
Luxembourg
Nederland
Portugal
United Kingdom
100
100
100
100
100
100
100
100
100
100
100
100
100
100
100
100
100
100
100
100
100
100
100
100
100
100
4
2
7
2
17
6
5
13
6
0
4
10
2
3
2
4
1
16
5
3
9
4
0
4
8
2
36
32
27
40
30
36
33
33
36
50
34
38
37
31
30
27
36
27
35
29
36
30
29
30
38
28
60
66
67
58
53
58
62
53
58
50
62
52
61
65
68
69
62
57
60
67
55
66
71
66
55
71
Ab 1991 beziehen sich die Daten für EUR 12 und Deutschland auf den Gebietsstand nach dem 3. Oktober 1990. From 1991 the data for EUR 12 and Germany refer to German as constituted after 3.10.90.
A partir de 1991, tes données pour EUR 12 et l'Allemagne se réfèrent au territoire allemand après le 3.10.90.
EU HANDEL IN LANDWIRTSCHAFTLICHE
PRODUKTEN
EU TRADE IN AGRICULTURAL
COMMODITIES
S I
τ
c
09 0 00 01 011 012
02 022
024 03 034 04 041 042 043 044 048
05 054
057 06 07 071 073 08 09 1 112 122
2 21 22
GESAMTHANDEL
Nahrungsmittel und lebende Tiere
Lebende Tiere, ausgenommen solche des Abschnits 03 Fleisch und Zubereitungen von Fleisch
Fleisch von Rindern, frisch, oder gefroren
Anderes Fleisch und geniessb. Schlachtnebenerz. frisch, gekühlt oder gefroren
Milch und Milcherzeugnisse; Vogeleier Milch und Rahm, Milcherzeugnisse
Käse und Quark.
Fische, Krebstiere, Weichtiere u.s.w.; Zubereitungen daraus Fische frisch, gekühlt oder gefroren
Getreide und Getreideerzeugnisse Weizen und Mengkorn, nicht gemahlen Reis
Gerste, nicht gemahlen Mais, nicht gemahlen
Zuber, aus Getreide, Mehl, Fruchtenslärke oder Gemüsestärke
Gemüse und Früchte
Gemüse, frisch, gekühlt, gefroren oder in einfacher Weise haltbar gemacht und andere g
Geniessbare Früchte, frisch oder getrocknet Zucker, Zuckerwaren und Honig
Kaffee, Tee, Kakao, Gewürze und Waren daraus Kaffee und Kaffeeersatz
Schokolade und kakaohaltige Lebensmittelzubereitungen Tierfutter (ausgenommen ungemahlenes Getreide] Verschiedene geniessbare Waren und Zubereitungen
Getränke und Tabak Alkoholhaltige Getränke Tabak, verarbeitet
Rohstoffe (ausgen. Nahrungsmittel und mineralische Brennstoffe)
Häute, Felle und Pelzfelle, roh Ölsaaten und ölhaltige Früchte
TOTAL TRADE Food and live animals
Live animals other than animals of division 03 Meat and meat preparations
Meat of bovine animals, fresh, chilled or frozen Other meat and edible meat offal, fresh, chilled or frozen
Dairy products and bird's eggs
Milk and cream and milk products other than butter and cheese
Cheese and curd
Fish, crustaceans and molluscs and preparations thereof Fish, fresh, chilled or frozen
Cereals and cereal preparations Wheat and mesiin, unmilled Rice
Barley unmilled Maize unmilled
Cereal preparations and preparations of flour or fruit or vegetable starches
Vegetables and fruit
Vegetables, fresh, chilled, frozen or simply preserved and other edible vegetable products
Fruits and nuts, fresh or dried Sugars, sugar preparations and honey
Coffee, tea, cocoa, spices and manufactures thereof Coffee and coffee substitutes
Chocolate and other food preparations containing cocoa n.e.s. Feeding stuff for animals (not including unmilled cereals) Miscellaneous edible products and preparations
Beverages and tobacco Alcoholic beverages Tobacco, manufactured
Crude materials, inedible, except fuels Hides, skins and furskins, raw
1.4
COMMERCE DE L'UE
PRODUITS AGRICOLE
(Mio ECU)
IMPORT
INTRA
1991 1992
EXTRA
1991 1992
INSGESAMT
TOTAL
1991 1992
EXPORT
EXTRA
1991 1992
703 102 716 663 494 060 487 617 1199 832 1207 833 423 466 4361
73 370 3 287
13664 4 923 6 151
10 832
4 170
4 427 5 318 2 742 9 754 2 920 695 939 1 534 3 261
17 383 6 175
5 845 2 409 3613 806 1 959 3 603 3 505
10 921 7 070 2 500
22 028
962 1318
77 310
3 611
15 035
5 226 7 103
12 209 4 997
4 897 5 127 2 610 9 924 2 804 595 858 1 645 3 566
17 132 5 831
5 716 2 520 3 857 822 2 171
4 002 3 892
11449 7 251
2 641 21450
975
1 173
35 033
647
2 794
801 1 467
705 50
448 7217 3 164 1 274 150 223
1
515 300
11 482 2 749
5 969 1 371 4 786 2 700 214 4 348
409
3 097
726 470
33 143
754 3 235
35 136
616
2 986 847 1 590
657 43
459 7 171 3 215 1 165
180 245
1
365 298
11 707 3 062
5 898 1 480 4 335 2317 226 4 538
482
3 212
808 483
32 204
766 3 331
108 510
3 934
16 476 5 724 7 636
11 538 4 220
4 875 12 536 5 907 11 035
3 074 917 942 2 049 3 561
28 890 8 926
11824 3 819 8 405 3 508 2 174 7 951 3 925
14 032
7 799 2 981
55 456
1 717 4 556
112 546
4 235
18 050
6 073 8 721
12 867 5 040
5 356 12 300 5 826 11 089
2 985 841 860 2 010 3 864
28 848 8 894
11 615 4 036 8 195 3 142 2 397 8 540 4 385
14 691
8 061 3 150
53 925
1748 4 506
22 896
404
3 393 1 114 1 426
3 716 1987
1 155 1303
710 4 099 1 018
195 570 37 1 511
3 547 1 132
1 047 1 849 1511
289 679 1 086 1 990
8 201
6 199 1 208
7 966
438
52
24 887
384
3 352
1 136 1337
3 987 2 288
1 199 1 237
675 5 325 1 628 185 771 100 1 632
3411 1 004
998 1 866 1 686
338 802 1335 2 304
8 777 6 551 1422
8 068
479 112
COMMERCE TOTAL
Produits alimentaires et animaux vivants
Animaux vivants autres que ceux figurant dans la division 03
Viandes et préparations de viande
Viande bovine, fraîche, réfrigérée ou congelée Autres viandes, abats comestibles, frais, réfrigérés ou congelés
Produits laitiers et oeufs d'oiseaux
Lait, crème de lait et produits laitiers exceptés beurre et fromages
Fromage et cailleborte
Poissons, crustacés, mollusques etc. et préparations Poissons frais, réfrigérés ou congelés
Céréales et préparations de céréales Froment et méteil non moulus Riz
Orge non moulue Maïs non moulu
Préparations de céréales, farines, fécules de fruits ou légumes
Légumes et fruits
Légumes et plantes potagères, frais, réfrigérés.ou congelés ou conservés et autres produits végétaux, n.d.a., frais
Fruits, frais ou secs
Sucres, préparations à base de sucre et miel Café, thé, cacao, épices et produits dérivés
Café et succédanés du café
Chocolat et préparations alimentaires contenant du cacao, n.d.a. Nourriture dest. aux animaux (à l'excl. des céréales non moulues) Produits et préparations alimentaires divers
Boissons et tabacs
Boissons alcooliques Tabacs fabriqués
Matières brutes non comestibles, à l'exception des carburants
Cuirs, peaux et pelleteries bruts Graines et fruils oléagineux
0-9
00
01 011 012
02 022
024
03
034
04
041
042
043
044
048
05 054
057
06 07
071
073
08 09 1 112 122