Performance Analysis of Priority Queueing
Systems in an ATM Environment
by
Jason Pieloor, B. E. (Hons.)
Department of Electrical and Electronic Engineering
Submitted in fulfilment of the requirements for the degree of
Doctor of Philosophy
Statement of Originality
This thesis contains no material which has been accepted for the award of any other degree or diploma in any tertiary institution. To the best of my knowledge and belief, the thesis contains no material previously published or written by another person, except when due reference is made in the text.
Jason Pieloor
Authority of Access
This thesis may be made available for loan and limited copying in accordance with the Copyright Act 1968.
Jason Pieloor
Abstract
Current and future digital telecommunication networks are facing ever increasing band-width and service demands. One scheme aimed at meeting these demands is the broad-band integrated services digital network (B-ISDN). The B-ISDN is based on the asyn-chronous transfer mode (ATM) which provides flexible and dynamic transport and routing functions. One of the main challenges for designers and managers of these networks is to provide a guaranteed quality of service (QoS) for each connection, while still achieving a high network utilisation overall.
To provide a guaranteed QoS, the network must have a mechanism for deciding whether it can support a requested quality of service for a new connection, whilst still main-taining the QoS of existing connections. This decision process is called connection admission control (CAC). Mechanisms for implementing CAC must be acceptably ac-curate, while executing in as the shortest time as possible. Most CAC mechanisms are based on the application of queueing theory to the network - the accuracy of which is largely dependent on the models of the network traffic used, and the solution method chosen for the queue analysis.
B-ISDN connections can be generally classified as either loss sensitive or delay sensitive. Unfortunately, the requirements for transporting both these types of connections within the same network appear to be at odds with each other. Small internal buffers in ATM switching nodes result in small transmission delays but potentially high loss rates, while the use of large buffer sizes favours small loss rates with long transmission delays. To accommodate both types of connections, a dual buffer approach can be used within the network switches, wherein one buffer receives priority access to the output line over the other. Delay sensitive traffic can then be served ahead of loss sensitive traffic, and a large buffer space can be used to accommodate low loss requirements. The difficulty with the dual buffer approach for the purposes of CAC, is that analysis of the loss queue is complicated due to service interruptions caused by the delay traffic. Fortunately, a relationship between single buffer and dual buffer analyses exists, allowing some of the more important results for the loss queue to be obtained using single buffer analysis
VI Abstract
only.
This thesis considers the modelling of traffic both at the edges of the network, and at intermediate stages within the network. Several models are proposed, with a particular concern that the bursty nature of actual network traffics be adequately captured. In order to apply these descriptions of the network traffic to connection admission, the population analysis of infinite buffer queueing problems is carried out using the pro-posed models. Queueing delays are then obtained directly from the queue population results. Although the traffic models are not particularly complicated, closed form so-lutions for the average and variance of the queue population are obtained only for one type of bursty traffic model. For the other traffic models, exact numerical solutions are discussed, and some simple approximations examined. To overcome limitations in' these solutions, a new approximation technique is proposed, which achieves extremely high accuracy for a modest computational cost. In addition to these infinite buffer results, consideration is also given to obtaining the loss probabilities of the finite buffer. problem.
Acknowledgements
I would firstly like to extend my heartfelt thanks to my supervisors, Doctor David J. H. Lewis and Professor D. Thong Nguyen, for all their help and encouragement through the course of my studies. Doctor Lewis has provided me with friendship, valuable guidance, and the freedom to choose the direction of my research, for all of whi~h I am deeply grateful. Professor Nguyen has kept an ever watchful eye on the needs of the postgraduate students in this Department, encouraging us to better achievements, and helping us to do so.
I would like to thank all of the staff of the Department of Electrical and Electronic Engineering at the University of Tasmania, which became my 'home away from home' for many years. In particular I would like to express my thanks to Glenn Mayhew and Russell Twining, who have been friends as well as providing me with much assistance. Many thanks go also to my fellow postgraduate students, who made the study environ-ment cooperative and pleasant. I'd particularly like to thank Marc Stoksik, Andrew Innes, Andrew Bainbridge-Smith, and John McCulloch, who provided me with help and guidance, and with whom I have spent many enjoyable hours.
A very special thanks go to my family and dear friends, for keeping me from going completely bananas when the going got tough. I'd especially like to thank my wife Jewel Ashley for all her support, love, and encouragement. This thesis would not have been accomplished without these fine people, and to all of them I am indebted. It has been a long time coming, but I am proud of the result.
Lastly, I'd like to thank Telstra Research Laboratories, who provided financial assis-tance and other resources for my studies through their Postgraduate Research Fellow-ship Scheme.
Contents
Abstract
Acknowledgements
Contents
Glossary
Preface
1 Introduction
1.1 Overview of the Broadband ISDN
1.1.1
1.1.2
1.1.3
1.1.4
The Asynchronous Transfer Mode
B-ISDN Protocols . . . .
The User Network Interface
Switching and Multiplexing
1.2 Traffic Management Issues . . .
1.2.l Priority Control in the B-ISDN
IX
v
vii
ix
xix
xxiii
1
2
2
5
8
10
14
x
1.2.2 Connection Admission Control
1.3 Modelling ATM Traffic . . . . .
1.3.l
1.3.2
1.3.3
1.3.4
Traffic Characterisation
Modelling Approaches .
An Interrupted Bernoulli Model of ATM traffic
A Cyclic Arrival Model
Contents
19
22
22
26
27
29
1.4 Contributions of this Thesis . . . 30
2 General Theory for Queue Population Analysis 33
2.1 A Quick Review of Solution Methods .
2.2
2.3 2.1.1
2.1.2
Exact Methods . . . .
Approximate Methods
Basic Assumptions . . . .
Queueing Analysis for Markov Modulated Sources
2.3.1
2.3.2
2.3.3
The Queue Equation . . . .
Alternative Form of the Queue Equation .
Solving for the 'Empty System' Probability vector . . .
2.4 Solution for X'(l) based on the Alternative Queueing Equation
2.5 Solution for the Average Queue Population . . . .
2.6 Solution for the Variance of the Queue Population
2.7 Mixing Autocorrelated and Random Sources . . . .
33
34
35
36
37
38
39
40
41
42
43
Contents
2.8 Other Methods for finding Lq and Var [Lq]
2.9 Multiple Buffer Queueing Systems ..
2.9.1
2.9.2
2.9.3
Dual Buffer Queueing Systems
Analysis of Interrupted Service Queueing Problems .
A Simple Interrupted Service Example .
xi
47
48
49
52
53
2.10 Summary . . . 54
3 Population Analysis for Geometric-Geometric IBP Arrival Models 57
3.1 Exact Queue Population Analysis . . . .
3.2
3.3
3.1.1 Characterising a Geometric-Geometric IBP Source
3.1.2
3.1.3
3.1.4
3.1.5
A pp lying the Queue Population Theory
O_btaining the Empty System Vector
Numeric Implementation Issues . . .
Run Times for this Exact Solution Method
Approximate Queue Population Solutions
The Geometric Tail Approximation . . . .
3.3.1
3.3.2
3.3.3
Obtaining the geometric coefficient if; .
Estimating the Scaling Factor . . . .
Comparison of the Approximations .
3.4 The MMPP Approximation
3.4.1 Parameter Matching
59
59
60
61
".~ 63
64
65
67
67
68
70
74
xii Contents
3.4.2 Queue Population Analysis 76
3.4.3 Accuracy Study . . . 78
3.5 Empty System Vector Approximation 79 3.5.l Accuracy Study . 80 3.6 A New Approximation . 83 3.6.1 Accuracy Study . . . 85
3.6.2 Improving the Approximation Accuracy 86 3.6.3 Approximation Run Times 92 3.6.4 Other Variations . . . 93
3.7 Summary . . . 97
4 Population Analysis for Phase-Geometric Binary Arrival Models 99 4.1 Related Studies . . . 99
4.2 Average Queue Population for Phase-Geometric Binary Sources . . . 101
4.2.1 Non-Binary Sources . . . 104
4.2.2 Identical Sources . . . 104
4.3 Queue Population Variance for Phase-Geometric Binary Sources . . . . 104
4.3.l Variance for a single Phase-Geometric Binary source . . . 105
4.3.2 Construction of the Variance Solution . . . 108
4.3.3 Numeric Confirmation . . . 109
Contents xiii
4.3.5 Identical Sources 113
4.4 Summary . . . . 113
5 Population Analysis of Cyclic Service Queues 115 5.1 Exact Queue Population Analysis . . . 117
5.2 5.1.1 Characterising the Cyclic Source . . . 117
5.1.2 Applying the Queue Population Theory . . . 120
Obtaining the Empty System Probability Vector . . . 122
5.2_.l Finding the Poles and Zeros of the Queue Equation . . . 122
5.2.2 5.2.3 Solving for the Linear System . . . . Investigating the Adaptive Solution Performance 127 135 5.3 Approximate Queue Population Solutions . . . 141
5.3.1 Modelling the Cyclic Process by a Random Process . . . :142
5.3.2 Using the Adaptive Solution Approach . . . 147
5.3.3 The kth Order Approximation Method . . . 150
5.3.4 Approximations Summary . . . 152
5.4 Summary . . . 153
xiv Contents
6.2.1 Predicting the Average Loss Probability for Marginal Arrival Pro-cesses . . . 159
6.2.2 Predicting Average Loss Probabilities for Autocorrelated Arrival Processes . . . 162
6.2.3 Accuracy Study for the Average Loss Probability Approximation 164
6.2.4 Considerations for Dual Buffer Systems . . . 173 .
6.3 Obtaining Delays from Populations for Uninterrupted Service Queues . 175
6.3.1 Estimating the Higher Percentiles of the Delay . . . . 176
6.3.2 Delays in Finite Buffers . . . . . . . . 177
6.3.3 Delays for Individual Traffic Classes 178
6.4 Delays for Interrupted Service Queues . . . 178
6.4.1 Random Arrivals and Random Service 179
6.5 Summary . . . . . . 182
7 Applications 185
7.1 Analysis of a Dual Buffer Queueing System . . . 185
7.2 Dual Buffer Analysis with a Cyclic Arrival Process . . . 187
7.2.1 A Simulation Study . . . 188
7.3 Dual Buffer Analysis with IBP Sources Only 193
7.3.1 Random Priority Splitting . 193
7.4 Modelling the Outputs of Queues . 198
Contents xv
7.5 The Geometric-Geometric IBP as an Output Model 202
7.5.1 Daley's Result . . . 205
7.5.2 Some Trends in the Geometric-Geometric IBP Output Model 208
7.6 Server Idle and Busy Periods for Phase-Geometric Binary Sources . . 212
7.6.1 Idle Period Distribution and First Moment of the Busy Period . 214
7.6.2 Second Moment of the Busy Period . . . 215
7.6.3 Third Moment of the Busy Period .
~
216
7.6.4 Implications for Phase-Geometric Binary Queues . . . 217
7. 7 Summary . . . ,. . . 219
8 Conclusion 221
8.1 Thesis Summary . 221
8.2 Future Directions . . . .. 223
8.2.1 Developing Multi-State IBP Arrival Models . . . 223
8.2.2 Extending the Dual Buffer Analysis . . . . . . . 224
8.2.3 Implementing Performance Results into a CAC Framework . . . 225
8.3 Conclusions . . . 225
A Application of the z-Transform to the Marginal Arrivals Problem 227
A.l The discrete z-transform . . . 227
A.2 The Marginal Arrivals Queue . . . 228
xvi Contents
B.l Marginal Arrival Processes 231
B.2 Autocorrelated Arrival Processes 232
B.3 Some Example Applications . . . 234
B.3.1 Mixing a Geometric-Geometric Source with a Marginal Source 235
B.3.2 Mixing Geometric-Geometric Sources . . . 238
B.3.3 Mixing a Periodic Source with Geometric-Geometric Sources . . 241
B.4 Discussion of the Example Results . . . 241
B.5 A Brief Look at the Limits of the Queueing Delay Variance . . . 245
C Eigensystem Analysis of Arrival Processes 247
248
250 C.l Phase-Geometric Random Processes
C.1.1 Obtaining hn(z) and wn(z)
C.1.2 Obtaining gn(z) . . . 250
C.1.3 Simplifying hn(l)g
0
(1) . . . 251C.1.4 Obtaining u(z) and o(z)
C.1.5 Obtaining v(z) . . .
C.1.6 Derivatives of o(z) and v(z)
C.2 Cyclic Processes . . . .
C.2.1 Obtaining hn(z) and gn(z)
C.2.2 Derivation of hn(l)g
0
(1) ..C.2.3 Obtaining u(z), v(z), and o(z)
252
. .. 252
. . . 253
254
255
256
Contents xv ii
C.2.4 Derivatives of o(z) and v(z) . . . . 258
C.3 Perron-Frobenius and General Eigensystem results 259
C.4 Perron-Frobenius Eigenvalue Derivatives for Multiple Sources 260
C.5 The Geometric-Geometric Special Case . . . . . . 261
C.5.1 Geometric-geometric expressions for wn(z), hn(z), and gn(z) .. 262
C.5.2 Geometric-geometric expressions for o(z), u(z), and v(z) and
derivatives . . . 262
D The Autocorrelation Sum of a Phase-Geom Binary Source 265
E Iterative Queueing Solutions 269
E.1 Markov Modulated Arrival Processes . 269
E.2 Application to the Geometric-Geometric IBP Queueing Problem . . . . 271
E.3 Application to Cyclic Service Queueing Problems . . . •, 275
F Miscellaneous Mathematics 277
F.l Sums of Series . . . 277
F .2 Moments of Sums of Binary Processes . . . 280
F.3 Binomial Arrival Processes . . . 281
Glossary
Acronyms
AAL AD PCM ATM B-ISDN CAC CBR CCITT CDV CLP D-BMAP FIFO GFC HEC HOL IBP IN IPC ISDN kbps LAN Mbps MMPP msec µsec N-ISDN NNI OPC OSIATM adaptation layer
Adaptive differential pulse code modulation Asynchronous transfer mode
Broadband integrated services digital network Connection admission control
Constant bit rate
International Telegraph and Telephone Consultative Committee Cell delay variation
Cell loss priority
Discrete-time batch Markov arrival process First in, first out
Generic flow control Header error control Head of line
Interrupted Bernoulli process Interconnection network Input port controller
integrated services digital network Kilobits (103 bits) per second
Local area network
Megabits (106 bits) per second Markov modulated Poisson process Milliseconds ( 10-3 seconds)
Microseconds (10-6 seconds)
narrowband integrated services digital network Network-Node Interface
Output port controller
Open systems interconnection
xx
PABX Private automatic branch exchange
PCM Pulse code modulation
PDU Protocol data unit
PRM Protocol reference model
PSTN Public switched telephone network
PT Payload type
QoS Quality of service
SPP Switched Poisson process
STM Synchronous transfer mode
TDM Time division multiplexing
UNI User-Network Interface
UPC Usage parameter control
VBR Variable bit rate
vc
Virtual channelvcc
Virtual channel connectionVCI Virtual channel identifier VLSI Very large scale integration
VP Virtual path
VPC Virtual path connection
VPI Virtual path identifier
Mathematical Notation
General mathematical notation:
lxl
Ix!
Pr(X) E[X] Var[X] 0Approximately equal to
Approaches, or 'tends towards' Largest integer less than x Absolute value of x
Probability of event X
Expected value of random variable X
Variance of random variable X
Kronecker pro~duct
Notation used throughout this thesis to identify specific quantities:
I A
Identity matrix
Transition probability matrix
Glossary P(z) b e µ
X(z)
hn(z) gn(z) u(z) u(z) Wn(z) 8(z) A M2 M3'
'T/r Lq Var [Lq] Dq Var [Dq]R(m)
Matrix of arrival probability generating functions Empty system probability vector
Unit column vector (all elements equal to 1) Invariant probability vector of matrix A
Vector of queue population probability generating functions Left eigenvector of AP(z) corresponding to its nth eigenvalue Right eigenvector of AP(z) corresponding to its nth eigenvalue Left Perron-Frobenius eigenvector of AP(z)
Right Perron-Frobenius eigenvector of AP(z) nth eigenvalue of AP(z)
Perron-Frobenius eigenvalue of AP(z)
Average number of arrivals occurring in one time slot
Second moment of number of arrivals occuring in one time slot Third moment of number of arrivals occuring in one time slot Autocorrelation parameter
rth moment of the active period of a source Average queue population
Variance of the queue population Average queueing delay
Variance of the queueing delay
Autocorrelation coefficient at a lag of m
xxi
Note that a specific source is usually identified by a subscript i term (eg. Ai)'., When a subscript already exists for the quantity, the source is identified by a leading i in a comma separated pair ( eg. 'T/i,r). Derivatives are indicated by the primes of the variable ( eg. 8' (z) and 8" (z) for the first and second derivatives).
Other Notation
geom-geom IBP
phase-geom Binary
geom-geom Binary
An interrupted Bernoulli process (IBP) with geometrically dis-tributed active and inactive periods
A form of IBP with phase-type distributed active periods, and geometric inactive periods, and that generates a single arrival in every time slot for which the process is active (a peak rate of 1)
Preface
Current and future digital telecommunication networks are facing ever increasing band-width and service demands, requiring new design approaches. The broadband inte-grated services digital network (B-ISDN) is a scalable solution to the demand problem, based on the asynchronous transfer mode (ATM). ATM is a packet switching technol-ogy, which provides flexible and dynamic bandwidth management capabilities for the B-ISDN by sharing available transmission bandwidth amongst all connections. As a result, one of the main challenges facing the B-ISDN will be providing a guaranteed quality of service (QoS) for individual connections, while still achieving high network utilisation overall.
To provide a guaranteed QoS, the network must have a mechanism fo_r deciding whether it can support a requested quality of service for a new connection, whilst still main-taining the quality of existing connections - a process called connection admission control (CAC). Mechanisms for implementing CAC must be acceptably accurate, while executing in as the shortest possible time. Due to buffering within the ATM switches, most CAC mechanisms are based on the application of queueing theory to the network - the accuracy of which is largely dependent on the accuracy of the models of network traffic sources, and the solution method chosen.
The focus of this thesis is the discrete-time performance analysis of single and dual buffer queueing systems suitable for application in an ATM environment. This research has been motivated by a desire to both expand the current knowledge of queueing theory as applied to these problems, and to investigate practical solution methods and approximations. Implementation of the results within a larger CAC framework has not however been attempted in this work.
xxiv Preface
Thesis Organisation
This thesis comprises 8 chapters and 6 appendices. Following the introductory ma-terial of Chapter 1, Chapters 2 to 5 develop theoretical and numerical results for the population average and variance of some infinite buffer queueing problems based on an IBP traffic model. Losses in ·finite buffers and the relationship between queueing delays and queue populations are considered in Chapter 6, while Chapter 7 investigates dual buffer systems and queue output processes. Chapter 8 concludes the thesis, and suggests some areas for future research.
Chapter 1 provides an introduction to the development of the B-ISDN. An overview of the structure of the B-ISDN and ATM is provided, and some of the issues relating to traffic management and connection admission control are discussed. ATM traffic modelling is considered, and the models used in the thesis are briefly described. The chapter concludes with a list of the contributions made by the author in this work.
In Chapter 2, a general analytical solution for the average and variance of the population of an infinite buffer discrete-time G /D / 1 queue fed by a number of batch Markov arrival processes is developed. The solution is based on a probability generating function approach, and forms the background theory for the application to specific queueing problems in Chapters 3, 4, and 5. Consideration is also given to the analysis of multiple buffer queueing systems on the basis of the single buffer analysis.
Chapter 3 applies the results of Chapter 2 to the analysis of queues subject to ar-rivals from a heterogeneous mix of two state Markov sources. Since the exact solution technique is shown to be quite limited in the number of sources it can accommodate, several approximate solution methods are investigated for accuracy. A new approxi-mation technique is then proposed, and shown to be extremely accurate.
The queueing behaviour of a related Markov traffic model is then investigated in Chap-ter 4. This problem has a well known closed form solution for its average queue popula-tion, which is reproduced. This solution method is then combined with the analysis of Chapter 2 to finally provide a previously unknown, closed form solution for the queue population variance.
Preface xxv
investigated, with the new method of Chapter 3 shown to provide the highest accuracy.
Chapter 6 begins with an investigation of the loss probabilities of finite buffer queueing problems. An improvement to the commonly accepted relationship between the loss and tail distribution of the infinite buffer traffic is demonstrated, and the accuracy of an approximation result from the literature is confirmed. The relationship between queueing delays and queue populations are also considered in this chapter.
Chapter 7 applies the average and variance solutions developed in Chapters 3 and 5 to dual buffer queueing systems, identifying the problem of correlation between the high and low priority arrival streams. The problem of modelling the output of a ·queueing system is also investigated, with a proposed parameter matching method tested for a simple queueing system. The parameter matching method also provides exact solu-tions for the first moments of the busy periods of the output of the queueing system investigated in Chapter 4.
Finally, concluding remarks on the results of this thesis are presented in Chapter 8 ~ .. "'I along with a discussion of future topics and research directions.
The six appendices provide supplemental information for the main text of the thesis. Appendices A and C relate to the derivation of the various queueing theory results, while Appendix B provides results on an investigation into the average d~elays seen by individual traffic sources in a shared queueing system. Appendix D provides a short proof for a result that ties the definition of the autocorrelation parameter used in.the thesis to an observable physical quantity. Some practical details on the implementation of iterative queue analysis programs is provided in Appendix E, while Appendix F closes with a collection of miscellaneous mathematical relations.
Publications
This research has resulted in the following publications:
l. J. Pieloor and D. J. H. Lewis. Variance of a discrete-time G/D/1 queue fed by two-state on-off sources. Electronics Letters, 32(1):19-20, Jan. 1996.
2. J. Pieloor ahd D. J. H. Lewis. Queueing behaviour of on-off binary sources. In Proceedings Australian Telecommunication Networks and Applications
Confer-ence, pages 443-447, Dec. 1995.
xxvi Preface
and VBR traffic. In Proceedings Australian Telecommunication Networks and Applications Conference, pages 875-880, Dec. 1994.
4. D. Habibi, D. J. H. Lewis, D. T. Nguyen, and J. Pieloor. Analysis of an access node multiplexer in a system serving CBR and VBR traffic. Computer Commu-nications, 16(12):776-780, Dec. 1993.
5. J. Pieloor and D. McLaren. Accurate source models and a high performance simulator for broadband ISDN analysis. In Proceedings Australian Broadband Switching and Services Symposium, pages 523-529, July 1992.
6. D. Habibi, D. J. H. Lewis, D. T. Nguyen, and J. Pieloor. Performance of a multiplexer in a B-ISDN network with STM and ATM traffic. In Proceedings Australian Broadband Switching and Services Symposium, pages 691-698, July 1992.
Chapter 1
Introduction
Traditionally, network providers have built networks that cater exclusively for specific
'ur
services. For example, voice communication has been primarily the domain of the
•.
public switched telephone network or PSTN, while computer communications have been achieved using packet switched networks based on X.25 or similar protocols. Due to the specific nature of these networks, neither is very efficient at providing services for the other traffic type. This use of service specific transport mechanisms has been an efficient solution for both customers and network providers while the number of different services required has remained small. However, this situation is changing.Over the last two decades, the demand for new communication services has increased significantly, particularly with recent advances in computer and image processing tech-nologies. It is readily apparent that the provision of separate networks (and perhaps separate connections to customer premises) for each service is becoming inefficient due to the costs involved in maintaining the multiple networks, and from a lack of flexibility in being able to adapt to shifts in demand or the possible provision of future service types.
In 1984, the International Telegraph and Telephone Consultative Committee (CCITT)1 began to publish recommendations on the standardisation of an Integrated Services Digital Network or ISDN - a digital based network that would be capable of providing various communication services in one integrated network. By moving error recovery, flow control, and similar high level functions to the edges of the network, the use of the ISDN for switching and transmission could be made transparent to network customers.
1In 1993, the CCITT was replaced by the Telecommunication Standardisation Sector (ITU-T) of
the International Telecommumcat10n Union (ITU). We will continue to use the name CCITT in this document however.
2 Introduction
The original ISDN proposal, now referred to as narrowband ISDN (N-ISDN), provides multiple 64 kbps digital circuit switched connections that can be used either for voice telephony or computer communications. The circuit switched approach means that connections are effectively isolated from each other, with low transmission delays, and simplified connection overheads. The 64 kbps capacity of the basic circuit is due to the bandwidth requirements of voice telephony.
With the increasing transmission bandwidth requirements of new services, such as video conferencing and high speed intercomputer communication, the rather limited range of capacities available to N-ISDN services were soon seen by the telecommunication industry as inadequate. In recognition of this, the CCITT began in 1988 to concentrate on standards for a high bandwidth version of the ISDN called broadband ISDN (ISDN). Unlike the circuit switched approach of the narrowband implementation, B-ISDN is based on a packet switching methodology referred to as Asynchronous Transfer Mode or ATM.
In section 1.1, we will look at the various components of the B-ISDN, and in particular look at the role of the ATM in the implementation of the network. In section 1.2, issues relating to the management of the network, in terms of admitting and policing user connections are considered. The modelling of ATM traffic for the purposes of implementing network management strat~gies is then considered in section 1.3, and finally section 1.4 concludes the chapter by summarising the aims and contributions of this thesis.
1.1
Overview of the Broadband ISDN
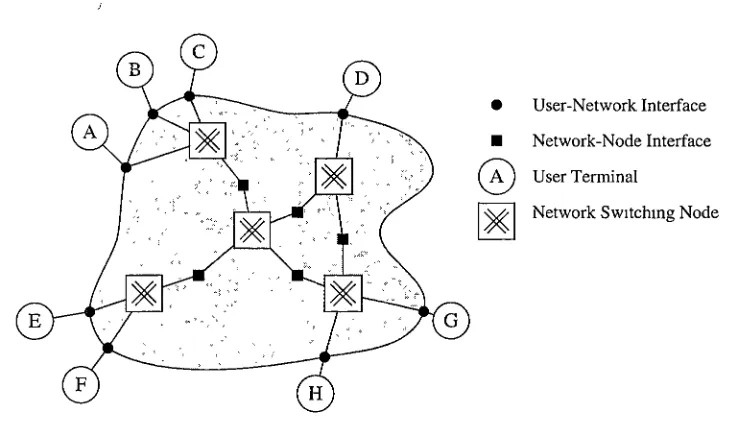
Figure 1.1 illustrates an example broadband ISDN, where customers or users gain access to the ATM based network via a standard interface called the User-Network Interface or UNI. The interface between intermediate switching nodes within the network is referred to as the Network-Node Interface or NNI.
In the following we will discuss the various components of the B-ISDN, starting with a closer look at the ATM itself.
1.1.1 The Asynchronous Transfer Mode
1.1 Overview of the Broadband ISDN 3
• User-Network Interface • Network-Node Interface
0
UserTerminal [image:25.560.120.486.81.292.2]I~
I
Network Sw1tchmg NodeFigure 1.1: Example of an ATM based B-ISDN
behaviour of one connection will not affect behaviour of another. In a packet switched network however, the bandwidth is shared amongst all connections in Sl).Ch a manner that the behaviour of each connection affects that of the others.
The main advantage of the circuit switching- approach is that, once a connection has been made, information transmitted across the network incurs only a very small and usually constant delay. Its main disadvantage is that the bandwidth that the network can provide to a connection is limited to the capacities of the circuits that the net-work supports. In addition, the dedication of a circuit to a single connection that may only use the whole circuit capacity sporadically means that the network is being underutilised.
In contrast, a packet switched network is capable of providing a very wide range of ca-pacities, allowing the requirements of each individual connection to be closely matched. As a result, more connections can potentially be simultaneously supported by such an arrangement. The disadvantages of this approach are that transmission delays in such an environment tend to be highly variable, and the shared nature of the available band-width requires extra network controls to ensure that all connections do not suffer from the misbehaviour of one.
4 Introduction
information on a per cell basis, leaving 48 bytes for user information. In addition, error detection and recovery within the network were restricted wholly to the cell headers, with similar functions for user information being moved to the network edges.
The term 'transfer mode' is used by the CCITT to indicate a specific method of trans-mitting and switching information in a network [42]. The term 'asynchronous' in the ATM label indicates that cells belonging to a particular connection may occur at ir-regular intervals on the connection medium. This is in contrast to the synchronous transfer mode or STM based approach used in digital circuit switched networks, where information belonging to a particular circuit occurs only at specific positions within a predefined constant period referred to as a 'frame'.
Virtual Channels and Virtual Paths
ATM is a connection oriented protocol, requiring a path or route to be set up through the B-ISDN before information can be sent from one user to another. This transmission path remains unchanged for the duration of the connection, and is created or assigned by signalling between the user and the network. A one way connection path between two users is described as a virtual path connection or VPC. A single VPC can support multiple virtual channel connections or VCCs, each which follow the same network path but belong to logically separate entities (such as different phone conversations between the same two customer sites). The ATM protocol guarantees that under normal (i.e. fault-free) conditions, cell sequence ~ntegrity within a VCC will be guaranteed - that is, cells belonging to a specific VCC will leave the network in the same order that they enter it2.
Cells belonging to a particular VCC and VPC are identified by a virtual channel iden-tifier (VCI) and virtual path ideniden-tifier (VPI) in the ATM header. Since a VPC will generally pass through a number of ATM switching nodes (as indicated by Table 1.1) it is not possible to guarantee the availability of a unique VPI and VCI for every net-work path. Instead, a VPC is considered to be made up of a number of links, at the end points of which the path and channel identifiers are remapped to allow for unique identification of the connection along the next link.
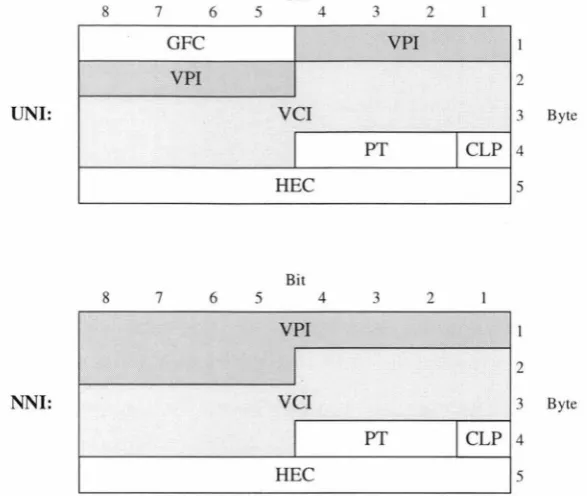
ATM Cell Header Structure
Figure 1.2 shows the structure of the 5 byte ATM cell header at the UNI and NNI, where the following fields are identified [9]:
2
1.1 Overview of the Broadband ISDN 5
Connection Type Number of nodes
Local 1-4
Toll 5-7
International 8-10
Table 1.1: Number of ATM switching nodes in typical end-to-end B-ISDN connections. These figures are from Table 1 of ITU draft recommendation E. 72x {56}.
GFC: The 4 bit Generic Flow Control field has local significance only (applies to the UNI and not the NNI) and can be used to provide standardised local functions (such as flow control) on the customer site. The value encoded in the GFC is not carried end-to-end, and is overwritten by the ATM switches.
VPI/VCI: The Virtual Path and Virtual Channel identifiers are nominally 8 and 16 bits respectively for the UNI, and 12 and 16 bits respectively for the NNI. The actual number of routing bits in these subfields however is negotiated between
the user and the network. · -/>
PT: The Payload Type field consists of 3 bits that identify the contents or payload of the ATM cell as being either user or network information.
CLP: The Cell Loss Priority is indicated by this one bit field, and allows the user or the network to optionally indicate the explicit loss priority of the cell. The use of loss priorities will be discussed in more detail in section 1.2.
HEC: The Header Error Control field is used by the physical layer for detection~ and correction of bit errors in the cell header. The HEC can also be used for cell delineation or synchronisation by observing the number of bit errors at particular points in the transmission stream.
When a cell is carrying user information (as distinct from network administration in-formation), the 48 bytes of the payload are transported transparently by the ATM network. Although errors in the cell headers are (usually) identified by the HEC and subsequently dealt with, separate errors in the cell payload will not be identified. As a result, if error handling is desired, it must be performed by end-to-end protocols.
1.1.2 B-ISDN Protocols
6 Introduction
Bit
8 7 6 5 4 3 2
GFC VPI
VPI 2
UNI: VCI 3 Byte
PT
I
CLP 4HEC 5
Bit
8 7 6 5 4 3 2
VPI
I
2NNI: VCI 3 Byte
I
PTI
CLP 4HEC 5
Figure 1.2: ATM cell header structure at the User Network and Network Node interfaces
of the B-ISDN.
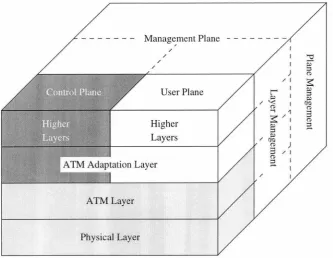
Recommendation I.321 [61] and [9]. The B-ISDN PRM is similar to the Open Systems Interconnection (OSI) PRM defined for CCITT applications in [65], but contains several planes in contrast to the single one of the OSI model.
The three planes of the B-ISDN PRM are identified as:
User Plane: Provides for the transfer of user application information. It contains
physical, ATM, and ATM adaptation layer functions required to implement the
different user B-ISDN services, as well as application specific higher layer
proto-cols.
Control Plane: Deals with call establishment and release, and other connection
con-trol functions necessary to provide switched network services. It shares the
phys-ical and ATM layers with the User plane, as indicated by Figure 1.3, in addition to its own ATM adaptation and higher layer protocols.
Management Plane: Provides overall management functions, and Lhe ability lo ex
-change information between the Control and User planes. For convenience, the Management plane is divided into sections - Layer management and Plane man-agement. The Layer management section performs layer specific management functions, while the Plane management section performs management and
[image:28.558.111.405.103.351.2]1.1 Overview of the Broadband ISDN
ATM Layer
Physical Layer
Manag~ment Plane
/
/
/ /
User Plane
Higher Layers
Figure 1.3: B-ISDN Protocol Reference Model.
7
The physical layer is responsible for all physical transport functions, such as the conver
-sion of the ATM cell bit patterns to electrical or optical signals suitable for transmis
-sion on the physical medium, synchronisation of transmitters and receivers to match
the transmission medium characteristics, and generation and confirmation of the HEC
sequence.
The ATM layer provides the multiplexing and switching functions of the B-ISDN pro
-tocol, and is independent of the physical transmission medium. In addition, this layer is responsible for the addition and removal of the cell headers, and the mapping and
translation of the cell VPI and VCI fields. We will look at some of the switching
functions of the ATM layer in the context of switch fabrics in section 1.1.4.
The ATM adaptation layer (AAL) provides a plane-specific interface to the underlying
ATM and physical layers. In particular, the AAL can provide functionality for the
handling of transmission errors, flow and timing control, and the segmentation and
reassembly of higher layer protocol data units into and out of ATM cell payloads. In
order to minimise the number of AAL protocols, the CCITT identified four different
service classes [62], as shown in Table 1.2. These service classes differ in their timing
relations, bit rates, and connection modes.
[image:29.559.141.475.94.352.2]8 Introduction
Class A
I
Class B Class C I Class DTiming between source Required Not Required
and destination
Bit rate Constant
I
VariableConnection mode Connection Oriented I Connectionless Table 1.2: AAL Service classes according to ITU-T Recommendation I.362 {62].
AAL Type 1: Corresponding to class A, this protocol provides for connection ori-ented, constant bit rate (CBR) services requiring a constrained timing relation-ship between the source and destination. N-ISDN support, and other real time or circuit emulation services will use this protocol.
AAL Type 2: Corresponding to class B, this AAL protocol provides for connection oriented services having timing constraints between the source and destination, and a variable bit rate (VBR). An example of a service requiring this protocol is VBR video.
AAL Type 3/4: Corresponding to both classes C and D, this AAL protocol was orig-inally specified as two separate types. This class provides for data transmission services using either connection oriented or connectionless methods.
AAL Type 5: Corresponding to class C only, this AAL protocol type is a simpler form of the type 3/4 protocol that provides better bandwidth efficiencies at the cost of some error handling functions.
AAL service classes A and B can be regarded as being 'delay sensitive' due to their requirements for a constrained timing relation between source and destination. Pro-vision of guaranteed transmission delays is one of the main weaknesses of the shared bandwidth nature of ATM. Similarly classes C and D can be regarded as 'loss sensitive', since these classes are primarily intended for data communications, where it is usually more important that a cell be delivered successfully by the network (i.e. not lost) than be delivered quickly. This categorisation of the four AAL service classes into delay sensitive or loss sensitive services will be discussed again in section 1.2.
1.1.3 The User Network Interface
1.1 Overview of the Broadband ISDN 9
Interface Structures and Bit Rates
Three physical cell transport mechanisms were foreseen by the CCITT [59] for the B-ISDN UNI:
• Purely ATM based interface - ATM cells can be transmitted back to back, with the entire transmission bandwidth available to be used for the transport of ATM and higher layer information.
• Non-ATM based interface - Some high speed transmission protocols, such as SONET (Synchronous Optical Network) and SDH (Synchronous Digital Hierar-chy) require a portion of the transmission bandwidth to handle physical mainte-nance, synchronisation and framing functions. ATM cells can be carried trans-parently within the payload of these protocols.
• Framed ATM based interface - To simplify interoperability between the pu_r:ely ATM and non-ATM based interfaces, physical layer cells (generated by the phys-ical layer) are inserted into the ATM layer cell stream periodphys-ically. The inserted cells are typically used to provide physical layer Operations, Administration, and Maintenance ( OAM) functions.
Purely ATM based interfaces are foreseen for smaller networks (such as private customer networks) where physical layer OAM functions are unlikely to be required [9]. For large or public networks, SDH or framed ATM based interfaces are required. Due to the,fact that some of the available link bandwidth in these latter two interfaces is dedicated to functions other than the transport of ATM layer cells, the term interface transfer rate is used to distinguish the effective transfer rate of the interface from the physical transmission rate of the link. Table 1.3 lists the four bit rates currently supported by the UNI as specified in [9] and [60]. Other interfaces may be added in future, but for the moment, the 155.52 Mbps interface is seen as the most common UNI for outgoing
(user to network) information.
Physical Rate Interface Rate Example Physical Protocol
44.736 Mbps 40.704 Mbps DS3
100 Mbps 100 Mbps 100 Mbps Multimode Fiber
155.52 Mbps 149.76 Mbps SONET STS-3
622.08 Mbps 599.04 Mbps SDH STM-4
Table 1.3: Four basic UNI bit rates and example interface protocols.
10 Introduction
Instead, a purely ATM interface is assumed, which introduces some (hopefully small) degree of error into the analytical results. This assumption, and the effect that it has on the perceived network performance is an area requiring further attention.
1.1.4 Switching and Multiplexing
Each intermediate node in the ATM network contains one or more switches which perform the routing functions for ATM cells traversing the network, which as discussed earlier, may also involve VPI and VCI translation. The three main components of an ATM switch are the input port controllers, interconnection network, and output port controllers, as illustrated in Figure 1.4. In addition to these switching components, a central processor (not shown in Figure 1.4) is required to provide ATM layer functions such as connection establishment and release, and to monitor the overall operation of the switch.
1 IPC OPC 1
Interconnection
Input Network Output
Ports Ports
(Switching Fabnc)
N
..
IPCopc,.
NFigure 1.4: Basic ATM switch configuration, showing the relationship between the input and output port controllers (labelled as !PC and OPC respectively) and the interconnec-tion network of the switch fabric. In most cases, the switch will have an equal number of input and output ports, which all operate at the same line speed.
1.1 Overview of the Broadband ISDN 11
Switches and Switch Fabrics
ATM cells are routed from the input port controllers (IP Cs) to the output port con-trollers (OPCs) through the switch interconnection network (IN). The IN provides a self-routing facility which directs a cell from each input port to an output port using the contents of the cell header. Contention may occur however if two or more cells are directed to the same output port (output blocking), or attempt to use a common link within the fabric of the interconnection network (internal blocking). In either case, only one cell can be transmitted - the others must be either discarded, or preferably stored for subsequent transmission.
There are three basic methods to provide storage (or buffering) for blocked cells within the ATM switch [105]:
Input Queueing: Buffers are provided at each IPC, so that a cell that cannot success-fully be routed to an output port (because of either internal or output blocking) waits at the input. Subsequently arriving cells are queued in arrival order. Al-though simple to implement, the main disadvantage of this method is that while the cell at the head of the queue waits to be transmitted, it delays other cells in the same input queue which might otherwise be successfully routed to other available outputs. This head of line (HOL) blocking effect limits the maximum throughput of the input queueing approach.
Output Queueing: Buffers are provided at each OPC so that multiple cells routed to the same output may be accommodated. The order of arrival of the cells at~ the output buffer (the order in which the cells are queued) is generally assumed to be random, although this will depend to a large degree on the implementation of the IN. Internal blocking can be avoided by increasing the speed of the interconnection network [5].
Shared Queueing: A single shared buffer is provided into which all cells from the IPCs are stored. A sophisticated control algorithm keeps track of the locations of the cells in this buffer, and determines which cells are to be sent to the output ports. Although cells routed to the same output port are stored in the same logical (or virtual) queue, their physical memory locations may be dispersed throughout the shared buffer. Internal blocking is not immediately obvious in this envi-ronment, but can occur in the implementation of the control algorithm. This buffering arrangement is also called central queueing, since the shared buffer is usually central to the switching element implementation.
12 Introduction
cell sequence integrity within a VCC is preserved, as required for ATM. Of the three methods, shared and output queueing appear more favoured by industry (see Table 1.4) despite the simpler implementation of input queueing. The primary reason for this is the poor throughput and higher queueing delays of the latter approach. As an example of the throughput limitation, a simple input queueing switch, using an internally non-blocking interconnection network can only achieve a maximum throughput of 0.586 erlang [69], compared to a maximum of 1.0 for shared and output queueing. Although methods for increasing the throughput and decreasing delays by reducing the HOL blocking effect are available [105], the extra complexity of their implementation can reduce the comparative advantages of input queueing.
Manufacturer Name Size Speed Buffering
IBM Corporation PRIZMA 16 x 16 400 Mbps Shared
Integrated Telecom Technology WAC-188-A 8x8 155 Mbps Shared MAZ Hamburg, GmbH SE DAS 340 4x4 155 Mbps Outi:mt MMC Networks Inc. ATMS2000 32 x 32 155 Mbps Shared Scorpio Communications · ATM JC 2x2 640 Mbps Shared Table 1.4: Size, speed, and buffering method details for 5 commercially available ATM switches as of June 1996. The size describes the number of input and output ports of the device, while the speed indicates the maximum line speed per port. The develop-ment and functional impledevelop-mentation of IBM Corporation's PRIZMA Switch-on-a-chip is presented in {21].
Although the both the output and shared buffer implementations provide logical output queues, the shared buffer approach has the advantage that the total storage space required to achieve a desired cell loss probability can be significantly reduced over that required for output buffering. Output buffering has a slight advantage over shared queueing in terms of the complexity of the interconnection network and control logic, but overall design issues tend to favour the use of a shared buffer [42].
A comprehensive survey of the many different interconnection network topologies and buffering methods available is given by Ahmadi and Denzel in [5].
Construction of Larger Switches
1.1 Overview of the Broadband ISDN 13
in a suitable fashion. There are numerous methods and topologies for implementing this interconnection, and a serious study of the field is beyond the scope of this introduction - the interested reader is directed to [100] or [5].
Networks of Queues
Within each switching element, cells may experience delays due to queueing. With multiple switching elements making up a single network node, and multiple nodes required to construct a single network path (see Table 1.1) cells belonging to a particular VPC will pass through a sequence of queues.
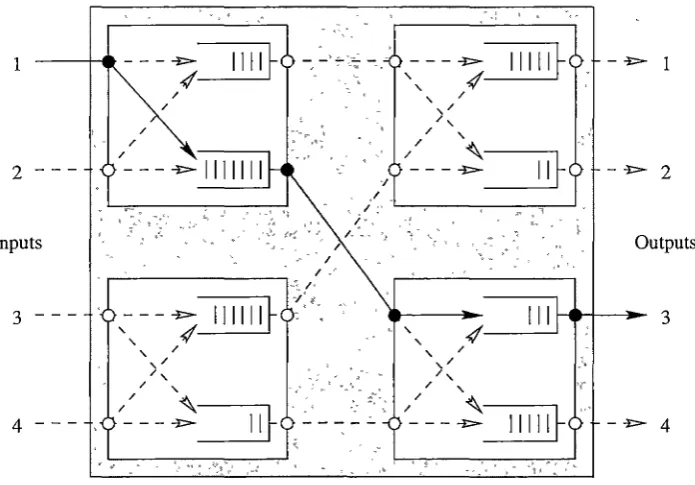
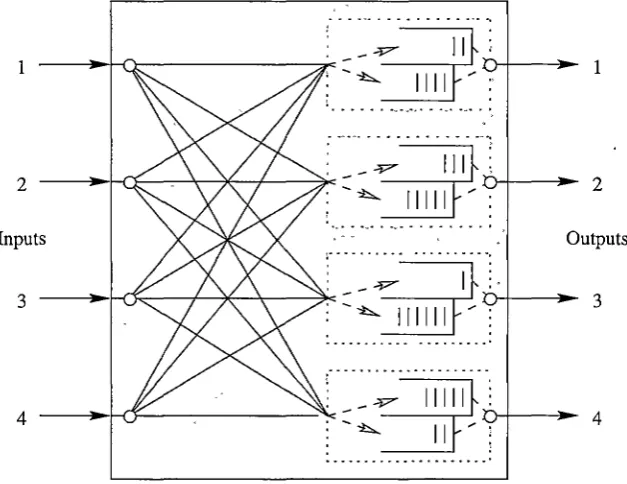
[image:35.559.132.480.433.675.2]The entire B-ISDN can in fact be envisaged as an interconnected network of queues. Figure 1.5 illustrates the basic idea for a simple interconnection of four 2 x 2 switches that might be used to construct a larger 4 x 4 switch. Cells belonging to one VPC are delayed in network queues by other cells due to contention for the output link, and may be lost entirely if a full buffer is encountered (no more space to store blocked cells). Factors such as queueing delay and cell loss are important descriptors of the performance of the network. We will look at this issue in the context of network management in the following section.
1 ---+-i• - - -
-i>-.f-~
/
/
2
-Inputs
3
4
-/
, ' / / ,'
,',
/ '1:
f,11111
~
-~11
~
-~ 2 ""'' Clh '
Outputs
111 3
-~ 4
14 Introduction
1.2
Traffic Management Issues
A customer or user will generally require the network to provide a certain quality of service (QoS) for each of its connections. That is, the performance of the network, as seen by cells on the user VPC or VCC must be within certain bounds. The parameters that are used to quantify the connection QoS will vary with the type of information being transmitted, but may include cell transfer delay, cell delay variation, and cell loss ratio [64].
In order to provide QoS guarantees, traffic3 flows into and within the ATM network are controlled by a network administration or management, which has two primary objectives:
• To ensure that the network meets the QoS requirements of established connections • To maximise the utilisation of network resources
The CCITT has defined a set of generic traffic control functions to aid in meeting these objectives [64]:
Network Resource Management: Provisioning may be used to allocate network resources for the purpose of separating traffic flows on the basis of quality of service requirements or connection type. Capacity can be reserved along certain network paths in order to accommodate peak hour usages or allow for rerouting of established connections in the event of a node or link failure [93].
Connection Admission Control: CAC is a set of actions taken by the network dur-ing the establishment of a connection that determine whether the network can accept the new connection and still meet the QoS requirements of both the ex-isting and new connections. Routing functions are also part of the CAC actions, which allows alternative routes to be investigated when establishing a new VPC. Usage Parameter Control: Each connection is admitted to the network on the basis of a set of traffic parameters that describe the potential behaviour of cells gen-erated on the VPC or VCC. If traffic on the connection violates the negotiated traffic parameters (either maliciously or unintentionally) the QoS of other con-nections within the network may be adversely affected. Usage parameter control (UPC) allows the network to monitor and optionally react to changes in the actual
3
1.2 Traffic Management Issues 15
traffic parameters. The UPC function is usually located within the user-network interface.
Traffic Shaping: Traffic shaping is a mechanism that alters the traffic characteristics of a stream of cells on a VCC or VPC to achieve a desired modification of the traffic characteristics. Examples are peak cell rate reduction, burst length limit-ing, and cell spacing. The UPC may perform traffic shaping on user traffic that violates its negotiated traffic contract.
Priority Control: As mentioned in section 1.1.1, the ATM specification provides for two loss priority levels within each cell header. Priority control allows the network to selectively discard low priority cells, provided that it can still meet the QoS objectives of the connections involved.
We will consider Connection Admission Control in section 1.2.2, but first we address the issue of priority control within the B-ISDN. While CAC allows the network to ensure that it can meet the QoS requirements of its users, priority control provides a means whereby the utilisation of the network resources can be maximised. If all connections are treated similarly, without priority distinction, then CAC and the allocation of network resources must be based on the most stringent of the QoS requirements, thus limiting the connections that the network can support [115].
1.2.1 Priority Control in the B-ISDN
"' The CCITT has identified two loss priorities for ATM. The loss priority of cells belong-ing to a particular VPC or VCC may either be set by the user (to separate information into essential cells and ordinary cells, such as might be used in layered video cod-ing [110]) or by the network (to indicate cells violatcod-ing the agreed traffic parameters at the UPC).
Provision of Loss Priorities
Loss priorities are often referred to as space priorities [72], since selective discard of cells by the network does not violate the cell sequence integrity of a VCC or VPC. Although low priority cells that violate their traffic contract may be discarded by the UPC at the network edges, the main benefit of the use of loss priorities is seen within the switching elements of the network. An ATM switch can implement loss priority distinction within switch buffers using one of two general methods [35, 68]:
16 Introduction
number of cells exceeds T, only high priority cells are accepted. The value of T
may be fixed or be adaptively controlled.
Modifications of this basic arrangement are possible. One method is to introduce hysteresis into the acceptance and rejection mechanism by providing one threshold above which low priority cells are rejected, and a second threshold below which they are accepted again. Another alternative is to count the number of low priority cells in the buffer, and use this for comparison with the threshold rather than using the total number of queued cells [18].
Pushout: Cells of both priorities are accepted to the buffer until it is full. A high loss priority cell arriving to the full buffer may push out a low priority cell that is already queued in the buffer. High priority cells are therefore not lost from the buffer until there are no low priority cells present. Low priority cells arriving to a full buffer are lost. Provision for a minimum number of low priority cells to be permitted in a full buffer can be used to provide control over the relative low priority loss rate.
An alternative proposed by Suri et al. in [127] allows cells from either loss priority to push out cells of the other priority if there are more than a certain number of those cells in the buffer. The relative numbers of cells allowed in the buffer are adjusted to provide the best loss performance for the low priority cells without violating the QoS of the high priority cells.
Numerous studies have been performed comparing these two methods [16, 72, 127], and of the two the pushout mechanism generally provides the better solution. This method provides smaller loss probabilities for both priorities, since no cells are discarded until the buffer actually becomes full, and in addition the pushout approach can ensure that no high priority cell is discarded while a low priority cell is queued. The disadvantage of the pushout method is that it requires a more complex control algorithm in order to maintain cell sequence integrity when cells are actually pushed out [72].
1.2 Traffic Management Issues 17
degree of AAL functionality to be provided within each switching node. Although this goes against the ATM philosophy to some extent, the advantages that packet discard strategies can provide to packet based data transmission appear considerable.
Provision of Delay Priorities
As we identified in section 1.1.3, the four AAL service classes recommended by the CCITT can be categorised as either loss sensitive or delay sensitive. Although two loss priorities are specified for ATM, there is no current recommendation for the explicit provision of delay priorities.
One of the arguments often used against providing delay priorities in the B-ISDN is that queueing delays will be small compared to the propagation delays of the network [35, 115]. When network utilisations are low this may indeed be the case, but as the network utilisation increases, the average number of cells stored in the switch buffers and the queueing delays associated with these, will also increase. The use of small buffer capacities (such as in the SE DAS 340 switch of Table 1.4, which provides only 10 cell positions per output buffer) was at one stage seen as necessary to limit queueing delays, but this approach also severely limits the potential utilisation of the network in terms of meeting user loss requirements.
The simplest method to provide delay priorities within ATM switching elements is to allow high priority cells to preferentially be transmitted ahead of low priority cells sharing the same switch buffer. This preferential service can be achieved by providing logically separate queues for each priority class, and then implementing a service mech-anism to select cells from each of the queues for transmission on the output link (see for example [10, 17, 55, 90, 129]). The simplest service mechanism is one that provides head of line service to the queues in order of priority [35, 134]. That is, the next cell to
~ be transmitted is chosen from the highest priority buffer having queued cells. Thus the lowest priority queue will not receive service until all the other delay priority queues are empty. It is interesting to note that of the five switching elements listing in Table 1.4, three of them provide facilities for implementing delay priorities.
18 Introduction
A Loss and Delay Priority Scheme
Where traffic priorities are considered in this thesis (Chapters 2, 5, 6, and 7) two priorities are assumed for the purpose of separating traffic into delay sensitive and loss sensitive categories. That is, we assume that traffic that is not sensitive to delay must be sensitive to loss. This two priority system can be implemented using HOL service priority and a dual buffer arrangement within the ATM switches. Output queueing will be assumed throughout. Figure 1.6 shows a simple ATM switch arrangement using two buffers per output port. The dual buffer arrangement may be realised either by providing physically separate high and low priority buffers, or by logically partitioning the one physical space.
1 1
2
Inputs Outputs
3 3
4
Figure 1.6: A simple ATM switch using dual buffers at each output port to support separation of network traffic into either delay sensitive of loss sensitive categories. The upper of each buffer pair holds delay sensitive traffic, and recives HOL service priority.
[image:40.559.101.415.300.542.2]1.2 Traffic Management Issues 19
Hullett et al. [54] discuss basically this arrangement in a design for an ATM switching element they call the Dataswitch. A peak rate allocation scheme4 is used for the high priority queue, while statistical multiplexing of data traffic is used with an early packet discard mechanism in the low priority buffer.
1.2.2 Connection Admission Control
One of the most important functions of network management is connection admission control, which aims to prevent congestion within the network by determining when new connections should be accepted by the network. Congestion occurs when the network is unable to meet the QoS requirements of its established connections [64].
In order to determine whether a new connection can be supported by the network without causing congestion, the CAC mechanism requires that the user describe the expected or predicted behaviour of the new connection through a traffic descriptor, and additionally the required quality of service through a set of QoS parameters. A traffic descriptor is made up of parameters that describe properties of the information flow on the proposed connection. The traffic parameters must be unambiguous and understandable to the user, and importantly must be able to be monitored by the UPC function of the network management [9]. Three possible candidates are:
Peak Cell Rate: This is the peak cell generation rate of the traffic, defined as~ the inverse of the minimum time ,between two cells. Equipment wishing to trans-mit information across the B-ISDN will be required to observe this limit on the generation of cells.
Average Cell Rate: The average cell rate is similarly defined as the number of cells generated by the connection divided by the duration of the connection. Since this quantity will not be known until the connection terminates, a suitable upper bound is generally used instead.
Burst Duration: Many types of traffic are bursty in nature. That is, they generate cells at or near their peak rate for periods of time but are silent (or transmitting at a significantly reduced rate) in between these 'bursts'. An example of this is the transmission of full motion video, which results in periodic bursts of data corresponding to the coding of each video frame. The burst duration traffic parameter is used to describe some measurable statistic (such as the mean or maximum length) of this behaviour.
4