Ultrashort electric pulse induced changes in cellular dielectric properties
Allen L. Garner
a,b,*, George Chen
c, Nianyong Chen
b,1, Viswanadham Sridhara
d,2,
Juergen F. Kolb
b,d, R. James Swanson
b,e, Stephen J. Beebe
b,f, Ravindra P. Joshi
b,d,
Karl H. Schoenbach
b,daBioelectromagnetism Laboratory, Department of Nuclear Engineering and Radiological Sciences, University of Michigan, Ann Arbor, MI 48109, USA b
Frank Reidy Research Center for Bioelectrics, Old Dominion University, Norfolk, VA 23510, USA c
School of Electronics and Computer Science, University of Southampton, Southampton So17 1bj, UK d
Department of Electrical and Computer Engineering, Old Dominion University, Norfolk, VA 23529, USA e
Department of Biological Sciences, Old Dominion University, Norfolk, VA 23529, USA f
Department of Physiological Sciences, Eastern Virginia Medical School, Norfolk, VA 23510, USA
Received 22 July 2007 Available online 7 August 2007
Abstract
The interaction of nanosecond duration pulsed electric fields (nsPEFs) with biological cells, and the models describing this behavior,
depend critically on the electrical properties of the cells being pulsed. Here, we used time domain dielectric spectroscopy to measure the
dielectric properties of Jurkat cells, a malignant human T-cell line, before and after exposure to five 10 ns, 150 kV/cm electrical pulses.
The cytoplasm and nucleoplasm conductivities decreased dramatically following pulsing, corresponding to previously observed rises in
cell suspension conductivity. This suggests that electropermeabilization occurred, resulting in ion transport from the cell’s interior to the
exterior. A delayed decrease in cell membrane conductivity after the nsPEFs possibly suggests long-term ion channel damage or use
dependence due to repeated membrane charging and discharging. This data could be used in models describing the phenomena at work.
Ó
2007 Elsevier Inc. All rights reserved.
Keywords: Dielectric spectroscopy; Nanosecond pulsed electric fields; Electroporation; Permeabilization; Plasma membrane; Time domain; Intracellular manipulation; Ultrashort pulses
The permeability of the cell membrane to external
mol-ecules can be dramatically increased by applying pulsed
electric fields (PEFs) above a threshold voltage
[1]. The
mechanism behind this electropermeabilization is
electro-poration, or pore formation in the cell membrane, and
usu-ally occurs for PEFs with electric fields on the order of a
few kV/cm and pulse durations on the order of 0.1–
10 ms. With the appropriate combination of these
parame-ters, electroporation is irreversible and the membrane
breaks down, which is desirable for applications ranging
from bacterial decontamination to food processing
[2].
Many applications require temporarily opening the cell
membrane to normally impermeant molecules, such as
electrochemotherapy and gene therapy
[3]. Applying pulses
with higher field strength (50–300 kV/cm) and shorter
duration (10–300 ns) do not fully charge the cell membrane
and instead interact primarily with the membranes of
intra-cellular organelles
[4]. These nanosecond duration PEFs
(nsPEFs) cause intracellular calcium release
[5,6]
and
apop-tosis-induction in cell suspensions and
in vivo
tumors
[5,7,8]. To better understand the mechanisms involved,
attempts to develop mathematical models are underway
0006-291X/$ - see front matter Ó2007 Elsevier Inc. All rights reserved. doi:10.1016/j.bbrc.2007.07.159
* Corresponding author. Present address: GE Global Research Center,
Niskayuna, NY 12309, USA.
E-mail addresses:[email protected](A.L. Garner),[email protected]
(K.H. Schoenbach).
1 Present address: Department of Medicine-Pulmonary and Critical
Care, University of Virginia School of Medicine, Charlottesville, VA 22908, USA.
2 Present address: National Center for Biotechnology Information,
National Library of Medicine, National Institutes of Health, Bethesda, MD 20892, USA.
[9]. These models depend on the electrical properties (e.g.
capacitance and resistance) of the biological cells studied,
typically HL-60 and Jurkat cell lines, which are not
gener-ally included in the literature
[10].
We used time domain dielectric spectroscopy (TDDS) to
determine the behavior of these parameters after applying
PEFs to Jurkat cells. TDDS enables us to nonintrusively
determine the electrical properties of the cell membrane,
cytoplasm, nucleus, and nucleoplasm according to the
two-shell model of the eukaryotic cell, shown in
Fig. 1 [10–12].
We note that this model has also been referred to as a
‘‘three-shell model’’
[13]; however, we follow the two-shell
nomenclature Feldman et al. TDDS can rapidly obtain
dielectric spectra over a wide frequency range with
uncer-tainties on the order 3–5% and 5–7% for the real and
imagi-nary components of the permittivity
[14], which are similar to
frequency domain systems
[15]. We previously used TDDS
to study PEF-induced changes in HL-60 suspension
conduc-tivity due to single microsecond or nanosecond PEFs
[16]
and multiple nsPEFs
[17]. In this communication, we extend
our previous TDDS analysis of cell suspensions exposed to
PEFs to include a full analysis of the temporal behavior of
the electrical properties of Jurkat cells.
Materials and methods
[image:2.595.100.486.496.722.2]Jurkat cell preparation. We used the Jurkat cell line, derived from human T-cell leukemia (America Type Culture Collection, Manassas, VA). The cells were cultured in RPMI-1640 Medium (ATCC), supple-mented with 10% fetal bovine serum and 2% penicillin/streptomycin. We verified that Jurkat cell line viability exceeded 90% by using 0.4% trypan blue (Sigma). The cultured Jurkat cells were centrifuged for 5 min at approximately 200gat room temperature and washed three times with a low-conductivity sucrose/glucose buffer (229 mM sucrose, 16 mM glucose, 1lM CaCl2, and 5 mM Na2HPO4) in triple distilled water at pH 7.4
[10,16,17]. This buffer was selected to minimize electrode polarization, or the formation of a parasitic capacitance layer near the measurement electrodes, while maintaining isotonic osmotic-pressure (280 mOsmol) and cell morphology over the measurement period[10]. The cells were then adjusted to an 8% volume fraction.
nsPEF application. After preparation, the cell suspensions were placed in Gene Pulser cuvettes (BioRad) with an electrode distance of 1 mm. A Blumlein pulse generator with an impedance of 10X provided 10 ns electrical pulses with a rise- and fall-time of 1–2 ns, limited by the employed high-pressure SF6spark gap switch[16,18]. The Blumlein
gen-erator consists of two transmission lines with equal length and impedance in series with the load impedance matching the overall impedance of the two transmission lines, 2Z0. More details can be found elsewhere[18].
The low conductivity buffer in these experiments had a higher resistance (110X) than the HBSS-based buffers used in most nsPEF experiments (10X), so we used a matching resistor to obtain an appropriate square pulse[16]. Each sample was exposed to a train of five 10 ns pulses at an electric field of 150 kV/cm. The repetition rate of the pulses was limited by the charging time of the capacitor, and was typically approximately 10 s.
TDDS measurement system. We used a Time Domain Spectrometer (IDC Expertise, UK), as shown inFig. 1 [14]. TDDS is based on trans-mission line theory in the time domain[14]. A low voltage (200 mV), rapidly increasing (40–50 ps) voltage step arrives at a sampling head, where the signal reflected from the dielectric sample (cell suspension) is also measured. TDDS uses the lumped capacitance approximation[14], which considers the sample holder as a capacitor with a complex per-mittivity that is determined by comparing the reflected signal of the sample to two standards (open and short circuit loads). We used a thermostat (Julabo, US) to maintain the temperature of the sample holder at 25°C to be consistent with past experiments[10,17,18].
Using data analysis software (IDC Expertise), we performed non-uniform sampling of a 5ls time window to obtain the dielectric spectrum of the cell suspension and estimate and remove the effects of electrode polarization and DC conductivity[10,17,18]. We used a single-exponent model to correct for electrode polarization in the coaxial sample cell[19]. Determining and removing the conductivity of the suspension from the residual charge and performing a Fourier Transform of the remaining signal yields the real and imaginary components of permittivity of the cell suspension.
Two-shell model for eukaryotic cells. At this point, we applied the two-shell model of the cell, shown inFig 1and discussed in more detail
where [10]. In addition to these eight dielectric parameters, the model requires three geometric parameters. Only 6 of these 11 parameters can be solved for using the two-shell model, while the other parameters must be determined independently and fixed [10]. We set the cell membrane thickness (7 nm), nuclear envelope thickness (14 nm), nuclear volume fraction (0.70), cytoplasm permittivity (ecp= 60), and nucleoplasm
per-mittivity (enp= 120)[10]. We measured the average Jurkat cell radius to be
5.2lm. This is smaller than the radius of 7–8lm reported by other groups
[20]but agrees well with the radius of 5.18lm obtained by another group
[21]. Smaller cells could appear for a number of reasons, such as cell culture contamination or state in the cell cycle. Our measurement appears to be on the lower end of the reported scale. Furthermore, electroper-meabilized cells can shrink to 60–70% of their initial volume (corre-sponding to 84–89% of their initial radius) after PEF application[22]. We observed that the radius decreased to 90% of the initial radius 1 min after the pulse and was between 93% and 94% for all times studied thereafter.
Protocol. After preparing the cell suspension, we placed a sample of control or pulsed suspension into the sample holder and measured the dielectric spectrum at 1, 5, 10, 15, and 20 min after PEF application. We periodically alternated between initially measuring the control or the pulsed sample to ensure that our observations were not artifacts due to the cells being in suspension over time. We did not observe any appreciable sedimentation over 30 min of measurement based on the control’s cell suspension conductivity changes[17]. Details on the analysis of the real signal and subsequent correction for electrode polarization, suspension conductivity, and the two-shell model are provided elsewhere[10].
Results
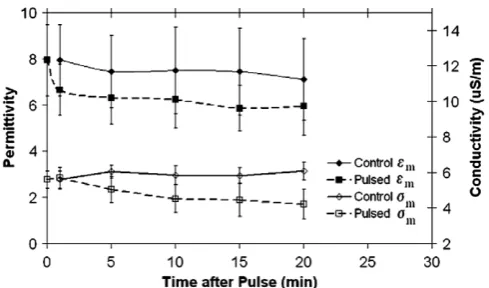
Fig. 2
shows
e
mand
r
mversus time after PEF
applica-tion. The permittivity, and thus the capacitance, of the cell
membrane of pulsed Jurkat cells was consistently lower
than that of the control. To determine the statistical
signif-icance of this and other differences, we conducted Student’s
t
-test
[23]. One minute after the pulse, the
t
-test probability
(
P
) for
e
mis 0.057, meaning that the difference is borderline
statistically significant (
P
< 0.05 for statistical significance).
For all other times, the difference is not statistically
signif-icant (0.09 <
P
< 0.21). For
r
m, the difference between the
control and pulsed cells after 1 min is not statistically
sig-nificant (
P
= 0.58). The difference between
r
mfor the
con-trol and pulsed cells at all other points is statistically
significant (
P
< 0.01).
Fig. 3
shows
r
cpas a function of time after PEF
appli-cation. The cytoplasm conductivity decreased dramatically
and significantly (
P
< 0.01) within 1 min after
PEF-appli-cation. From 1 min to 20 min after PEF-application,
r
cpof the pulsed cells decreased from 0.16 S/m to 0.10 S/m
while the control remained essentially constant (0.25 S/m
to 0.22 S/m). The difference between
r
cpof the control
and pulsed cells was statistically significant (
P
< 0.01) for
all times.
The results for
e
neand
r
neobtained from TDDS and
fit-ting with the two-shell model were inconclusive concerning
a PEF-induced effect are not shown.
Fig. 4
shows
r
npas a function of time after PEF
appli-cation. As with
r
cp,
r
npfor the pulsed cells decreased
signif-Fig. 2. Cell membrane permittivity (em) and conductivity (rm) versus time
[image:3.595.319.554.69.246.2]after nsPEF application. The results are based on fitting experimental data from five control and nine pulsed samples to the two-shell model. Error bars are calculated using standard deviation.
Fig. 3. Cytoplasm conductivity (rcp) versus time after nsPEF application.
The electric pulses causercpto decrease, indicating ion transport from
inside the cell to the external media. The results are based on fitting experimental data from five control and nine pulsed samples to the two-shell model. Error bars are calculated using standard deviation.
Fig. 4. Nucleoplasm conductivity (rnp) versus time after nsPEF
applica-tion. The electric pulses causernpto decrease, indicating that ions are
[image:3.595.318.554.513.687.2] [image:3.595.46.291.555.699.2]icantly (
P
< 0.05) within 1 min of PEF application from
0.49 S/m to 0.31 S/m. From 1 min to 20 min,
r
npdecreased
from 0.31 S/m to 0.18 S/m for the pulsed cells and only
from 0.48 S/m to 0.42 S/m for the control cells. The
differ-ence between the control and pulsed cells was statistically
significant (
P
< 0.01) for all times beyond 5 min.
As with previous results for lymphocytes,
r
npdiffers
from
r
cpby a factor 1.9–2.0 for the control
[13,14]. The
ratio between
r
npand
r
cpremained between 1.8 and 2.0
after pulsing.
Discussion
The overall results summarized in
Fig. 2
through
Fig. 4
are consistent with the range of experimental values for
eukaryotic cells obtained from the two-shell model
[24].
The values we obtained for
r
m,
r
cp,
r
np,
e
ne, and
r
ne(data
not shown for
e
neand
r
ne) are lower than those obtained
for other malignant T-cell lines while
e
mis in line with these
results
[10,11]. These differences could be attributed to the
cell lines we are considering here, different cell preparation
techniques, or the number of cell passages; however, our
results were consistent with each other and the standard
deviations are similar to those obtained in Ref.
[10].
When electroporation occurs,
the cell membrane
becomes more permeable to molecules and ions that are
sufficiently small to traverse the pores. The prevalent
the-ory is that the cell membrane must be charged to a voltage
in excess of 1 V for a sufficient period of time to generate a
pore
[25]. Furthermore, the cell can recover (i.e. the pores
reseal) as long as the pore radius remains below a certain
critical radius,
r
crit[25,26]. While 10 ns pulses are generally
too short to induce electroporation
[4], applying multiple
pulses charges the cell membrane more, increasing the
like-lihood of exceeding
rcrit
[26]. Using a lower conductivity
buffer also reduces the electroporation threshold for
nsPEFs
[27]. Applying a single 11 ns, 160 kV/cm pulse to
a cell suspension with conductivity of approximately
0.1 S/m resulted in slightly less than 10% of the cells taking
in propidium iodine
[27]. Here, we applied five pulses with
similar parameters, likely increasing the fraction of cells
electropermeabilized.
Figs. 3 and 4
show the behavior of cytoplasm and
nucle-oplasm conductivity as a function of time. The control
value
of
r
cpfalls
within
the
range
of
values
(0.033 <
r
cp< 1.1 S/m) stated by Ermolina et al.
[24].
How-ever, it is lower than those stated elsewhere in the literature
[28]. One must consider that these analyses used a
single-shell model, so they considered the nucleus and cytoplasm
together, which would make
r
cplarger than in the two-shell
model
[10].
Our results suggest that this pulse combination with the
low conductivity buffer induces noticeable ion transport, as
illustrated by a 14% rise in cell suspension conductivity,
which is comparable to the conductivity rise observed for
a single 50
l
s pulse of the same energy
[17].
Figs. 3 and 4
show that
r
cpand
r
npboth decreased dramatically and
sig-nificantly following nsPEF application, indicating
pulse-induced ion transport. This is consistent with preliminary
fluorescent
experiments
where
applying
five
10 ns,
150 kV/cm pulses or a single 10 ns, 300 kV/cm pulse to
Jur-kat cells causes a large drop in Na+ and K+ fluorescence
[17]. Both
r
cpand
r
npcontinued to decrease for up to
10 min after the pulse, indicating ongoing ion transport
and that full membrane recovery may take on the order
of 10 min to occur. The maintenance of the factor of two
ratio between
r
cpand
r
npsuggests that the nuclear
enve-lope remained a diffusion barrier and that its ion channels
could be maintaining this equilibrium
[29].
While cell suspension conductivity,
r
cp, and
r
npclearly
show that ions are leaving the nucleoplasm and
cyto-plasm (r
cp0.23 S/m) for the surrounding buffer (r
0.10 S/m), the resulting changes in
r
m(Fig 4) are less
apparent. Because electroporation raises the permeability
of the cell membrane to all molecules and ions, one
would expect
r
mto rise after the pulse, as observed in
electroporation experiments
[30]
and in experiments by
our group for Jurkat cells exposed to a 6 kV/cm,
300 ns pulse (K.H. Schoenbach, personal
communica-tion). However,
Fig 2
shows that the conductivity
actu-ally does not change significantly 1 min after the pulse
and actually
decreases
after that.
Since the largest portion of the change in
r
cpand
r
nphas
already occurred within 5 min after pulse application, the
majority of ion transport has occurred during this time.
The subsequent leveling of these conductivities suggests
membrane recovery. The preliminary increase in
r
mmay
have occurred and already recovered prior to the first
TDDS measurement with the membrane mostly recovered
in this timeframe, as suggested by modeling
[26]. However,
one would anticipate that
r
mwould remain at the control
value following recovery.
The long-term decrease in
r
mcould arise due to a
change in ion channel structure and/or function. PEFs
could damage ion channels. While not yet investigated
for multiple nsPEFs, ionizing radiation dramatically and
rapidly (within
1 s) lowers
r
mby inactivating gramicidin
channels and reducing the formation rate of open
gramici-din channels
[31]. Another possibility could be use
depen-dence, a ‘‘blockade’’ of effected ion channels that occurs
due to repeated cycles in membrane potential
[32].
Fig. 3
shows
e
mas a function of time for both control
and pulsed samples. For the control,
e
mvaried between 6
and 8, corresponding to a membrane capacitance,
C
m,
between 7.6 mF/m
2and 10 mF/m
2(
C
m=
e
me
0/
d
, where
d
is the membrane thickness). The typical value for the
iso-tonic
Cm
of Jurkat cells is approximately 14 mF/m
2[20].
However, our measurements are within the typical range
for T cells, which Pethig et al. lists as 6–15 mF/m
2[21].
statistical significance, indicating negligible long-term
nsPEF-induced effect.
Because nsPEFs interact with intracellular organelles
[4], one would anticipate strong effects on
e
neand
r
ne;
how-ever, the impact of nsPEFs upon both
e
neand
r
neon the
timescales of interest was inconclusive. This could be due
to measurement system sensitivity, the timescale on which
nuclear effects occur (modeling suggests that nuclear
enve-lope voltage decays to 0 within 300 ns
[26]), or the large
number of pores already present in the nuclear envelope
masking the permeabilization.
These results indicate that multiple nsPEFs alter the
structure and function of cell structures. Adapting the
TDDS technique to allow real-time measurement (on the
order of
l
s) of the dielectric spectra would permit a more
direct study of pulse-induced effects. Improving
measure-ment sensitivity may permit determination of the
impor-tance and significance of slight changes of the nuclear
envelope.
Acknowledgments
This work was supported in part by an Air Force Office
of Scientific Research (AFOSR) DOD MURI grant on
Subcellular Response to Narrow Band and Wide Band
Radio Frequency Radiation, administered by Old
Domin-ion University, and in part by an AFOSR grant on
bioin-spired concepts. One author (ALG) was supported by a
National Defense Science and Engineering Graduate
Fel-lowship sponsored by the Department of Defense. G.C.
is grateful to the University of Southampton for granting
him study leave. The authors appreciate the assistance
pro-vided by Wentia Ford, Rachael Shevin, Elizabeth Coon,
and Kris Ball. The authors also thank David Jordan,
Mi-chael Mayer, Uwe Pliquett, MiMi-chael Uhler, Ron
Gilgen-bach, and Y.Y. Lau for many stimulating discussions.
We are also grateful for insight into data analysis
proce-dures and software provided by Yoshihito Hayashi, Irina
Ermolina, and Yuri Feldman.
References
[1] J. Teissie, N. Eynard, B. Gabriel, M.P. Rols, Electropermeabilization of cell membranes, Adv. Drug Del. Rev. 35 (1999) 3–19.
[2] K.H. Schoenbach, R.P. Joshi, R.H. Stark, F.C. Dobbs, S.J. Beebe, Bacterial decontamination of liquids with pulsed electric fields, IEEE Trans. Diel. Elec. Insul. 7 (2000) 637–645.
[3] D. Rabussay, N.B. Dev, J. Fewell, L.C. Smith, G. Widera, L. Zhang, Enhancement of therapeutic drug and DNA delivery into cells by electroporation, J. Phys. D: Appl. Phys. 36 (2003) 348–363. [4] K.H. Schoenbach, R.P. Joshi, J.F. Kolb, N. Chen, M. Stacey, P.F.
Blackmore, E.S. Buescher, S.J. Beebe, Ultrashort electrical pulses open a new gateway into biological cells, Proc. IEEE 92 (2004) 1122– 1137.
[5] S.J. Beebe, J. White, P.F. Blackmore, Y. Deng, K. Somers, K.H. Schoenbach, Diverse effects of nanosecond pulsed electric fields on cells and tissues, DNA Cell Biol. 22 (2003) 785–796.
[6] E.S. Buescher, R.R. Smith, K.H. Schoenbach, Submicrosecond intense pulsed electric field effects on intracellular free calcium:
mechanisms and effects, IEEE Trans. Plasma Sci. 32 (2004) 1563– 1572.
[7] S.J. Beebe, P.M. Fox, L.J. Rec, K. Somers, R.H. Stark, K.H. Schoenbach, Nanosecond pulsed electric fields (nsPEF) effects on cells and tissues: Apoptosis induction and tumor growth inhibition, IEEE Trans. Plasma Sci. 30 (2002) 286–292.
[8] S.J. Beebe, P.M. Fox, L.J. Rec, E.L. Willis, K.H. Schoenbach, Nanosecond, high-intensity pulsed electric fields induce apoptosis in human cells, Fed. Am. Soc. Exp. Biol. J. 17 (2003) 1493–1495. [9] R.P. Joshi, Q. Hu, K.H. Schoenbach, Modeling studies of cell
response to high-intensity electric fields—implications for intracellu-lar manipulation, IEEE Trans. Plasma Sci. 32 (2004) 1677–1686. [10] Y. Polevaya, I. Ermolina, M. Schlesinger, B.-Z. Ginzburg, Y.
Feldman, Time domain dielectric spectroscopy study of human cells II. Normal and malignant white blood cells, Biochim. Biophys. Acta 1419 (1999) 257–271.
[11] Y. Feldman, I. Ermolina, Y. Hayashi, Time domain dielectric spectroscopy study of biological systems, IEEE Trans. Diel. Elec. Insul. 10 (2003) 728–753.
[12] A. Irimajiri, Y. Doida, T. Hanai, A. Inouye, Passive electrical properties of cultured murine lymphoblast (L5178Y) with reference to its cytoplasmic membrane, nuclear envelope, and intracellular phases, J. Membr. Biol. 38 (1978) 209–232.
[13] J. Gisma, P. Marszalek, U. Loewe, T.Y. Tsong, Dielectrophoresis and electrorotation of neurospora slime and murine myeloma cells, Biophys. J. 60 (1991) 749–760.
[14] Y. Feldman, A. Andrianov, E. Polygalov, I. Ermolina, G. Romany-chev, Y. Zuev, B. Milgotin, Time domain dielectric spectroscopy: An advanced measuring system, Rev. Sci. Instrum. 67 (1996) 3208–3216. [15] F. Bordi, C. Cametti, J.S. Tan, D.C. Boris, W.E. Krause, N. Pluckateesak, R.H. Colby, Determination of polyelectrolyte charge and interaction with water using dielectric spectroscopy, Macromol-ecules 35 (2002) 7031–7038.
[16] A.L. Garner, N. Chen, J. Yang, J. Kolb, R.J. Swanson, K.C. Loftin, S.J. Beebe, R.P. Joshi, K.H. Schoenbach, Time domain dielectric spectroscopy measurements of HL-60 cell suspensions after micro-second and nanomicro-second electrical pulses, IEEE Trans. Plasma Sci. 32 (2004) 2073–2084.
[17] G. Chen, N. Chen, A.L. Garner, J. Kolb, R.J. Swanson, S. Beebe, R.P. Joshi, K.H. Schoenbach, Conductivity in Jurkat cell suspension after ultrashort electric pulsing, in: Proceedings of the 3rd Interna-tional Workshop on Biological Effect of EMFs, Kos, Greece, vol. 1, 2004, pp. 56–65.
[18] J.F. Kolb, S. Kono, K.H. Schoenbach, Nanosecond pulsed electric field generators for the study of subcellular effects, Bioelectromag-netics 27 (2006) 172–187.
[19] Y. Feldman, E. Polygalov, I. Ermolina, Yu. Polevaya, B. Tsentsiper, Electrode polarization correction in time domain dielectric spectros-copy, Meas. Sci. Technol. 12 (2001) 1355–1364.
[20] M. Kiesel, R. Reuss, J. Endter, D. Zimmermann, H. Zimmermann, R. Shirakashi, E. Bamberg, U. Zimmermann, V.L. Sukhorukov, Swelling-activated pathways in human T-lymphocytes studied by cell volumetry and electrorotation, Biophys. J. 90 (2006) 4720–4729.
[21] R. Pethig, V. Bressler, C. Carswell-Crumpton, Y. Chen, L. Foster-Haje, M.E. Garcia-Ojeda, R.S. Lee, G.M. Lock, M.S. Talary, K.M. Tate, Dielectrophoretic studies of the activation of human T lymphocytes using a newly developed cell profiling system, Electro-phoresis 23 (2002) 2057–2063.
[22] R. Shirakashi, V.L. Sukhorukov, I. Tanasawa, U. Zimmermann, Measurement of the permeability and resealing time constant of the electroporated mammalian cell membranes, Int. J. Heat Mass Transfer 47 (2004) 4517–4524.
[23] S.A. Glantz, Primer of Biostatistics, 4th Ed., McGraw-Hill, New York, 1997, 65-105.
[25] J.C. Weaver, Yu.A. Chizmadzhev, Theory of electroporation: a review, Bioelectrochem. Bioenergy 41 (1996) 135–160.
[26] R.P. Joshi, K.H. Schoenbach, Mechanism for membrane electropor-ation irreversibility under high-intensity, ultrashort electrical pulse conditions, Phys. Rev. E 66 (2002) 052901.
[27] K.J. Mu¨ller, V.L. Sukhorukov, U. Zimmermann, Reversible electr-opermeabilization of mammalian cells by high-intensity, ultra-short pulses of submicrosecond duration, J. Membrane Biol. 184 (2001) 161–170.
[28] Y. Huang, X.-B. Wang, P.R.C. Gascoyne, F.F. Becker, Membrane dielectric responses of human T-lymphocytes following mitogenic stimulation, Biochim. Biophys. Acta 1417 (1999) 51–62.
[29] M. Mazzanti, Ion permeability of the nuclear envelope, News Physiol. Sci. 13 (1998) 44–50.
[30] M. Schmeer, T. Seipp, U. Pliquett, S. Kakorin, E. Neumann, Mechanism for the conductivity changes caused by membrane electroporation of CHO cell-pellets, Phys. Chem. Chem. Phys. 6 (2004) 5564–5574.
[31] G. Stark, The effect of ionizing radiation on lipid membranes, Biochim. Biophys. Acta 1071 (1991) 103–122.
[32] J.A.H. Verheugen, H.P.M. Vijverberg, M. Oortgiesen, M.D. Cahalan, Voltage-gated and Ca2+-activated K+ channels in
![Fig. 1. Block diagram of the TDDS system, including shapes of the incident (left) and reflected (right) voltage signals and the two-shell model of alymphocyte, where e is the permittivity and r is conductivity [11].](https://thumb-us.123doks.com/thumbv2/123dok_us/8492124.344931/2.595.100.486.496.722/diagram-including-incident-reected-voltage-alymphocyte-permittivity-conductivity.webp)