The 2008 floods in Queensland:
A case study of vulnerability,
resilience and adaptive capacity
ch Pr
ogram
Case studies of extreme events
ISBN: 978-1-921609-18-3
NCCARF Publication 16/10
© University of Southern Queensland 2010
Please cite this report as:
Apan, A., Keogh, D.U., King, D., Thomas, M., Mushtaq, S. and Baddiley, P. 2010. The 2008 Floods in Queensland: A Case Study of Vulnerability, Resilience and Adaptive Capacity. Report for the National Climate Change Adaptation Research Facility, Gold Coast, Australia.
Author contact details
Enquiries should be addressed to:Assoc. Prof. Armando Apan Project Leader
Australian Centre for Sustainable Catchments University of Southern Queensland
Toowoomba. Queensland 4350 T: +61 3 4631 1386
Email: [email protected]
This work was supported financially by the Australian Government and the partners in the NCCARF consortium. The views expressed herein are not necessarily the views of the Commonwealth, and the Commonwealth does not accept responsibility for any information or advice contained herein.
The National Climate Change Research Facility (NCCARF) is undertaking a program of Synthesis and Integrative Research to synthesise existing and emerging national and
international research on climate change impacts and adaptation. The purpose of this program is to provide decision-makers with information they need to manage the risks of climate change.
This report on the 2008 Floods in Queensland: Charleville and Mackay forms part of a series of studies/reports commissioned by NCCARF that look at historical extreme weather events, their impacts and subsequent adaptations. These studies examine particular events – primarily extremes – and seek to explore prior vulnerabilities and resilience, the character and
management of the event, subsequent adaptation, and the effects on present-day vulnerability. The reports should inform thinking about adapting to climate change, i.e. capacity to adapt, barriers to adaptation, and translating capacity into action. While it is recognised that the comparison is not and never can be exact, the overarching goal is to better understand the requirements of successful adaptation to future climate change.
This report highlights the 2008 floods in Queensland. In this case study, we compare the impact of flooding, the response at the time and subsequent adaptations in two Queensland towns, Charleville and Mackay. Both towns were flooded in early 2008: Charleville in a widespread and slowly developing event in January; Mackay in a flash flood in February. In January 2008, flood-producing rains occurred along the Queensland coast between
Townsville and Mackay and inland over central and southwestern Queensland. These heavy rains were associated with a low pressure centre tracking southward across the state, the remnant of Tropical Cyclone Helen. Coastal and inland river catchments flooded. The Warrego River, which flows along the northern edge of Charleville, rose by 6m, peaking on 22 January, and Bradley’s Gully, which flows through the middle of town, rose by 3m, peaking on the 18 January. The coastal region of Mackay experienced minor flooding in the January event. However, on 15 February, an intense and localised rainstorm produced a flash flood that damaged 4000 houses, caused schools to close and damaged the local road
network. Power was lost to 6200 homes and mobile and land line communications were disrupted.
Other reports in the series are: Cyclone Tracy
East Coast Lows and the Newcastle-Central Coast Pasha Bulker storm Storm tides along east-coast Australia
Heatwaves: The southern Australian experience of 2009
Drought and the Future of Rural Communities: Drought impacts and adaptation in regional Victoria, Australia
Drought and water security: Kalgoorlie and Broken Hill
To highlight common learnings from all the case studies, a Synthesis Report has been produced which is a summary of responses and lessons learned.
Table of Contents
List of Figures...2
List of Tables ...2
Executive Summary ...2
1 Introduction...7
1.1 Background... 7
1.2 Significance of the Study... 7
1.3 Objectives and Hypotheses... 8
2 Literature Review ...9
2.1 Introduction ... 9
2.2 Flood Management in Australia ... 9
2.3 Social Impacts and Social Capital ... 12
2.4 Natural Disaster Preparedness, Resilience, Vulnerability and Adaptation... 12
2.5 Flood Mitigation Measures... 17
2.6 Insights from International and Local Flood Studies ... 18
3 Case Study Area...22
3.1 Charleville and its Flood History... 22
3.2 Mackay and its Flood History ... 25
3.3 Impact of the 2008 Charleville Flood... 29
3.4 Impact of the 2008 Mackay Flood... 30
3.5 Disaster Management and Flood Warning Systems ... 31
4 Research Methods...33
4.1 Data Collection ... 33
4.2 Data Analysis... 38
5 Results and Discussion...39
5.1 Introduction ... 39
5.2 Impacts of the 2008 Floods ... 39
5.3 Vulnerability... 48
5.4 Flood Mitigation Measures and State Planning Policy 1/03 ... 54
5.5 Resilience ... 59
5.6 Adaptive Capacity ... 69
6 Synthesis...83
6.1 Resilience: Social Networks ... 83
6.2 Vulnerability: Resilience and Adaptive Capacity... 85
6.3 Resilience: Flood Mitigation Measures ... 88
6.4 Adaptive Capacity: Migration as an Option ... 92
7 Conclusions and Recommendations...95
7.1 Conclusions ... 96
7.2 Recommendations ... 97
Acknowledgements ...99
References...100
List of Figures
Figure 2.1. Vulnerability and its components... 13
Figure 2.2. Characteristics of vulnerability in the context of natural disasters... 14
Figure 3.1. Charleville town Map... 22
Figure 3.2. Warrego River Catchment... 23
Figure 3.3. Significant flood peaks which have occurred at Warrego River in Charleville ... 24
Figure 3.4. Pioneer River Catchment ... 26
Figure 3.5. History of Mackay floods caused by flooding of the Pioneer River ... 26
Figure 3.6. Hourly Hyetographs for Mackay ALERT station ... 27
Figure 3.7. GHD calculations of 1-in-500 year ARI flood event of 15 February 2008 flood disaster event... 28
Figure 3.8. Hydrological map of 15 February 2008 flood disaster event ... 28
Figure 4.1. General spatial features of the Charleville sampling area. ... 35
Figure 4.2. Flood affected dwellings in North Mackay based on 100 year design flood event ... 37
Figure 5.1. (a) Part of the Gooseponds and Barnes Creek Road, North Mackay, 15 February 2008, (b) Part of Warrego River and Charleville, 20 January 2008 ... 39
Figure 5.2. Business premises flooded in Charleville... 41
Figure 5.3. Buildings of institutions flooded in Charleville ... 45
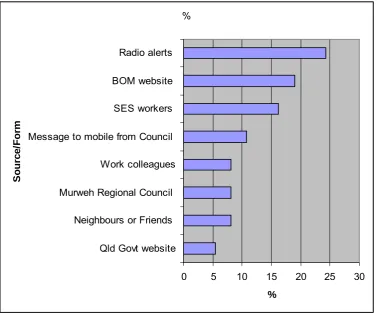
Figure 5.4. Source or form of communication rated as most helpful for institutions in updating developments of the 2008 flood in Charleville (could select more than one) ... 46
Figure 5.5. Businesses’ concern about the risk of flood ... 51
Figure 5.6. Extent to which businesses believe some circumstances about flood events ... 52
Figure 5.7. How prepared Charleville institutions consider their organisations were for the 2008 flood ... 53
Figure 5.8. Perception of extent to which different events could affect institutions in Charleville... 53
Figure 5.9. Householder educational qualifications ... 60
Figure 5.10. Householder understanding of levels of responsibility different groups have to protect them from floods ... 61
Figure 5.11. How householders feel about living in their community ... 63
Figure 5.12. How residents feel about their community... 63
Figure 5.13. Some people in the community who helped during the construction of temporary levee during the 2008 flood in Charleville... 64
Figure 5.14. Duration of business operation... 65
Figure 5.15. Educational qualifications of business respondents ... 65
Figure 5.16 Businesses' understanding as to the levels of responsibility different groups have to protect them from floods ... 66
Figure 5.17. Levels of institutional concern in Charleville about the risk of floods... 67
Figure 5.18. Volunteer organisations institutional staff in Charleville are involved in ... 68
Figure 5.19 How prepared Charleville institutions feel these organisations are for future flooding events ... 68
Figure 5.20. Scale of responsibility Charleville institutions believe should protect the community from floods ... 69
List of Tables
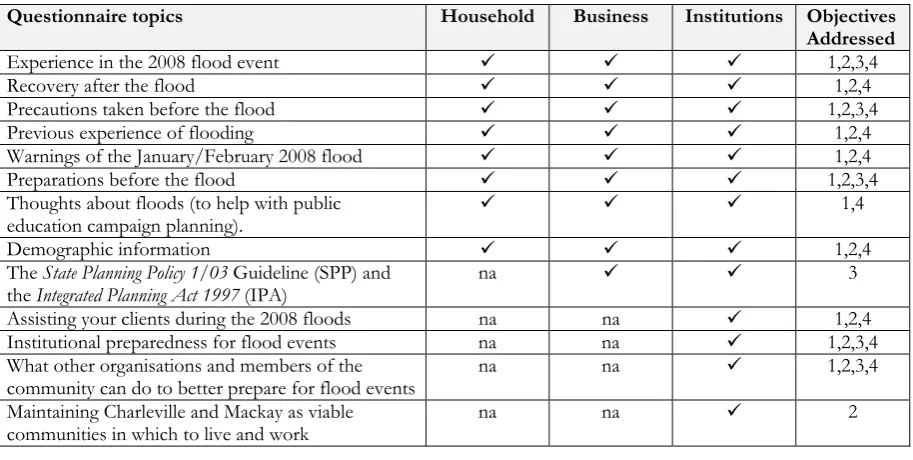
Table 4.1. Questionnaire topics relevant to sample group surveys... 34Table 4.2. Total sample, non-contacts and response rates ... 35
Table 5.1. What institutions believe could be done in Charleville to better cope with flood events ... 80
Executive Summary
Climate change is a major and urgent issue of global significance. In Australia, its effects are already being experienced in the form of higher temperatures and more frequent extreme events. A warmer climate will increase the risk of floods, while continued and frequent severe flooding will be “virtually certain” during the twenty-first century. This could cause more severe damage to people, property, and the environment in Australia where flooding is already the nation’s costliest form of natural disaster. Losses from floods are estimated at over $300 million a year.
Adaptation strategies are needed for floods at local and regional scales which consider the impacts on both individuals and societies. To this end, a sound understanding is needed of not only an area’s bio-physical and socio-demographic attributes, but of a community’s vulnerability, adaptive capacity and resiliency. It is important to evaluate the effectiveness of flood mitigation measures and also gain insights into how communities may cope with repeated and more frequent events and their ability to cope and endure.
This report presents an historical case study of the 2008 floods in Charleville and Mackay. These towns were considered representative of a small inland outback town and a large coastal city (respectively), and both towns have significant areas situated on highly vulnerable flood plains.
The aim of this study was to understand how societies that are regularly flooded respond and adjust to flood events and the extent of their resilience; the characteristics of communities that may be considered ‘on the edge’, where flooding might push them into non-viability; the extent to which flood mitigation measures (including State Planning Policy 1/03) have been applied to reduce the vulnerability to flood events; and to identify the characteristics of vulnerability, resilience and adaptive capacity to flooding of households, businesses and institutions.
Charleville has a well-documented history of floods since 1910 mainly from the Warrego River and has suffered more than 10 major floods which have isolated the town and caused major disruptions to road and rail links. Its most recent major floods occurred in 1990, 1997 and 2008. The 2008 inundation flood occurred when Bradley’s Gully peaked at 3.1 m. In comparison, flooding from the Pioneer River poses the greatest geohazard threat in Mackay with the highest flood recorded in 1958 peaking at 9.14 m. The 2008 flood studied was a flash flood, caused by intense local rainfall.
A purposive sampling research design was used to conduct three phases of data collection. Each phase targeted at a different group of stakeholders: household residents, businesses and government institutions. Two types of survey instruments were used, i.e. structured questionnaires and semi-structured face-to-face interviews. Household and business participants were restricted to those affected by the 2008 floods in the case study regions. Data were analysed using appropriate quantitative and qualitative techniques
The elderly were found to have lower levels of resilience, and in Charleville, temporary accommodation resources were limited. Psychological impacts of the flood were highlighted particularly in the Mackay population, who due to a large itinerant population are less likely to be experienced in coping with flood events, as compared to Charleville residents. Only 8 % of Mackay businesses felt they were significantly or very prepared for the flood event with only 15 % receiving a warning of the flood event and few considered floods a threat to personal safety. In comparison, Charleville businesses consider the risk of floods as a threat to business activities and they actively think about, talk about and source information on floods.
A variety of flood mitigation measures (including State Planning Policy 1/03) have been applied to different extents to reduce the vulnerability of communities to flood events. In Charleville, the Murweh Shire Council has a flood overlay as part of the Town Plan. The industrial area is outside the flood prone area, and new commercial premises in the flood area are required to have an upstairs area or an Evacuation Management Plan. Habitable dwellings need to be at least 300 mm above the last known flood height (i.e. 300 mm above the 1997 flood height level), and the Council is using the Queensland 1-in-100 height.
In Mackay, the minimum building floor level is 300 mm above the defined flood event. This has resulted in the building of houses on slabs on the ground to reach this height. Consequently, this policy may be having the effect of contributing to the development of wetlands, storm surge and flood prone areas by effectively advocating infilling or reclamation of land to ensure that development is above the 1 % AEP (100-year Annual Recurrence Interval (ARI). It is cheaper to build houses on slabs as opposed to traditional methods that use houses built on stilts.
Charleville residents displayed high levels of resilience having strong personal networks, high levels of sense of belonging in the community, participation in community activities and good levels of tertiary education. Residents believed that they have a responsibility for preparing for floods. Similarly, Mackay households were found to have high sense of belonging to the community. However, they expressed low levels of personal responsibility when it came to preparing for flood events. In addition, just over half the Mackay residents had never experienced a flood event before and hence may have few frameworks for coping. The community itself has low rates of formal volunteerism rates (although there may be informal networks) and generally lower participation rates in the community. In both case study regions, more than 60 % of residents had lived in their town for more than 10 years.
With regards to adaptive capacity of householders, many Charleville and Mackay residents were found to be putting into practice advice given on floods. Most respondents would not move to another town or to another area of either Mackay or Charleville, respectively, if another flood affected their property. The decision to stay may be interpreted as in indication of resilience. However, a decision to move can be seen as an adaptive response (rather than a lack of resilience).
A large proportion of Mackay residents rated government and community groups highly in terms of their preparedness, suggesting strong levels of capacity amongst government and community groups. Charleville residents rated the preparedness of State Government, utility providers and their local hospital highly (78 %, 59 % and 49 %, respectively).
About half the Mackay residents had not experienced a flood event before and most importantly this group seemed to have quite a neutral attitude as to whether resources such as skills, cost and the need for cooperation with others, may limit their ability to prepare for future events. They may consider this responsibility as someone else’s and not theirs. Little evidence was found of factors which may weaken the adaptive capacity (apart from low levels of insurance) amongst Charleville residents.
A large proportion of Mackay businesses are putting in practice advice given on floods. The majority are not likely to move out of Mackay or Charleville or to another area of Mackay or Charleville, respectively, in the event of another flood. While the numbers of businesses considering relocation are low, the impact of around 20 % of the businesses in each town shifting location is considerable. As with households, relocation is an adaptive change. Moving businesses within Charleville is not feasible as there is only one business centre, but 18 % of businesses stated that they would consider leaving the town in the event of future flood impacts. In Mackay, none of the businesses considered leaving town, but 21 % saw relocation to a less flood prone business centre within Mackay as an adaptive strategy.
Charleville businesses appear to have strong networks with others in terms of cooperation. This group rated Charleville Hospital highly in terms of being very prepared for future flood events. Adaptive capacity could be improved by solving the Bradley’s Gully problem and/or other mitigation measures to improve risk from floods. Consequently, the insurance industry could be approached with evidence of these new measures so that new insurance products can be designed to enable residents and businesses to take up affordable insurance for flood. The Mackay Regional Council intends to implement mitigation strategies including various engineering solutions to direct floodwaters from the Gooseponds Creek away from the Glenella Industrial Estate.
Few Mackay businesses intend joining groups to discuss flood risk and many were unsure how prepared different government and community groups were for future floods. They believe that local residents could be better prepared for future flood events and expressed concern about the level of preparedness of other groups as well. They were unsure whether skills or cooperation with others is a barrier to them preparing for future floods. This may stem from a lack of knowledge on their part as to what skills and cooperation is needed and how much it might cost. They may also consider this the responsibility of someone else.
Charleville businesses saw cost as a barrier in terms of preparing for future flood events, as well as the fact that they have other things to think about apart from floods. They believed local residents could be better prepared for future flood events. As in the case of Mackay businesses, few intend joining groups to discuss flood risk, and many were unsure how prepared different government and community groups were for future floods.
is its low levels of insurance cover, as discussed above. A lot of businesses in Charleville commented that they are reluctant to move out of town as they will lose substantial business. They said it is very important that they remain close to town for the convenience of customers.
The study concluded that those established in areas that are vulnerable to regular flooding, who had greater connections within the community, displayed more resilience in the event of a disaster flood event. The Charleville community was found to be staunchly resilient, with high levels of sense of belongingness and commitment on the part of residents, businesses and institutions to remain in the community irrespective of future flood events. By comparison, Mackay had low community participation and formal volunteerism rates and a general belief that they have a limited personal responsibility to prepare for floods. Divergent views were found in Mackay on the question of belongingness, suggesting weaker levels of resilience in Mackay.
In Mackay, the length of time a business had been established was linked to flood impacts indicating a complacency to flood events at some point as evidenced by the expansion approved for the development of industrial estates and retail outlets in lower lying areas of Mackay. The Mackay community could be considered a less resilient community as compared to Charleville in terms of social capacity but Charleville was considered to be a less resilient community in terms of economic capacity.
Whilst this study found the elderly was a social group vulnerable to disaster flood events, it particularly highlighted the psychological impacts of the flood on the community. The research of the Mackay 2008 flood indicated that lack of prior exposure to disaster events was a critical factor contributing to mental health and reducing the resilience of communities in the post-disaster phase. Consequently, it is recommended that mental health be included as a component in the consequences phase in addition to the ‘macro-economic’ impacts that may in turn increase the vulnerability of a population.
The research conducted did not show any direct correlation between implementing mitigation measures and avoidance of flood impacts in Mackay. However, due to the purposive methodology used in the research design where those households and businesses that received flood damage were selected, this may subsequently indicate that those who were not impacted by the floods had implemented a greater number of mitigation measures which provided greater resilience to the flood event. Planning and development was found to play a critical role in the resilience of communities to disaster events such as flooding.
1
Introduction
1.1
Background
Climate change is currently considered a major and urgent issue of global significance. In Australia, its effects are already being experienced in the form of higher temperatures, more frequent extremes, including heatwaves, bushfires, droughts and floods (McAlpine et al., 2009). For example, the year 2009 in Australia will be remembered for its extreme heatwaves, bushfires, dust-storms, flooding and rainfall deficiencies. The Bureau of Meteorology data indicates that in 2009, Australia’s annual mean temperature was 0.90°C above the 1961-1990 average, making it Australia’s second warmest year since reliable records commenced in 1910 (BOM, 2009a).
A warmer climate, with its increased climate variability, will increase the risk of floods (Wetherald and Manabe, 2002; IPCC, 2007). According to the IPCC 2007 report, more severe coastal storm surges and flooding will be “virtually certain” during the twenty-first century. Coupled with the projected intense precipitation events that can inundate certain areas, flooding could cause more severe damage to people, property, and the environment. In Australia, extreme events (including flooding) tend to inflict large environmental and economic costs, which are exacerbated by the fact that they can be difficult to adequately manage through adaptive processes (Preston and Jones, 2006).
The characteristics and causes of floods vary, as do their impact on individuals, communities, societies and the environment. Consequently, the implementation of flood mitigation measures (either using structural and non-structural approaches) needs to accommodate varying flood-people-environment attributes. Moreover, as floods depend on many factors (e.g. precipitation intensity, volume, timing, etc.) and can occur in several forms (e.g. river floods, flash floods, urban floods, rural floods, etc.), adaptation strategies to flooding are specific to the affected entities, location and spatial scales (e.g. Kirshen et al., 2008; IPCC, 2007; Adger et al., 2005). As challenging as it seems, adaptation measures to flooding are needed to reduce the damage potential.
Individuals and communities exhibit differential abilities to cope with flood hazards. Various studies in Australia and overseas have identified a number of different factors which contribute to vulnerability (e.g. Nelson et al., 2007, 2009a,b; McEntire, 2005; Clark et al., 1998). Similarly, people and organisations have varying capacities and resources to adapt to flooding, characterised by their access to resources, extent of social capital, structure and functionality of institutional arrangements, ability to generate knowledge, and capacity for social learning (Smith et al., 2008). Some communities may not have the adaptive capacity to cope with intense and frequent flooding to the extent that their viability and ability to survive remains at stake.
1.2
Significance of the Study
Changing risks associated with climate change are placing further strain on community systems and their capacity to recover from emergencies and disasters brought about by climate change. Hence questions may arise as to the processes, practices and strategies needed to promote or maintain community resilience in this changing climatic environment. Consequently, understanding a community’s characteristics is important for understanding its relative vulnerability to human or natural hazards (Gazley et al., 2009). It is important not only to estimate damages incurred from the impact of natural hazards, but also to consider social factors. Technical risk assessments often neglect to examine how affected communities cope and recover after a natural hazard (Geoscience Australia, 2005).
There is also a need to examine the extent to which flood mitigation measures have been applied to reduce the vulnerability to flood events. It is essential to review which processes and instruments have been implemented, as well as to identify those plans and strategies that worked well or not in previous floods. The information is vital for decision makers in formulating and implementing policies for flood emergency management. Moreover, some communities in coastal and inland Australia are currently vulnerable to flooding. With the increased risk of more flooding in the future to these areas, it will be important to gain insights as to whether (and how) these communities can possibly cope and endure.
1.3
Objectives and Hypotheses
The objectives of this project were:
1. To understand how societies that are regularly flooded respond and adjust to flood events and the extent of their resilience;
2. To understand the characteristics of communities that are ‘on the edge’, where flooding might push them into non-viability;
3. To understand the extent to which flood mitigation measures (including State Planning Policy 1/03) have been applied to reduce the vulnerability to flood events; and
4. To identify the characteristics of vulnerability, resilience and adaptive capacity to flooding of households, businesses and institutions.
The following hypotheses were formulated for this study:
Hypothesis 1: That those households established in areas that are vulnerable to regular flooding, that have greater connections within the community, display more resilience in the event of a disaster flood event;
Hypothesis 2: That social groups with special needs such as the elderly are less resilient to a disaster flooding event than other members of a community;
Hypothesis 3: That those who had applied flood mitigation measures were more resilient to disaster flooding events; and
2
Literature Review
2.1
Introduction
Floods in Australia over the past three decades have accounted for 29 % of total natural disaster costs (BTE, 2001). Overall, flooding is Australia’s costliest form of natural disaster, with losses estimated at over $300 million a year (BTRE, 2002). In Queensland alone during 2008, flooding cost the state and local government approximately $234 million in damages to infrastructure, due to heavy rainfall events that spanned north-west Queensland to Mackay, when approximately one million square kilometres of the state (or 62 % of the area) was underwater (Queensland Government, 2009).
During significant floods, lives can be lost, stock losses may be in the tens of thousands, and damage to homes, businesses, roads, etc., can run into hundreds of millions of dollars. Lost production can add considerably to the costs, as can the intangible costs, such as effects on health.
2.2
Flood Management in Australia
In Australia, the Natural Disaster Mitigation Program (NDMP) is the national program that identifies and addresses natural disaster risk priorities. It deals with natural disasters, such as bushfires, floods and tropical cyclones that regularly occur (AGD, 2009). These events cause over $1 billion damage to homes, businesses and infrastructure, and cause serious disruptions to communities.
In 1999, the Regional Flood Mitigation Program was incorporated into the NDMP and allocated around $75 million to more than 270 projects nationwide. It funded various flood-related measures, such as the construction of levees, house raising, flood proofing buildings, bypass floodways, flood control dams, retarding basins, channel improvements, flood warning systems, and activities to raise community awareness (AGD, 2009).
At the state and local levels in Australia, initiatives which seek to reduce floods and their negative effects focus on activities which raise community awareness and levels of resilience. Measures to prevent floods can include zoning, land use management, framing of and compliance with relevant legislation and by-laws, education, provision of relevant information and alerts, and development of local flood prevention plans.
For the purposes of IPA, State and Regional Coastal Plans were treated as State Planning Policies and were taken into account by assessment managers (generally local Council) when development applications were assessed (HSCCCWEA, 2009). The Planning Minister can require such Plans be considered in local planning schemes and prior to assigning land for community infrastructure (HSCCCWEA 2009). In a recent report, they stated that in order to be more effective, these Plans needed to be given elevated status under the IPA to ensure their provisions are implemented (HSCCCWEA, 2009). This Standing Committee report postulates that, in practice, details of the State and Region plans “are not clearly and thoroughly implemented in local planning schemes” as an integral part of the process of checking state interest on draft local planning schemes (HSCCCWEA 2009). The SPA is largely a redraft of the IPA and functions in a broadly similar manner. The SPP 1/03 has a 10-year life, before substitution, and it is to be hoped that its replacement policy will strengthen its effectiveness, and give local government greater power and responsibility to mitigate the impact of floods.
Australian Governments currently use regional and urban planning, land use and development planning, building codes and a range of associated engineering standards for disaster risk treatment. In Queensland, the Government mitigates against the major impacts of natural disasters through instruments and planning regimes under the South-East Queensland Regional Plan and associated Climate Change Management Plan, the SPP 1/03, SPA, Disaster Management Act 2003, and various local government planning schemes and by-laws.
Floods cost the Australian community, on average, in excess of $300 million per annum (BTRE, 2002). In terms of resourcing the development of flood prevention measures, one of the ongoing challenges facing Government is competing Government priorities for funding from other portfolios (such as health, education, transport etc).
In Australia the State and Territory Governments generally coordinate disaster management, however the Commonwealth Government will respond to their requests for assistance. The Commonwealth Government provides support through the Commonwealth Government Disaster Response Plan and Emergency Management Australia, who provide operational and financial assistance through response, recovery and measures to reduce floods (Williams et al., 2009). State and Territory governments have responsibility, through legislation, to establish their own emergency management and disaster management entities which are linked to Fire, Police and State Emergency Services (SES). These governments provide warning systems, planning and education, direction and support to local government bodies working within the disaster area (Williams et al., 2009).
State Housing Authorities play a key role in disaster management and link to government and the wider community, providing emergency shelter, accommodation, financial and other support to communities. However, rarely has their practical experience been examined and featured in the published literature (Williams et al., 2009). This practical experience is likely to be a very good source of data on challenges that need to be considered in planning procedures and protocols (Williams et al., 2009).
The SPP 1/03 deals with mitigating the adverse impacts of the natural hazards of flood, bushfire and landslide and, under SPA, takes effect when planning schedules are developed or amended, land is designated for community infrastructure, or development applications are assessed (DOLGP/DES, 2003). The SPP 1/03 only relates to development issues associated with minimising the potential adverse impacts of natural hazards (e.g. development proposals for works such as firebreaks, filling or retaining structures), which could, under normal circumstances, place unacceptable impacts on amenity and heritage values and the natural environment (DOLGP/DES, 2003).
The natural hazard management area for flood hazard is dependent upon a local government adopting a flood event for the management or development in a particular locality and in identifying the affected area in the planning scheme. Until this occurs, the SPP 1/03 does not take effect for development assessment in relation to flood hazard in that particular locality (DOLGP/DES, 2003).
Following a disaster event, the Queensland Department of Communities works with those communities affected to restore social, economic, emotional and physical well-being, providing and coordinating information, resources, personal support, specialist counselling, community development and mental health services (DOC, 2009a).
For those whose property is uninsured and who have suffered damage as a result of flooding or storms, once-off emergency and other financial assistance is available to eligible applicants (DOC, 2009a). In Queensland, those affected by natural disasters such as floods may be eligible for grants, including the Emergent Assistance Grant available to individuals and families unable to meet immediate or unexpected basic costs such as for medical supplies, accommodation, food and clothing. The grant is not means tested and is a once-off payment of $170 per person, up to a maximum of $780 for a family of five or more (DOC, 2009b).
Essential Household Contents Grants may be available for essential household contents lost or damaged in the disaster for those who do not have contents insurance. This grant is means tested and is a once-off payment of $1,660 per adult, up to a maximum of $4,980 for a couple/family (DOC, 2009b). Eligible household contents may include essential contents such as furniture, white goods, clothing, cooking utensils, bedding and linen, floor coverings, food lost due to damage, and can be used to assist with the repair or replacement of essential items, with maximum limits applying for individual items (DOC 2009b).
The Structural Assistance Grant may be available to property owners whose home is damaged in a disaster and is uninsured for this event. It must be their sole place of residence at the time of the event, and the grant contributes to repair of the property to a secure and habitable condition (DOC, 2009b). It is means-tested and is a once-off payment of up to $10,250 per individual, and up to $13,800 for a couple/family (DOC, 2009b).
2.3
Social Impacts and Social Capital
It has been suggested that it is important not only to estimate damages incurred from the impact of natural hazards, but also to consider social factors. Technical risk assessments often neglect to examine how affected communities cope and recover after a natural hazard (Geoscience Australia, 2005). Community recovery issues need to be considered in addition to geological, economic and engineering assessment of natural hazards.
Factors influencing community recovery are widely recognised as being complex, and may include economic, physical, community, environmental, financial, psychological and emotional factors (COAG, 2004; EMA, 2004; Ministry of Civil Defence and Emergency Management, 2004), as well as business interruption, local economic activity and issues related to infrastructures (Geoscience Australia, 2005).
An important aspect of community resilience is social capital, which is generally defined as relating to social networks and cohesion, trust and support or how a community functions (Geoscience Australia, 2005); and social capital theory, which considers the way individuals organise to pursue common goals (Kaufman, 1999). Numerous international agencies, such as the World Bank, the United Nations and the Australian Bureau of Statistics have been endeavouring to develop measures of social capital, and acknowledge it can be difficult to measure (ABS, 2004; Geoscience Australia, 2005; World Bank, 2004).
To date, common data collected by agencies to measure social capital has included data on community groups and volunteerism, membership of organisations, contact with friends and family, feelings of trust and safety in the community (ABS, 2004; Geoscience Australia, 2005; World Bank, 2004). These interactions and relationships may appear to have little economic value, however this could be a substantially flawed assumption. A case in point is volunteerism. In 1997, volunteering activities in Australia were valued at $24-$31 billion (ABS, 2000). The economic value to societies of social capital in preparation, response, recovery and adaptation to flood events is likely to be very significant if quantified. Hence the value of social capital, coupled with government funding allocated to these activities, collectively contribute to the overall economic cost of building community resilience and adaptive capacity.
2.4
Natural Disaster Preparedness, Resilience, Vulnerability and
Adaptation
2.4.1 Natural Disaster Preparedness
In terms of disaster preparedness, Gazley et al. (2009) contended that three situational factors support the ability of an emergency manager to determine if their jurisdiction is appropriately prepared for disasters and have the capacity to cope:
Risk profile, which relates to the geophysical location of the community, the type of risk being faced, the likely severity of its impact on vulnerable populations, and the public managers’ perception as to the level of threat;
Incident experience, what has been the community’s past experience with human and natural disasters; and
These general concepts focus on experience and information.
A UK study which reviewed resilience indicators of climate change found no pre-existing, specific measures available in the published literature and concluded that neither a single indicator nor a set of 3-4 individual indicators were suitable for measuring the resilience of a region (Sivell et al., 2008). The view of these researchers was that indicators suitable for monitoring climate change adaptation need to be based on measuring sustainability in terms of three aspects related to a community, viz., social, economic and natural (or environmental) factors and their characteristics. A range of aspects can be expanded for discrete sectors, such as environment, health, housing, infrastructure and transport.
A bibliometric analysis was conducted by Janssen et al. (2006) involving 2,286 publications between 1967 and 2005 of the knowledge domains resilience, vulnerability and adaptation within research on the human dimensions of global environmental change. They found few interlinkages exist among these knowledge domains. The analysis found that resilience has a background in ecology and mathematics focused on theoretical models, while vulnerability and adaptation knowledge domains centre on natural hazards and geography research, with a focus on climate change research and case studies. They found indications of an increasing integration of the different domains of knowledge by an increasing number of cross citations and published literature classified in multiple knowledge domains.
2.4.2 Vulnerability
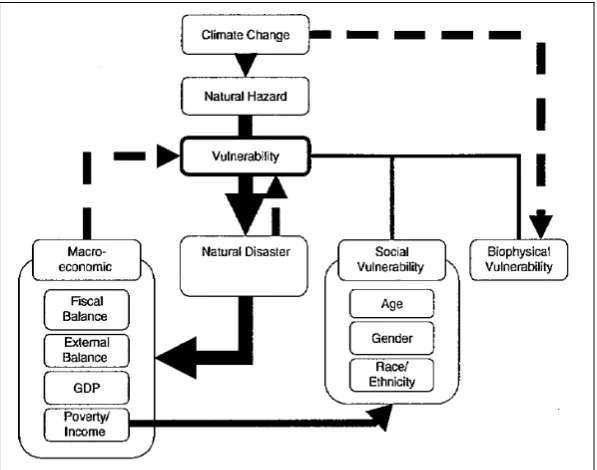
Vulnerability is a function of exposure to climate factors, sensitivity to change and capacity to adapt to that change (The Allen Consulting Group, 2005). Systems that are highly exposed, sensitive and less able to adapt are vulnerable (Figure 2.1).
Figure 2.1. Vulnerability and its components (Source: The Allen Consulting Group, 2005)
Understanding a community’s characteristics is important for understanding its relative vulnerability to human or natural hazards (Gazley et al., 2009). From an emergency management point of view, vulnerability can be seen as a lack of capacity to perform vital public management functions, including resource allocation, training and planning (McEntire, 2005).
an impact”). They pointed to the differential ability of people to cope with hazards, and summarised sources of vulnerability themes as relating to age, disabilities, family structure and social networks, housing and the built environment, income and material resources, lifelines (these include hospitals, transportation, communication, emergency response, utilities, etc.), occupation, race and ethnicity.
[image:18.595.149.448.260.495.2]The inclusion of vulnerable sections of the community and vulnerable social-ecological systems within decision-making entities is very important and an area which has received little attention in the research literature (Nelson et al., 2007). Hence, the principles of equity need to be integrated with what is identified as vulnerability and important parts of decision-making as they relate to adaptation. Figure 2.2 shows age as an indicator of social vulnerability that influences the overall vulnerability of a community and their susceptibility to a natural disaster, where recovery is beyond the day-to-day capacity of the prescribed statutory authorities.
Figure 2.2. Characteristics of vulnerability in the context of natural disasters (Source: Ibbararan and Ruth, 2009).
Community vulnerability in terms of risk and vulnerability to hazard impact was discussed in detail in AGSO (2000) and focused on five elements:
Setting (physical environment, access, administrative arrangements, population and its distribution);
Shelter (buildings for home, work and recreation, mobility and access to shelter);
Sustenance (lifelines – reliance on service and utility infrastructures – water, sewerage, telecommunications and power supply; food, medical, clothing and other personal items);
Society (e.g. language, religion, welfare and community groups, education, meeting places, cultural activities, facilities such as churches, meeting halls, clubs, libraries etc and levels of education).
Nelson et al. (2009a,b), in their studies analysing the vulnerability of Australian rural communities to climate variability and change, presented a complex array of interacting economic, social and environmental factors that contribute to vulnerability. They highlighted that there is little agreement on how to convert the concept of vulnerability into analytical measures (and it is rarely done) which can be used to prioritise and evaluate policy options. They state that increasing awareness of the potential impacts of climate change on rural landscapes is motivating research which can prioritise adaptation responses. They caution that relying solely on hazard/impact modelling can lead to inappropriate conclusions about rural community vulnerability.
2.4.3 Resilience
Measurement and management of resilience has been studied extensively during the last decade in a number of countries. Although demographic and economic aspects have received considerable attention, its pre-requisites and social dimensions are less well understood. Moreover, the qualities of community resilience have been difficult to accurately measure or quantify (McIntosh et al., 2008). Resilience can raise questions around the defining governance structures that are appropriate and their relationship to contextual factors, as well as procedural and outcome equity (Nelson et al., 2007).
Resistance is a type of adaptation action which places a barrier or blocks climate change effects. An example of resistance is protecting an area using a flood barrier (Sivell et al., 2008). Resistance is defined as the ability of a system to prevent floods, while resilience “is defined as the ability of the system to recover from floods” (De Bruijn, 2005). A more detailed definition of resilience is provided by the United Nations (2007) as:
“The capacity of a system, community or society potentially exposed to hazards to adapt, by resisting or changing in order to reach and maintain an acceptable level of functioning and structure. This is determined by the degree to which the social system is capable of organising itself to increase this capacity for learning from past disasters for better future protection and to improve risk reduction measures.”
One approach to measure resilience involves measuring its parts, namely stability, learning and self-organisation (Carpenter et al., 2001; Thomas et al., 2005). Another approach is based on the premise that a system’s natural state is one of change, as opposed to one of equilibrium (Holling, 1973). Resiliency generally refers to processes and factors that limit negative behaviours associated with stress and which, despite the presence of adversity, enable adaptive outcomes to be achieved (Gwimbi, 2009).
Resilience may not necessarily involve physical measures, and can be attained through changes in awareness, procedure and management and may not involve spending significant funding (Sivell et al., 2008). For example, changing the way in which existing funds are distributed can be a means for building effective resilience.
collective resilience may be influenced by ecology, economic structure, geography, inequality, institutional networks and structures, landscape, resources and governance (in particular, how various actors coordinate) (Sivell et al., 2008).
Examples of social sources of resilience can include:
Social networks (Eriksen et al., 2005);
Social security payments, lessons learned from past events (Finan and Nelson, 2001; Nelson and Finan, 2008);
Heightened awareness of thresholds which pose as critical and learning through building of consensus (Brown et al., 2002); and
Learning and strong national and international support networks (Tompkins, 2005).
Key themes impacting on resilience can include individual incomes (particularly disposable income, such as whether people can afford to keep vulnerable family members cool in severe heat events); access to important services (which may be limited for those in rural areas) or could relate to events such as blockage of transport routes (Sivell et al., 2008). A key question posed by Sivell et al (2008) relates to whether societies have a plan showing where vulnerable people live.
Regional social resilience is related to the interrelationship between the adequacy of government and social networks and the resilience of individual members of society (Sivell et al., 2008). Resilient societies have individuals and networks which are both resilient.
Economic resilience is concerned with a range of issues such as relating to local infrastructure, availability of contingency funds, business resilience, flood defences, and transport utilities. It may also include other issues, such as the number of businesses that have strategies for climate adaptation, the number insured against extreme weather events, and the nature of the businesses and their practices (Sivell et al., 2008). Mostly importantly, Trosper (2002) expounded the view that resilient communities must be able to demonstrate the ability to buffer the event, self-organise before, during and after, and adapt and learn from the event.
2.4.4 Adaptation
Adaptation involves change and the practice of individuals, communities and societies as they adjust their locations, life courses and activities to maximise new opportunities (Nelson et al., 2007). Plummer and Armitage (2007) suggested analysing three components of adaptation processes – livelihood outcomes, ecosystem conditions and institutional and process conditions. Carlsson and Berkes (2005) considered that evaluating adaptation management should be focused on functions and process, as opposed to structure and results.
Examples of adaptive actions which may be taken in response to resource stresses in social-ecological systems can include:
Changing occupation, drought relief and selling assets (Eriksen et al., 2005);
Livelihood diversification, risk management in agriculture, humanitarian relief, crop insurance, irrigation schemes (Finan and Nelson, 2001; Nelson and Finan, 2008);
Developing community-based resources, community monitoring of natural resources, such as reefs, consensus building for future zoning (Brown et al., 2002); and
Regulatory changes such as enhancements to building codes and zoning, developing plans and committees (Tompkins, 2005).
In the US, researchers have found that communities rely not just on federal, state and local authorities and voluntary organisations for assistance in disasters, but on a broad range of other entities in the community, including spontaneous volunteers, local business, social service and philanthropic non-profit (e.g. Wal-Mart) and faith-based organisations (Brudney and Gazley, 2009; Gazley et al., 2009; McGuire et al., 2009). There is a growing realisation that, with the exception of smaller emergencies, no one organisation is capable of doing it all (Gazley et al., 2009).
Adaptive management is concerned with emergency management’s capacity in terms of its emphasis on managerial flexibility, organisational learning and level of responsiveness as a source of an institution’s level of resilience (Wise, 2006). Examples of building adaptive capacity include creating standards and legislation, institutional change, undertaking research and management, developing policies, strategies and plans and partnerships (Sivell et al., 2008).
2.5
Flood Mitigation Measures
Flood mitigation can be defined as measures aimed at eliminating or decreasing flood impacts on the environment and society, using structural and nonstructural approaches (BTRE, 2002). Mitigation measures can be classified into three main groups:
Flood modification (e.g. structural measures which modify floodwater flow such as levees, diversions and channel improvements, dams, detention basins, flood gates);
Property modification (using siting and materials, building design or land use planning approaches, e.g., zoning and land use planning - a non-structural approach, voluntary purchase or acquisition, building regulations, house raising, other flood-proofing); and
Response modification (modifying community behaviour through activities such as education, warning systems, planning and awareness campaigns, which recognise that losses may be substantially affected by people’s reactions to warnings and impending floods, e.g. preparedness (planning for emergency), warning systems and forecasts, information and education programmes, state and national emergency services response) (BTRE 2002).
Strategies for managing hazard risk can include involving the whole community in various ways (AGSO, 2000):
Developing a strong commitment to risk management and raising their awareness through risk communication;
Providing appropriate information for decision-making;
Operating effective monitoring and warning systems;
Updating and reviewing planning and building codes and standards;
Enhancing emergency management training, plans and resources;
Implementing plans to protect key facilities (e.g. hospitals) which if impacted could increase community risk and hardship; and
Building cost-effective structures for defence.
With Queenslanders building, on average, 35,000 dwellings per annum, it is vital that local councils ensure they are built to withstand future flood events, or built in areas where potential flood damage is likely to be minimised (Queensland Government, 2009).
Although disease outbreaks following flood events are not common in Australia, there is an increased risk of infection if direct contact is made with polluted waters, resulting in conditions such as conjunctivitis, dermatitis, ear, nose and throat infections, wound infections, and risks can increase for diseases such as dengue fever, diarrhoeal diseases, leptospirosis and melioidosis (QH, 2008). Hence, it is strongly recommended that contact with flood waters, stormwater creeks and drains during flood events, and contact with mud and dirt during clean-up be avoided. It is also recommended that protection measures such as gloves and covered shoes be used (QH, 2008). Most deaths occurring in Australia are as a result of people walking, swimming or attempting to drive through flood waters (QH, 2008).
2.6
Insights from International and Local Flood Studies
“Flood risk management systems are defined as the socio-economic and physical characteristics of the river and the adjacent flood-prone area” (De Bruijn, 2004). Brilly and Polic (2005) argued that the hydrometeorology of floods can be extremely complex and uncertain; yet it is noted that despite this complexity their technical aspects are better recognised than present knowledge about people’s behaviour (Montz and Gruntfest, 2002).
International flood studies have highlighted some interesting insights with respect to public and decision-maker levels of understanding about flood information and their behaviour. For example, in the October 1988 flood in Nimes, France, which damaged the homes of 45,000 residents, a community survey (n=187 householders living in ground-level buildings) revealed that only 17 % of interviewees were aware that they lived in an area that is subject to flood (Duclos et al., 1991).
amongst decision makers, there was poor insight about the economic issues of measures to prevent floods, and there was difficulty visualising the likely costs and results of actions associated with approaches that can be used to reduce floods. The study suggested that ongoing training of personnel involved in decisions about floods was very important.
A study by Pfister (2002) of the March 2001 flood in Grafton, NSW, using telephone and face-to-face interviews conducted just after the peak of the flood, found that successful evacuation depends on the readiness of the public to respond to a warning issued to evacuate. The study concluded that the Grafton residents were not ready to evacuate, did not have a realistic appreciation of the threat of flood, generally did not accept that there was a need to evacuate, and did not understand the evacuation strategy (Pfister, 2002). The author suggested that studies are needed to check the veracity of current best practice.
Levee protection can create a sense of invulnerability in a community which is not unjustified (Keys and Campbell, 1991; O’Brien and Payne, 1997). Communities also often believe that a flood will not exceed the record of the previous flood, as Heatherwick (1990) found was the case in the April 1990 Charleville flood.
Bell and Tobin (2007) emphasised the importance of investigating the relationship between understanding and persuasion in flood plain management and flood risk communication in order for it to be more effective. For example, community response to flood warnings was reported as being problematic in the March 2001 Grafton floods in NSW when fewer than ten percent of the population left the city during the nine hour evacuation (Pfister, 2002). Pfister (2002) suggested that although operational debriefs are important for exploring potential areas for improvement and enable emergency managers to include lessons learned into future operational planning, they generally do not capture the public perspective. This highlights the importance of consulting the public on their experiences, lessons learned, insights post major flood events and possible needs in terms of planning for future events.
One aspect related to recovery occurred in a case where up to 70 % of small businesses impacted by the 2005 flood in the City of Carlisle, England were unable to recover despite having sufficient levels of flood insurance (Sivell et al., 2008). This was because their customers had found alternate sources of supply by the time they recovered from the physical impacts of the flood.
Bell and Tobin (2007) identified that problems exist between the concepts of persuasion and understanding, when they investigated levels of understanding relating to four terms used in US policy’s benchmark flood. Their study investigated residents living both within and outside an official flood plain area. They studied four descriptive methods used: “a 100-year flood”, “a flood with a 1 percent chance of occurring in any year”, “a flood with a 26 percent chance of occurring in 30 years”, and “a flood risk map”. They found disjuncture between the concepts of understanding and persuasion, and problems with the descriptive method that used certain terms. For instance, the description of a flood that has a 26 percent chance of occurring in 30 years “induced confusion, vehemence, and dismissal” among the sample of residents.
The reasons for warning failures have been investigated by Handmer (2000) who classified these according to whether shared meaning was achieved between the issuing authority and the public. Reasons could relate to impediments such as language barriers, the public not receiving the warning, lack of mobility options, an individual’s attitude to risk, a lack of faith in the warnings, and the impact of false alarms on future evacuations (Pfister, 2002).
It is important to note that the heterogeneity of populations at risk adds to the complexity of designing relevant and meaningful messages (Pfister, 2002). A potential barrier to adaption was raised by Preston et al. (2009) in their study of lessons learned from a bushfire vulnerability assessment. They found that when presenting vulnerability maps in a workshop setting, stakeholders appeared reluctant to accept representations of vulnerability which differed from their own understanding. This provides evidence of potential mismatches in understanding between technical professionals and the public in the use of terms, such as ‘hazard’ and ‘vulnerability assessment’.
A study in 2001, which involved consultations with key representatives in flood mitigation in Australian States and Territory, found common problems associated with flood mitigation (BTRE, 2002):
Differences in community needs and low levels of community awareness;
Lack of funding and lack and uncertainty of information;
Urban infill and higher density redevelopment;
Uncertainty in terms of legal liability and court outcomes;
Political pressures and limited coordination;
Design levels and land use planning decisions were generally based on the level of the 1 in 100-year flood and revisions, as information improved, of the 1 percent Annual Exceedance Probability (AEP); and
As few major floods had occurred in the last 10-50 years community knowledge and awareness of floods was poor.
The study found that an increasing focus was being placed on non-structural measures. Community support and understanding was seen as fundamental for assessing measures to prevent floods, and generally the economic effectiveness of these measures were not formally assessed after they were introduced (BTRE, 2002).
The importance of providing information on the cost of measures which can be used to prevent floods is highlighted in research by Grothmann and Reusswig (2006). They suggest that monetary flood damage can be reduced by around 80 % in urban areas prone to flood by residents exhibiting self-protective behaviour, reducing the need for public risk management. To motivate such behaviour, residents need to understand not only the risk of flooding and its likely consequences, but also the likely effectiveness and cost associated with private precautionary measures.
Kulig (2000) expressed the view that disaster risk reduction needs to focus on building communities that are resilient, as opposed to merely responding to natural disasters. The author noted that the causes of vulnerability need to be addressed, which can be considered an investment toward building resilient communities able to face future disasters. Another important public health issue for determining victim support is the lasting psychological consequences associated with disasters (Verger et al., 2003).
3
Case Study Area
3.1
Charleville and its Flood History
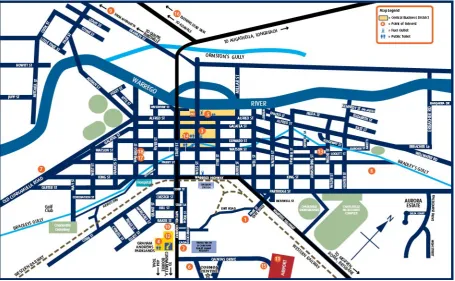
Charleville is situated 756 km west of Brisbane in the heart of Queensland’s mulga country on the left bank of the Warrego River (Wagner, 1991). Its climate varies from -3 to 21ºC in winter and in summer from 27 to 46 ºC, with average rainfall of 450 mm (Lord, 1982). Charleville covers an area of 13,924 km2 (ABS, 2006a); and was laid out in the form of a grid by a
Government surveyor (Wagner, 1991). Most of it lies on the flood plain which is constricted to a width of around 3.5 and 5 km upstream (Figure 3.1). The Bradley’s Creek catchment covers 200 km2 and flows through Charleville running almost parallel to the Warrego River before it
[image:26.595.74.530.254.535.2]discharges into this river downstream of the town (Sargent, 1991).
Figure 3.1. Charleville town Map (Source: Murweh Shire Council)
Charleville’s population grew from 58 persons in 1871, peaking at 5,154 in 1961 (CGQ 2009) and since that date has steadily declined to 3,278 people recorded in the 2006 census (ABS, 2006a,b). The decline in population is reportedly linked to the downturn in the pastoral industry, fluctuating sheep-wool and cattle prices, a number of poor seasons and the effect of rising costs (Lord, 1982). Of the 3,278 people recorded in the 2006 census in the urban centre/locality, 12.9 % are indigenous (more than five times the national average). Languages spoken at home include English (90 %), Vietnamese, Maori, Hindi, Tagalog and Cebuano (ABS, 2006b). The unemployment rate is 3.1 %, lower than the national average (ABS, 2006b). Charleville lies in the broader region of the South-West Statistical Division and is the main town servicing a large area for the Central West and Warrego regions.
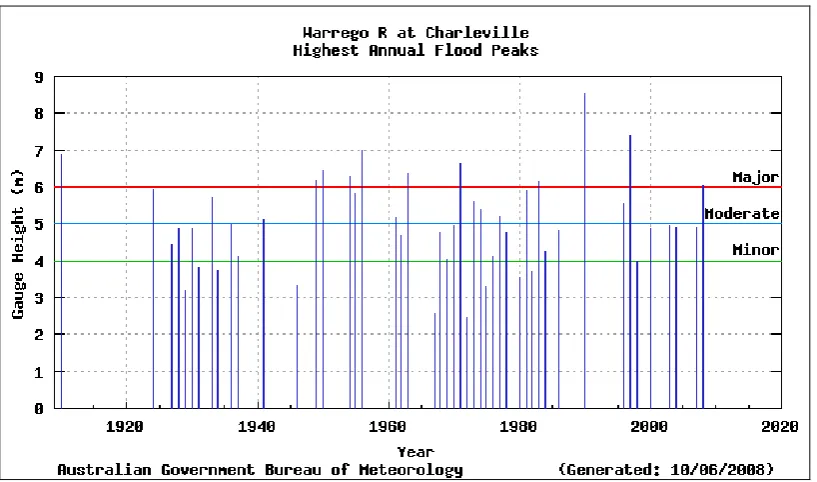
The significant flood peaks which have occurred at Charleville since records began are illustrated in Figure 3.3.
Figure 3.3. Significant flood peaks which have occurred at Warrego River in Charleville (Source: Bureau of Meteorology)
3.1.1 The 1990 Flood in Charleville
A wide area of Western Queensland experienced a record or near record flooding in April 1990. Charleville was the town most affected, where all buildings in the business centre and 1,180 of the 1,470 houses were inundated, with most of the town flooded to depths of 1.2 - 2 m up to 3 m adjacent to Bradley’s Gully (Sargent, 1991). The floods caused widespread damage over a broad area of inland Queensland and produced record flood heights. The townships of Alpha and Charleville were devastated and the smaller towns of Augathella, Blackall and Jericho underwent serious flooding (BOM, 1990).
At 4.30pm on 20 April the BOM issued a warning to the Murweh Shire Council that record flooding could be expected of one or two m above the previous recording of 6.96 m. At 2.30pm on 21st April, the Warrego River peaked at Charleville at 8.54 m, 1.5 m higher than the previous
record height in 1956 of 6.96 m, with peak discharges estimated at around 3000 m3/s
(Sargent, 1991). The SES coordinated the complete evacuation of the town to temporary accommodation situated at the airport (BOM, 1990).
3.1.2 The 1997 Flood in Charleville
Western Queensland experienced flooding in January and February 1997 after very heavy rainfall fell in several catchments including the Warrego River. Several towns were affected. In Charleville, evacuation of about 780 people was necessary, and around 60 properties were affected by flood waters which reached above floor level. Repairs of flood damaged buildings were estimated to be around $150,000 (BOM, 1997). Rail and road traffic underwent severe disruption with large groups of travellers stranded at various areas in the flood affected region (BOM, 1997).
Flooding in the Warrego River was so significant, because at its peak at Charleville, it was the highest recorded since the record flood of April 1990 and was the second highest on the flood record which commenced about 1900 (BOM, 1997). In terms of comparing the rainfall totals recorded in the 1997 event with those during the April 1990 event, it is noted that the April 1990 floods occurred from prolonged rainfall over a 20 day period, whereas the February 1997 event resulted from a 6 day rainfall period (BOM, 1997). When comparing the most intense 24-hour period at Augathella and Charleville, this shows that the April 1990 rainfalls were much higher those recorded for 1997 (BOM, 1997). Flood river peaks for the Warrego River at Charleville were 8.54 m in the April 1990 flood, and 7.39 m in the 1997 flood.
3.1.3 The 2008 Flood in Charleville
The 2008 flood in Charleville was a Bradley’s Creek flood, not a Warrego River flood. On 17-20 January 2008, Charleville experienced its biggest Bradley’s Gully flood event since 1963. The Bradley Gully flows through the middle of the town, and flood waters reached approximately 3.1 m.
In contrast with the Warrego River, there is lack of quantitative information with regards to rainfall and flood water height at Bradley’s Creek during the 2008 flood. It was reported that the automatic river height gauge monitoring station on Bradley’s Creek was not working at the time of the January flood.
The impacts of the 2008 Charleville flood were described in Section 3.3 below.
3.2
Mackay and its Flood History
The City of Mackay, situated in Northern Queensland, lies approximately 970 km north of Brisbane. The Mackay Statistical Division, covering a total area of 90,340 km2, had a population
of 150,175 persons (ABS, 2006c). About 3.6 % of this was indigenous. The main employment industry was coal mining, which employed 9.4 % of the workforce (ABS, 2006c). The average annual population growth rate in the Division during 2003-2008 was 3 % (compared to 2.4 % in the state of Queensland) (OESR, 2009c). As at 30 June 2007, the resident population in the Mackay Statistical Division was estimated to be 163,629. Languages spoken at home include English (89 %), Italian, German, Afrikaans, Maltese and Tagalog (ABS, 2006c). The unemployment rate is 3.5 %, lower than the national average (ABS, 2006c).
3.2.1 Major Flood Events in Mackay
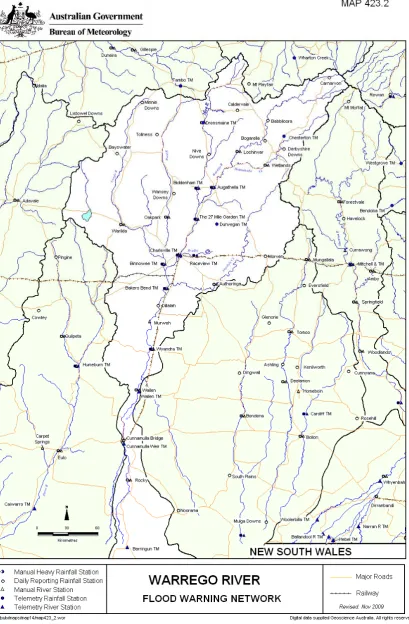
[image:30.595.117.480.141.398.2]Flooding from the Pioneer River poses the greatest geohazard threat (AGSO, 2000). The Pioneer River runs out to sea through the city of Mackay and has a catchment area (Figure 3.4) of about 1,500 km2 (BOM, 2009b).
Figure 3.4. Pioneer River Catchment (Source: Bureau of Meteorology)
The history of flooding from the Pioneer River is illustrated in Figure 3.5 and dates back to 1884 (BOM, 2009b). The highest occurring flood recorded was in February 1958 which peaked at a height of 9.14 m on the Mackay flood warning gauge at the Forgan Bridge. The February 2008 flood was not a riverine flood but a flash flood, caused by intense local rainfall, with the river peaking at only 7 m (BOM, 2009b).
[image:30.595.120.477.509.715.2]3.2.2 The 2008 Flood in Mackay
February 2008 proved to be another significant month of severe flooding and weather in Queensland, with river and flash floods occurring in many areas. Most significantly between 10-18 February along the central coast of Queensland, many rivers and towns between Townsville and Bundaberg were affected by floods (BOM, 2008). The worst damage occurred in the Mackay region on 15 February where an extremely intense and rare rainfall event occurred resulting in the flooding of up to 4,000 houses (BOM, 2008).
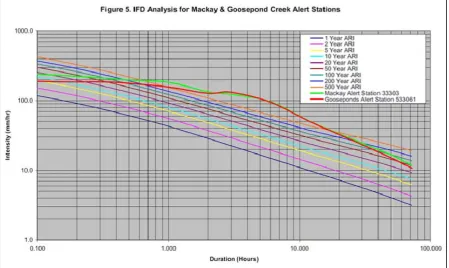
During the 2008 floods, the most statistically significant rainfall occurred in the lower Pioneer River around Mackay on the morning of 15 February when more than 600 mm was recorded in
approximately six hours (Figure 3.7). Intensity-frequency-duration analysis of the rainfalls at Gooseponds and Mackay revealed that “rainfall intensities for all durations from 30 minutes to 72 hours significantly exceeded 1 % AEP (100 year Average Recurrence Interval) intensities” (BOM, 2008).
Unofficial records of the total rainfall recorded over 24 hours for the Goosepond Creek catchment included 985 mm recorded at Glenella (GHD, 2009). A flood study on the Goosepond and Vines Creek was completed by GHD and the report was released by the Mackay Regional Council in October 2009 (Figures 3.6, 3.7 and 3.8). The report found that 886 residential properties were inundated during the February 2008 Mackay flood event. The 2008 month of February resulted in the largest recorded rainfall for the city of Mackay in the history of the BOM records.
[image:31.595.121.475.506.725.2]The whole city was generally affected by the rainfall and in particular low lying areas such as South Mackay. However it appeared that a wave of runoff travelling from the north-west in Glenella via the Gooseponds using roads as channels in an effort to get out to sea through the city, resulted in the largest readings inside residences in the low lying areas of the suburbs of Glenella and North Mackay (also heavily determined by gradient) and caused the most significant disaster impacts. A build up of water behind the railway line located north-west of the suburb of Glenella broke and had the same effect as a levy bursting resulting in the wave-like phenomenon. It was particularly notable that the areas located adjacent to new developments that had infilled former swamp areas that appeared to receive the greatest amounts of water in their homes: Glenella and North Mackay suburbs in particular.
Figure 3.7. GHD calculations of 1-in-500 year ARI flood event of 15 February 2008 flood disaster event (Source: GHD, 2009)
[image:32.595.74.525.384.699.2]3.3
Impact of the 2008 Charleville Flood
The 1990 and 1997 floods in Charleville were the impetus for the construction of Charleville’s flood mitigation levee which was almost completed prior to the 2008 flood. The levee has largely prevented flooding of the township from the Warrego River. However, flooding did occur in lower-lying properties from Bradley’s Gully which flows through the township of Charleville.
Approximately 40 residents and businesses in the low-lying areas of Charleville were evacuated and Queensland Health flew some hospital patients out of the town (ABC, 2008). For safety reasons, power was cut to some areas (EMA, 2009).
In relation to the 2008 Charleville flood, 920 families were assisted through the Natural Disaster Relief and Recovery Arrangements (NDRRA) grants totalling over $446,000 in Emergency Assistance and Essential Household Contents Grant payments (pers. comm. Jill Peters, Community Recovery Unit, Queensland Department of Communities, Brisbane, 23/12/2009). Concessional loans paid out to primary producers under NDRRA grant in Charleville related to 5 applicants, and the total assistance provided was $658,000. Small business grants valued at $298,000 were also provided, while 96 primary producer grants valued at $1.341 million were paid out (QRAA, 2010).
The total estimated cost of the January 2008 flooding in Charleville for the Department of Infrastructure and Planning for restoration of essential public assets for Local Government was $2,526,835; Emergency Management Queensland counter disaster operations costs fo