International Journal of Innovative Technology and Exploring Engineering (IJITEE) ISSN: 2278-3075, Volume-8 Issue-6, April 2019
Abstract: The Economic Load Dispatch (ELD) and Economic Emission Dispatch (EED) have been applied for obtaining the ideal energy cost and ideal production of the producing units, individually. The destructive environmental impacts created by the discharge of particulate and vaporous contaminants like sulfur dioxide (SO2) and oxides of nitrogen (NOx) these can be minimal by the satisfactory measure of the heap between plants of a power framework. In any case, this prompts a prominent increment in the operational expense of the plants. This paper proposes a lambda based methodology for elucidation the Combined Economic and Emission Dispatch (CEED) issue utilizing Particle Swarm Optimization (PSO) and results is contrasted and the lambda-emphasis, Genetic Algorithm (GA) methods thinking about nonlinear attributes of the generator, for instance, Ramp Rate limits and the Prohibited Operating Zones. The reason for this Combined Economic and Emission Dispatch (CEED) is to minimalize both the operating fuel cost as well as the emission level at the same time while fulfilling the load demand and the operational limitations. This multi-objective CEED problem is changed over into a single objective function using a modified price penalty factor approach. The dissimilarity constrictions due to the ramp rate limits are included by the combining with generation limits constraints and hence converted in to a single inequality constraint. For a precluded operating zone, the unit is made only to operate above or below the zone. An algorithm is developed in this undertaking to change the generation output of a unit so as to deny the unit task in the disallowed zones. In this work, incremental cost is taken as the encoded limitation PSO, which makes the issue autonomous of the quantity of generating components and the number of repetitions for conjunction reduces dramatically. The possibility of the planned lambda based method is proven for two dissimilar systems, and the result obtained from PSO method are compared with conventional and GA as far as the arrangement quality and computation efficiency.
Index Terms: Economic Load Dispatch (ELD), Economic Emission Dispatch (EED), Combined Economic Emission Dispatch (CEED), Molecule or Particle Swarm Optimization (PSO), Genetic Algorithm (GA).
Revised Manuscript Received on April 07, 2019.
Vemparala Hemanth Kumar, UG Student, Electrical and Electronics
Engineering, Koneru Lakshmaiah Education Foundation
,
Vaddeswaram, AP,India.
Pinni Srinivasa Varma, Associate Professor, Electrical and Electronics Engineering, Koneru Lakshmaiah Education Foundation, Vaddeswaram, AP, India.
Thotakura Bharath Kumar, Post-Doctoral Fellow, Industrial and Management Engineering, Indian Institute of Technology Kanpur, UP, India.
Edara Sreelatha, Assistant Professor, Electrical and Electronics Engineering, Koneru Lakshmaiah Education Foundation, Vaddeswaram, AP, India
.
I. INTRODUCTION
The effective and optimal economic procedures of the electric power generation frameworks have been involved always in electric power industry. This incorporates appropriation of absolute burden among the current creating units so that the all-out task cost is kept in any event. As of late this dubious region has taken into an appropriate twist as the open has turned out to be logically worried about ecological substances, with the goal that monetary dispatch currently contains the dispatch of frameworks to limit contaminants, just as to achieve least expense. Notwithstanding this there is a need to grow the restricted financial improvement issue to consolidate the limitations on the framework task to guarantee the security of the framework, along these lines dodging the breakdown of the framework because of the unexpected conditions.
II. ECONOMIC DISPATCH
The perseverance of the customary Economic Dispatch (ED) issue is to discover the best moderate timetable of the creating units while fulfilling burden request and operational imperatives. This contains portion of dynamic control between the units, as the working expense is impervious to the responsive stacking of a generator, the way by which the receptive heap of the station is shared among different on line generator does not disturb the economy. A power system is a blend of various generation, among which thermal, atomic and hydro power generations subsidize the principal share. Nonetheless, economic procedure has advantageously been considered by appropriate planning of thermal or hydrogenation as it were. Concerning the wellbeing of atomic station, these sorts of stations are required to continue running at its base loads only and there is a minute extension for the schedule of the atomic plants in go through. Economy of movement explicitly, is high enormous in case of the thermal stations, as the variable expenses are much mind boggling contrasted with other kind of generations. This can be exhibited by taking a gander at the different expenses of various stations.
Cost/Stations Hydro Thermal Nuclear
Business costs 75% 20% 70%
Fuel cost 0 70% 20%
Other costs 25% 10% 10%
Clearly the expense of fuel structure of principle part of every single variable expense and the purpose of the economy of activity is to decrease the
expense of fuel.
This is a fixed optimization issue. This endeavor contracts
Economic and Emission Dispatch Problem using
Particle Swarm Optimization
with the monetary dispatch of thermal plants alone. The economic dispatch issue includes the arrangement of two distinct issues. The first of these is the pre dispatch issue wherein it is essential to pick the ideally out of the current producing generations so as to work and meet the estimated load and deliver a predetermined limit of the working backup over an expressed period of time. The second element of economic dispatch is the on-line financial dispatch wherein it is fundamental to apportion the load among the creating units essentially paralleled with the system to confine the all-out expense of providing the moment to - minute necessities of the system. In writing different strategies [1]-[10] are proposed, to fathom Combined Economic and Emission Dispatch (CEED) and Generator Constrained Economic Dispatch independently. This task builds up a proficient conventional-based procedure for handling the Combined Economic and Emission Dispatch (CEED) issue utilizing Lambda-cycle, GA and PSO methodologies considering slope or ramp rate limits and restricted zones of units. A remarkable article of the proposed methodology is its fast convergence and the low computational time. This article is attractive in the expansive scale problems. The thermal scheduling which incorporates the enhancement of an issue with the non-linear objective function, with a mix of the direct, non-immediate and dynamic network stream imperatives. Extensively talking there are two kinds of framework imperatives: (1) Equality limitations, and (2) Inequality requirements. Imbalance limitations are two sorts: (a) Hard sort and (b) Soft sort. The hard kind are the one which are fixed and explicit like the tapping scope of an on-load tap changing transformer though the other one is delicate type are those which have some adaptability related with them like the nodal voltages and the stage point between the nodal voltages, and so forth. Delicate imbalance tightening influences have been adequately managed by the penalty function [9]. The target of Economic Dispatch (ED) is to limit the absolute generation cost of a power system over some suitable period, while fulfilling different requirements. Fuel cost is the principal factor of generation cost and the reactive power does not have any quantifiable impact on generation cost because they can controlled by varying the field current. The compelled improvement issue can be numerically communicated as follows:
1 n
i i i
Minimize F
f P
--- (1)where, F : generation total cost (Rs/hr)
n : number of generators
Pi : power generation of ith generator (MW)
fi (Pi) : generation cost for Pi
The objective function subjected to the different constraints these include:
2.1 System Active Power Balance
The total active control generation must stability the predicted demand plus losses, at each time interim over the planning
skyline.
1 n
i D loss i
P
P
P
--- (2)where, PD : total demand (MW)
Ploss : system transmission loass (MW)
III.PARTICLE SWARM OPTIMIZATION (PSO)
3.1 Flow chart
Subsequent to attaining the best two qualities, the molecule refreshes the speed and positions with following condition
(3) and (4). =
Ꞷ* ---
(3)
--- (4)
where, v is the molecule velocity, Ꞷ is the inertia weight constants rand 1and rand 2 are the random values in between (0, 1). c1, c2 are learning factors. Usually c1= c2 = 2.
Pick the molecule with the best wellness estimation of the considerable number of particles as the gbest.
For every molecule, compute molecule speed concurring condition (3) and update molecule position concurring condition best regard is the close-by best and is called lbest (4) End while greatest cycles or least blunder criteria isn't accomplished molecules speed on every estimation are fixed to most outrageous speed Vmax. In case the aggregate of expanding speeds would influence the speed on estimation to outperform Vmax, which is a parameter controlled by the customer. By then the speed on that estimation is obliged to Vmax.
IV. SIMULATION RESULTS
International Journal of Innovative Technology and Exploring Engineering (IJITEE) ISSN: 2278-3075, Volume-8 Issue-6, April 2019
In these models, the ramp rate limits and the denied zones of the units were considered. Out of available methods three methods utilized for solving the CEED with Generator Constraints. Firstly the problem is solved by PSO and compared with ordinary Lambda iterative method and a Binary coded Genetic Algorithm (GA). At individually sample system, under a similar assessment task and the individual definition, 50 preliminaries were made utilizing the PSO method and the best outcome is presented. A realistic misfortune coefficients grid of the influence framework organize was utilized to inducement the transmission line misfortune and delight the transmission limit choking influences. Programmed in MATLAB and executed on a PC @1.5 GHz. In spite of the fact that the PSO technique seems, by all accounts, to be a touchy to the tuning of certain confinements, as per the encounters of numerous examinations, the accompanying PSO and GA parameters can be utilized.1. GA Method
Number of bits = 12 Populace = 60
Amount of emphases = 250 Selectivity likelihood =0.15 Cross over likelihood = 0.7 Mutation likelihood = 0.01
The equivalent framework gradual expense (λ) is utilized as the encoded parameter in the string.
2. PSO Method
Number of molecules = 10,
wmax = 0.9 and wmin = 0.4, where w is inertia factor.
c1 = 2.02 and c2 = 2.02, where c is a learning factor.
Extreme number of iterations = 250
4.1 Three -unit system
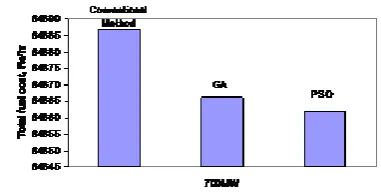
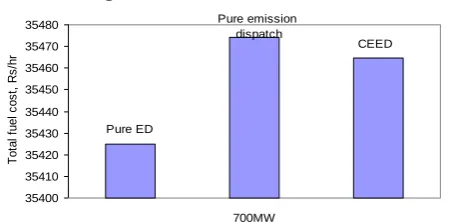
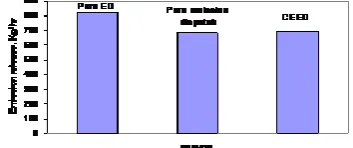
[image:3.595.304.550.44.267.2] [image:3.595.325.515.301.394.2]The producer cost constants, outflow or contaminants coefficients and the generation of the three unit framework are taken from [25] and power capacity available at each load bus in a power system is studied from [26].Transmission misfortune for this system is viewed as utilizing loss coefficient grid and is assumed. ELD answer for the three-unit framework is solved by utilizing PSO. The example problem are solved for economic dispatch, emission dispatch and CEED separately and the results obtained from the three methods are compared. In all of the above solution procedure, case studies are conducted with and without the ramp rate and prohibited zone. Table 1.3 to Table 1.8 summarizes all the outcomes of various load difficulties. The total fuel cost and emission release of PSO method with pure economic dispatch, pure emission dispatch and combined economic and emission dispatch for load of 700MW is considered and the variation is compared in Fig.1.1, Fig.1.2, Fig.1.4 and Fig.1.5. Evaluation of the cost attained by PSO in CEED for load of 700MW is shown in Fig.1.3 and Fig.1.6.
Table 1.1.and 1.2 Emission Coefficients, Cost and Ramp rate limits and prohibited zone limits of 3- Unit Framework
Un it
ai bi ci αi βi γi
1 0.035
46
38.30 553
1243. 5311
0.006 83
-0.54 551
40.26 690
2 0.021
11
36.32 782
1658. 5696
0.004 61
-0.51 160
42.89 553
3 0.017
99
38.27 041
1356. 6592
0.004 61
-0.51 160
42.89 553
Uni
t Pi,min Pi,max URi DRi Prohibited Zones
1 35 210 50 90 [55,85] [115,130]
2 130 325 80 120 [80,90] [230,255]
[image:3.595.327.515.454.538.2]3 125 315 80 120 [80,90]
[230,255]
The Loss Coefficient Matrix of 3- Unit Framework Bij= 0.000071 0.000030 0.000025 0.000030 0.000069 0.000032 0.000025 0.000032 0.000080
[image:3.595.321.512.586.683.2]A. Considering Only Power Limits:
Fig. 1.1 Comparison of total fuel cost attained by Pure ED, Emission Dispatch and CEED for a 3- unit system (PSO method, by considering only the p limits)
Fig. 1.2 Comparison of total Contaminants released by Pure ED, Emission Dispatch and CEED for a 3- unit system (PSO method, by considering only the p limits)
[image:3.595.46.293.714.792.2]B. Considering All Constraints: 35400 35410 35420 35430 35440 35450 35460 35470 35480 700MW To ta l fu e l c o s t, R s /h r Pure emission dispatch Pure ED CEED
Fig. 1.4 Comparison of total fuel cost attained from Pure ED, Pure emission dispatch and CEED for a 3- unit system (PSO method, considering all constraints)
646 648 650 652 654 656 658 660 662 700MW E m is s io n r e le a s e , K g /h
r Pure ED
Pure emission
[image:4.595.303.554.85.260.2]dispatch CEED
Fig. 1.5 Comparison of total Emission release attained from Pure ED, Pure emission dispatch and CEED for a 3- unit system (PSO method, considering all constraints)
[image:4.595.66.279.231.335.2]64845 64850 64855 64860 64865 64870 64875 64880 64885 64890 700MW To ta l c o s t, R s /h r Conventional Method GA PSO
Fig. 1.6 Comparison of total cost attained from Conventional method, GA and PSO for a 3- unit system (considering only power limits)
4.2 Six- unit system
The generator rate constants, emission constants and the generation limits of the six unit framework are taken from [11] and to prevent any fault current from AC or DC grids is studied from [27]. ELD solution for this framework is solved using the evolutionary algorithm such as PSO. The example problem is solved by considering the different generator constraints as in the above test case is for Economic Dispatch, Emission Dispatch and CEED separately and the results attained from the three methods are tabulated. The total cost obtained from the three methods for a load of 900MW is compared in Fig.1.3 and Fig 1.6. The variation in the total fuel cost and emission release of PSO method with pure Economic Dispatch, Emission Dispatch and CEED for load of 900MW is shown in Fig.1.1, Fig.1.2, Fig.1.4 and Fig.1.5.
Table 1.3 Emission and Cost Coefficients of 6-Unit Framework.
U nit
ai bi ci αi βi γi
1 0.152
47 38.539 73 756.7 9886 0.004 19 0.327 67 13.859 32
2 0.105
87 46.159 16 451.3 2513 0.004 19 0.327 67 13.859 32
3 0.028
03 40.396 55 1049. 9977 0.006 83 -0.54 551 40.266 90
4 0.035
46 38.305 53 1243. 5311 0.006 83 -0.54 551 40.266 90
5 0.021
11 36.327 82 1658. 5596 0.004 61 -0.51 411 42.895 53
6 0.017
99 38.270 41 1356. 6592 0.004 61 -0.51 411 42.895 53
Table 1.4 Ramp Rate Limits and Prohibited Zones of 6-Unit Framework
Unit
P
i,minP
i, maxP
i 0UR
iDR
iProhibited
[image:4.595.306.558.305.512.2]Zones
1
10
125
56
45
64
[25,32]
[image:4.595.55.286.387.500.2][60,67]
2
10
150
54
55
78
[50,60]
[92,102]
3
35
225 114
55
65
[105,117]
[165,177]
4
35
210 114
50
90
[55,85]
[115,130]
5
130
325 150
80
120
[80,90]
[230,255]
6
125
315 125
80
120
[80,90]
[230,255]
The Loss Coefficient Matrix of 6-Unit System Bij=
International Journal of Innovative Technology and Exploring Engineering (IJITEE) ISSN: 2278-3075, Volume-8 Issue-6, April 2019
[image:5.595.45.261.51.142.2]A. Considering Only Power Limits:
Fig. 1.7 Comparison of total fuel cost attained by Pure ED, Emission Dispatch and CEED for a 6- unit system (PSO method, by considering only the power limits)
Fig. 1.8 Comparison of total released emission attained by Pure ED, Emission Dispatch and CEED for a 6- unit system (PSO method, by considering the power limits)
79580 79582 79584 79586 79588 79590 79592 79594 79596 79598 79600 79602
900MW
To
ta
l
c
o
s
t,
R
s
/h
r
Conventional method
GA
PSO
Fig. 1.9 Correlation of complete cost attained by PSO, Ordinary method and GA for a 6- unit system (considering only the power limits)
B. Considering All Constraints:
47200 47400 47600 47800 48000 48200 48400 48600 48800 49000
900MW
To
ta
l
fu
e
l
c
o
s
t,
R
s
/h
r
Pure emission dispatch
Pure ED
CEED
Fig. 1.10 Comparison of total fuel cost attained from Pure Economic Dispatch and emission Dispatch and CEED for a 6- unit system (PSO method, considering all constraints)
670 675 680 685 690 695 700 705 710 715 720 725
900MW
E
m
is
s
io
n
r
e
le
a
s
e
,
K
g
/h
r
Pure emission dispatch Pure ED
CEED
Fig. 1.11 Comparison of total Contaminants released from Pure Economic and Emission Dispatch and CEED for a 6- unit system (PSO method, considering all constraints)
79580 79582 79584 79586 79588 79590 79592 79594 79596 79598 79600 79602
900MW
To
ta
l
c
o
s
t,
R
s
/h
r
Conventional method
GA
[image:5.595.314.534.62.177.2]PSO
Fig. 1.12 Correlation of complete expense attained by PSO, Ordinary method and Genetic Algorithm for a 6- unit system (considering only power limits)
V. RESULT ANALYSIS
From the above test cases it is observed that the solution obtained by the conventional method is not an optimum solution. So if the conventional method is used for the resolution for the CEED problem, total cost which tangled and the total emission of NOx in to the atmosphere will be more. When the genetic algorithm applied, then the entire cost attained and the entire emission released is less compared to the conservative method. The premature conjunction nature of the genetic algorithm problem is evaded by presenting the elitism and changing the probabilities of the crosser and mutation. Due to the above situations, the genetic algorithm method will effort high efficiently compared to the conventional method and it will give a better solution. As found in the outcomes, the PSO technique can get for lower fuel cost and generation discharge as the GA strategy, therefore resultant in the higher quality arrangement. This can be seen, in light of the fact that the PSO strategy does not achieve the determination and the hybrid tasks in transformative techniques, it very well may be spare some calculation time when contrasted with the GA strategy, sub sequent these information are the proof of unrivaled assets of the PSO technique.
VI. CONCLUSION
[image:5.595.75.252.207.281.2] [image:5.595.313.539.227.331.2] [image:5.595.56.283.347.459.2] [image:5.595.54.279.527.637.2]The algorithm has been seasoned for the two test frameworks with three and six producing units. The outcomes acquired from PSO strategy are contrasted and regular lambda emphasis method. And GA. Since the conventional method depends on the exact adjustment of lambda value it cannot provide the accurate solution for the problem. The results of GA provide a global optimal solution than the Conventional method. The PSO method has shown ability to give precise and attainable solutions with reasonable calculation time compared to conventional method and GA.
REFERENCES
1. Saifur Rahrnan, E. H. Chowdhury "A Review of Recent Advances in
Economic Dispatch", IEEE Transactions on Power Systems., No. 4,Vol.
5, pp 1248-1259, November 1990.
2. Wollenberg, Allen J. Wood, Bruce F, "A review on Power Generation,
Operation, and Control", John Wiley & Sona, Inc., New York, 2004.
3. J. D. Mc Donald Member Fan J. Y, "A Real-world approach to real time
Economic Dispatch by Unit's Barred Operating Zones", IEEE Transactions on Power Systems,Vol. 9, No. 4, pp 1737-1743, November 1994.
4. Tippayachai. J, W. Ongsakul, “Economic Dispatch with Staircase
Incremental Cost Functions and Linear Decreasing by Micro GA”, NEGTC Technical Journal, Vol1, No. 2, pp 62- 69, May- June 1999.
5. J. L. Hart, A. H. Mama, , "Monetary Dispatch in perspective on Clean Air
Act of 1990", IEEE Transactions on Power Systems, NO.2, Vol.9, pp. 972-978, May 1994.
6. Abido M. A., “Environmental Power Dispatch and Economic Using
Multiobjective Evolutionary Algorithms”, IEEE Trans. Power Syst., NO. 4, Vol. 18, pp 1529-1537, Nov. 2003.
7. F. El-Hawary, M. E. El-Hawary and J. H. Talaq, “A Summary of the
Economic or Environmental Dispatch algorithms,” IEEE Transactions. Power Systems. pp. 1508–1516, vol. 9, Aug. 1994.
8. P. Kothari and I. J. Nagrat, “Modern Power System Analysis”, Tata
Graw-Hill M C Publishing Company Ltd., New Delhi, India, 1989.
9. Wadhwa C L, “Electric Power Systems by New Age International (P)
Ltd”. Publishers, New Delhi, India, 2001.
10.J W Lamont, M R Gent,"Minimum Emission Dispatch by thinking about
age requirements", IEEE Transactions on Power Systems, pp. 2650-2660, Vol. 90,June 1971.
11.Srikrishna K Palanichamy C, “Economic thermal power dispatch with
production constraint”, Journal of Institution of Engineers (India) , pp.11-18, Vol. 72,April 1991.
12.Venkatesh. P, Gnanadass. R, and Narayana Prasad Padhy, “Correlation
and use of transformative Programming procedures to consolidated Economic Emission dispatch with line stream limitations”, IEEE Transactions on Power Systems., NO. 2, Vol. 18, pp 688-697, May 2003.
13.S. M. Shahidehpour, C. Wang,"Ramp-Rate Limits on Economic Dispatch
and Unit Commitment ", IEEE Transactions on Power Systems., No. 3, Vol. 8, \pp 1341-1350, August 1993.
14.Arthur M. Breipohl, Fred N. Lee, "Save Constrained Economic Dispatch
with Prohibited Operating Zone parameters", IEEE Trans. Power Syst., No.1, Vol. 8, pp 246-254, February 1993.
15.S. Rajesekaran and G. A. Vijayalakshmi, “Neural Networks, Fuzzy Logic
and Genetic Algorithms Synthesis and Applications,” Pretice Hall Pvt Ltd. 2003.
16.Kristin Brittig, Gerald B. Sheble, “Economic Dispatch by Refined Genetic
Algorithm”, IEEE Transactions on Power Systems., Vol. 10, No. 1, pp 117- 124, February 1995.
17.Po-Hung Chen, Hong-Chan Chang, “Large-Scale Economic Dispatch by
Genetic Algorithm”, IEEE Trans. on Power Systems, No.4, Vol. 10,pp 1919-1926, November 1995.
18.R. Eberhart, J. Kennedy "Molecule swarm enhancement strategy," in
Proceedings of IEEE International Conference. Neural Networks (ICNN'95), Australia, Perth, vol. IV, pp1942-1948, 1995.
19.Ki-Song Lee, Kwang Y. Lee,Jong-Bae Park, Joong-Rin Shin," Economic
Dispatch with the Non-smooth Cost Functions using PSO", IEEE Transactions on Power Systems., No.1, Vol. 20, pp 34-42, February 2005.
20.Zwe-Lee Gaing, "Economic Dispatch by Considering the Generator
Constraints using Molecule Swarm Optimization ", IEEE Transactions on Power Systems., Aug. 2003, No. 3, Vol 18, pp 1187-1195,.
21.Olle I. Elgerd, "An Introduction to Electric Energy Systems Theory",
Second Edition, Tata McGraw-Hill Publishing Company Ltd., New Delhi, India, 1985.
22. Jaya Kumar.y , K. Dhanushkodi, C. Kumar Charlie Paul, A. Immanuel
Selva Kumar, " Particle or Molecule Swarm Optimization Solution to the CE and ED Problem", IEEE conference in TENCON 2003.
23. R.C Eberhart, Y.Shi, "Observational Study on Particle Swarm
Optimization," IEEE Press, Proceedings of the 1999 Congress of Evolutionary Computation, Vol.3, pp 1945-1950, 1999.
24. Y. Shi, R. C. Eberhart,"Comparing idleness loads and the choking factors
in the PSO," in Proceedings of the Congress of Evolutionary Computation, pp. 84– 88, 2000.
25. S. M. R. Slochanal, M. Sudhakaran, R Sreeram, N Chandrasekhar, "An Application of the Refined Genetic Algorithm for CEED," IE (I) Journal-EL, pp 115-119, Vol. 85, September 2004.
25. T Bharath Kumar, O. Chnadra Sekhar, M. Ramamoorty, S V N L Lalitha,”
Evaluation of power capacity Availability at Load bus in a Composite Power System”, IEEE Journal of Emerging and Selected Topics in Power Electronics, Vol.4, No.4, pp. 1324-1331, Oct 2016.
26. Edara Sreelatha, P. Purnachandra Rao,” A New proposal of SFCL in AC &
DC Micro Grid to Limit the Fault Currents”, International Journal of Scientific Engineering and Research, Vol. 3. Issue 8, ISSN 2347-3878, Aug 2015
AUTHORS PROFILE
V Hemanth Kumar, UG student, Electrical
and Electronics Engineering, Koneru
Laxshmaiah Education Foundation,
Vaddeswaram- 522502, AP, India. His Research interests includes Power Systems and Energy Systems.
Mail: [email protected]
E Sreelatha, Assistant Professor, Electrical
and Electronics Engineering, Koneru
Laxshmaiah Education Foundation,
Vaddeswaram- 522502, AP, India. Her interests include Power Systems, Energy
Systems and Smart Grid Technologies.
Mail: [email protected]
P Srinivasa Varma, Associate Professor, Electrical and Electronics engineering, Koneru
laxshmaiah Education Foundation,
Vaddeswaram- 522502, AP, India. He received his Ph.D. degree in Electrical and Electronics Engineering Dept., JNTUA. His research interests include Power System Deregulation, Power System Reliability, and Energy systems.
Mail: [email protected]
T Bharath Kumar, Post-Doctoral fellow, Indian Institute of Technology Kanpur, UP,
India. His research interests include
Electricity Markets, Ancillary Services, Power system Reliability.