RESEARCH NOTE
A seed germination transcriptomic study
contrasting two soybean genotypes that differ
in terms of their tolerance to the deleterious
impacts of elevated temperatures during seed
fill
Jason D. Gillman
1*, Jessica J. Biever
2,8, Songqing Ye
2, William G. Spollen
3, Scott A. Givan
4, Zhen Lyu
5,
Trupti Joshi
6, James R. Smith
7and Felix B. Fritschi
2Abstract
Objective: Soybean seed development is negatively impacted by elevated temperatures during seed fill, which can decrease seed quality and economic value. Prior germplasm screens identified an exotic landrace able to main-tain ~ 95% seed germination under stress conditions that reduce germination dramatically (> 50%) for typical soybean seeds. Seed transcriptomic analysis was performed for two soybean lines (a heat-tolerant landrace and a typical high-yielding adapted line) for dry, mature seed, 6-h imbibed seed and germinated seed. Seeds were produced in two environments: a typical Midwestern field and a heat stressed field located in the Midsouth soybean production region.
Results: Transcriptomic analysis revealed 23–30K expressed genes in each seed tissue sample, and differentially expressed genes (DEGs) with ≥ twofold gene expression differences (at q-value < 0.05) comprised ~ 5–44% of expressed genes. Gene ontology (GO) enrichment analysis on DEGs revealed enrichment in heat-tolerant seeds for genes annotated for general and temperature-specific stress, as well as protein-refolding. DEGs were also clustered in modules using weighted co-expressed gene network analysis, which were examined for enrichment of GO biologi-cal process terms. Collectively, our results provide new and valuable insights into this unique form of genetic abiotic stress tolerance and to soybean seed physiological responses to elevated temperatures.
Keywords: Soybean, Transcriptomic analysis, Seed germination, Temperature stress, Seed development
© The Author(s) 2019. This article is distributed under the terms of the Creative Commons Attribution 4.0 International License (http://creat iveco mmons .org/licen ses/by/4.0/), which permits unrestricted use, distribution, and reproduction in any medium, provided you give appropriate credit to the original author(s) and the source, provide a link to the Creative Commons license, and indicate if changes were made. The Creative Commons Public Domain Dedication waiver (http://creativecommons.org/ publicdomain/zero/1.0/) applies to the data made available in this article, unless otherwise stated.
Introduction
Soybean (Glycine max L. Merr.) is a major commodity crop, comprising ~ 34% (~ 36.5 million ha) of crop land in the United States in 2017 (http://www.soyst ats.com, accessed 3-21-19). The value of the crop is principally derived from the high yield and quality of oil and pro-tein in the seeds. The Midsouth soybean growing region
of the United States experiences consistent late-season drought, which has resulted in historically reduced on-farm seed yield and economic return [1, 2]. Although irri-gation can at least partially remedy these issues, fuel for pumping water is expensive and long term use of aquifers for agricultural irrigation may be unsustainable [3].
Traditionally, soybean maturity group (MG) 5–7 cul-tivars were planted in May and June with harvest in October and November. An alternative method, the Early Soybean Production System (ESPS) modifies soybean planting and harvest dates to avoid much of the late season endemic drought [2] by use of cultivars
Open Access
*Correspondence: [email protected]
1 USDA-ARS, Plant Genetics Research Unit, 205 Curtis Hall, University of Missouri, Columbia, MO 65211, USA
that flower and mature earlier (typically MG 3–4 and early 5 as compared with MG5-7) and by adjust-ing plantadjust-ing dates to early-to-mid-April with harvest typically occurring in September. The practices of the ESPS in the Midsouth region has increased seed yield and on-farm return on investment [1, 3] under both irrigated and non-irrigated conditions [1].
Soybean has traditionally been considered to be heat-tolerant, with a vegetative optimum temperature of ~ 30 °C [4]. However, the processes of pollination and seed growth/maturation are sensitive to elevated temperatures; the reproductive optimum is a relatively low 22–24 °C [5]. Despite economic and seed yield gains under the ESPS, seed produced in this system are exposed to much higher temperatures [6] during seed fill (≥ 32 °C maximum daytime temperature) than seeds of MG 5–7 cultivars produced in the traditional system. In typical MG 4 cultivars, exposure to such high temperatures during seed development reduces seed quality/germination, increases pathogen infec-tion, and often results in economic loss through seed dockage [3, 7].
Soybean is a self-pollinating species, and modern high-yielding cultivars derive from an extremely lim-ited genetic base; traditional breeding has exacerbated this problem [8, 9]. Exotic landraces may contain novel disease and stress resistance genes; a successful screen identified lines that can tolerate the high temperature associated with the ESPS [6]. An unimproved landrace (PI 587982A) has consistent and robust resistance (> 90% germination, near absence of Phomopsis lon-gicolla infection). The first United States heat toler-ant germplasm release, with tolerance derived from PI 587982A, was recently made by our group [10].
Transcriptomics, enabled by advances in DNA sequencing and computation, is a powerful tool to identify gene expression differences and correlations with genetic/developmental cues or environmental conditions. Detailed studies have generated “transcrip-tomic atlases” for soybean gene expression [11–15]. However, studies have ignored soybean seed germina-tion, in favor of seed development or vegetative tissues (typically leaves or roots). In this study, we examined three soybean seed germination stages: (1) dry, mature seed; (2) imbibed seed; and (3) germinated seed and contrasted two soybean genotypes which differ in their tolerance to the impact of elevated temperature on seed quality, using seed produced in two environments differing in abiotic stress: (A) a lower temperature, Midwest location; and (B) the high temperature condi-tions of the ESPS.
Main text Methods
Field seed production, seed imbibition and germination measurement, and RNA isolation and RNA sequencing, mapping and statistical analysis
Full details are provided in Additional file 1.
GO term enrichment and venn diagrams
GO term enrichment was performed using the tool present on Soybase (https ://soyba se.org/gosli mgrap hic_v2/dashb oard.php) using DEGs identified through Cuffdiff analysis. Venn diagrams were generated using the Venny tool at http://bioin fogp.cnb.csic.es/tools / venny /index .html and the Venn diagram tool at http:// bioin forma tics.psb.ugent .be/webto ols/Venn/.
Whole genome comparative network analysis and gene ontology enrichment of co‑expressed gene modules
Modules of genes with highly correlated expres-sion patterns were described using weighted gene co-expression network analysis (WGCNA). We expect these modules to correspond to networks of genes that are co-expressed and thus interact and share biological processes. We constructed unsigned weighted gene co-expression modules using the WGCNA [16] package in R. The blockwiseModules function was run with the Pearson correlation coefficient and a soft thresholding power of 18. The resulting genes modules were named by assigning them different colors arbitrarily. Addition-ally, we further analyzed each module by conducting significant associations for Gene Ontology (GO) func-tion annotafunc-tions enrichment analysis (Addifunc-tional file 5) and used hierarchical clustering to group differentially expressed genes across samples (Additional file 2).
g:GOSt (https ://biit.cs.ut.ee/gprofi ler/gost) was used to examine modules detected by WGCNA, in order to detect statistically significant enriched GO terms within specific modules, using the Benjamin–Hochberg FDR method at α = 0.05 as significant.
qRT‑PCR analyses
qRT-PCR analysis was performed as described [17], using the ΔΔCt method [18]. FPKM output was nor-malized to the cons14 [19] gene (Glyma16g32510) and expressed as log2 ratio for comparison to CuffDuff output.
Results/discussion Germination assays
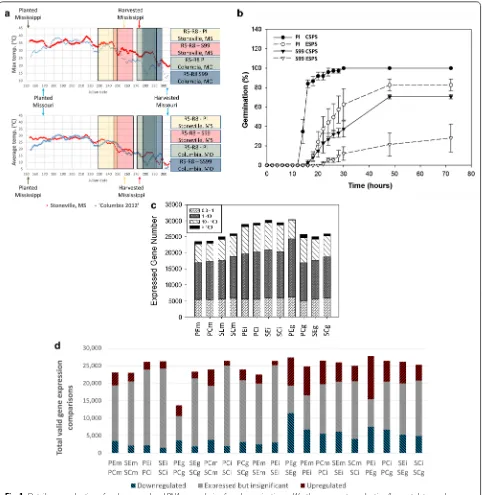
“PI”; and (2) S99-11986, a conventional high yielding improved line [20], comparable to cultivars commonly grown in the Midsouth and Midwest regions, hence-forth referred to as “SG”. Seed to be germinated were produced (Fig. 1a) in one of two environments: (1) a location with endemic high temperature stress associ-ated with the Early Soybean Production System (hence-forth refered to as ESPS—Stoneville, MS; Fig. 1a); or (2) a less stressful Conventional Soybean Production Sys-tem (CSPS—Columbia, MO; Fig. 1a).
Seed of the PI line were found to germinate much more rapidly than those of the SG line in both environ-ments (Fig. 1b), and PI seed from both unstressed and heat-stressed locations germinated with very high effi-ciency (> 80%, Fig. 1a). In contrast, only 75% of CSPS-produced seed from SG germinated by the end of 72 h. A dramatic reduction in germination was noted for SG seed produced under the heat-stress of the ESPS (~ 30% germination at 72 h, Fig. 1b). Our germination results are concordant with our previous metabolic study [21].
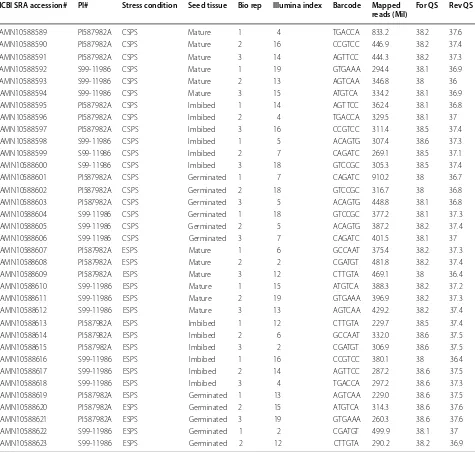
Table 1 RNAseq sample details
NCBI SRA accession# PI# Stress condition Seed tissue Bio rep Illumina index Barcode Mapped
reads (Mil) For QS Rev QS
SAMN10588589 PI587982A CSPS Mature 1 4 TGA CCA 833.2 38.2 37.6
SAMN10588590 PI587982A CSPS Mature 2 16 CCG TCC 446.9 38.2 37.4
SAMN10588591 PI587982A CSPS Mature 3 14 AGT TCC 444.3 38.2 37.3
SAMN10588592 S99-11986 CSPS Mature 1 19 GTG AAA 294.4 38.1 36.9
SAMN10588593 S99-11986 CSPS Mature 2 13 AGT CAA 346.8 38 36
SAMN10588594 S99-11986 CSPS Mature 3 15 ATG TCA 334.2 38.1 36.9
SAMN10588595 PI587982A CSPS Imbibed 1 14 AGT TCC 362.4 38.1 36.8
SAMN10588596 PI587982A CSPS Imbibed 2 4 TGA CCA 329.5 38.1 37
SAMN10588597 PI587982A CSPS Imbibed 3 16 CCG TCC 311.4 38.5 37.4
SAMN10588598 S99-11986 CSPS Imbibed 1 5 ACA GTG 307.4 38.6 37.3
SAMN10588599 S99-11986 CSPS Imbibed 2 7 CAG ATC 269.1 38.5 37.1
SAMN10588600 S99-11986 CSPS Imbibed 3 18 GTC CGC 305.3 38.5 37.4
SAMN10588601 PI587982A CSPS Germinated 1 7 CAG ATC 910.2 38 36.7
SAMN10588602 PI587982A CSPS Germinated 2 18 GTC CGC 316.7 38 36.8
SAMN10588603 PI587982A CSPS Germinated 3 5 ACA GTG 448.8 38.1 36.8
SAMN10588604 S99-11986 CSPS Germinated 1 18 GTC CGC 377.2 38.1 37.3
SAMN10588605 S99-11986 CSPS Germinated 2 5 ACA GTG 387.2 38.2 37.4
SAMN10588606 S99-11986 CSPS Germinated 3 7 CAG ATC 401.5 38.1 37
SAMN10588607 PI587982A ESPS Mature 1 6 GCC AAT 375.4 38.2 37.3
SAMN10588608 PI587982A ESPS Mature 2 2 CGA TGT 481.8 38.2 37.4
SAMN10588609 PI587982A ESPS Mature 3 12 CTT GTA 469.1 38 36.4
SAMN10588610 S99-11986 ESPS Mature 1 15 ATG TCA 388.3 38.2 37.2
SAMN10588611 S99-11986 ESPS Mature 2 19 GTG AAA 396.9 38.2 37.3
SAMN10588612 S99-11986 ESPS Mature 3 13 AGT CAA 429.2 38.2 37.4
SAMN10588613 PI587982A ESPS Imbibed 1 12 CTT GTA 229.7 38.5 37.4
SAMN10588614 PI587982A ESPS Imbibed 2 6 GCC AAT 332.0 38.6 37.5
SAMN10588615 PI587982A ESPS Imbibed 3 2 CGA TGT 306.9 38.6 37.5
SAMN10588616 S99-11986 ESPS Imbibed 1 16 CCG TCC 380.1 38 36.4
SAMN10588617 S99-11986 ESPS Imbibed 2 14 AGT TCC 287.2 38.6 37.5
SAMN10588618 S99-11986 ESPS Imbibed 3 4 TGA CCA 297.2 38.6 37.3
SAMN10588619 PI587982A ESPS Germinated 1 13 AGT CAA 229.0 38.6 37.5
SAMN10588620 PI587982A ESPS Germinated 2 15 ATG TCA 314.3 38.6 37.6
SAMN10588621 PI587982A ESPS Germinated 3 19 GTG AAA 260.3 38.6 37.6
SAMN10588622 S99-11986 ESPS Germinated 1 2 CGA TGT 499.9 38.1 37
[image:4.595.61.536.271.723.2]We then selected three stages (Fig. 1b, Table 1) to obtain transcriptomic data: (1) mature, dry seed; (2) 6-h imbibed seed; and (3) germinated seed with emerged radicle for each genotype grown in both environments (Fig. 1b, Table 1). It is important to note that the time from imbibition to germination varied between geno-type/environments (Fig. 1b). Three biological replicates (each consisting of 5 seed) per genotype/condition/
[image:5.595.58.540.215.679.2]timepoint were used for analysis to quantify gene expres-sion. The number of genes expressed (FPKM > 0.3) in each sample ranged from 23,560 to 30,349 (Fig. 1c, Table 1).
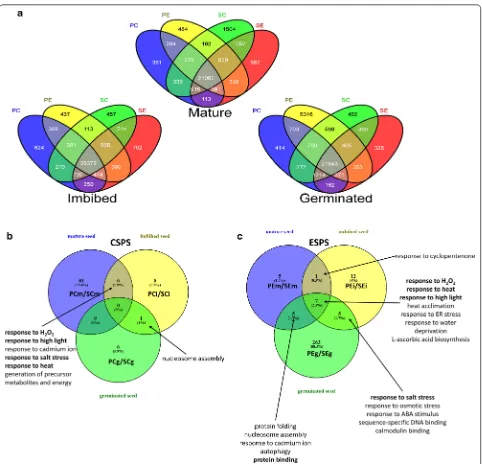
A core set of genes expressed was identified: (A) 21,082 in all mature seed tissues; (B) 26,372 genes expressed in all 6 h imbibed seed tissues; and (C) 21,843 genes in all germinated seed tissues (Fig. 2a, Additional file 3).
Differential expressed gene analysis
We utilized a Tuxedo RNAseq analysis pipeline to make 20 distinct comparisons, which can be divided into four general categories: (1) environmental effects; (2) geno-typic effects; (3) the transition between mature seeds to 6-h imbibed seeds; and (4) the transition between imbibed seeds to germinated seeds (Table 1, Additional file 4).
An average of 7385 differentially expressed genes (DEGs) were detected between environments (threshold for all comparisons was q-value < 0.05). An average of 7789 DEGs were detected between genotypes. An aver-age of 11,833 DEGs were detected between mature and 6-h imbibed seeds, across genotypes and environments (Fig. 1d). Lastly, an average of 13,344 DEGs were detected between imbibed and germinated seeds (Fig. 1d, full details are presented in Additional file 4).
Gene ontology enrichment
We utilized a gene ontology (GO) term enrichment tool (https ://soyba se.org/gosli mgrap hic_v2/dashb oard.php) to examine lists of differentially expressed genes for the 20 comparisons (Figs. 1d, 2b, c, Additional file 5). A larger number of DEGs were found in comparisons of developmental transitions (from mature-to-imbibed or imbibed-to-germinated seeds) than within the same developmental stage (either between environments or between genotypes). Seed development/matura-tion under the high temperature condidevelopment/matura-tions of the ESPS (Figs. 1d, 2b, Additional file 5) was associated with signif-icant enrichment (at a threshold p-value < 0.05) for gene annotations for heat stress, response to oxidative stress and protein folding; “response to hydrogen peroxide”, “response to high light intensity”, and “response to heat” were both overrepresented and GO-term enriched in all 6 comparisons for environmental effects, with “response to wounding” overrepresented and GO term enriched in 4/6 comparisons (excepting comparisons #2, #4; compar-ison numbers specified in Additional file 5). The enrich-ment of numerous GO terms associated with abiotic stress response gives a clear indication that the mRNA pools of both genotypes are responsive to the higher tem-peratures of the ESPS as compared to the less stressful CSPS.
Despite this environmental response, seed mRNA pools of the heat-tolerant line were further enriched (Fig. 2b, Additional file 5) for genes with GO-terms asso-ciated with abiotic stress response [e.g. “response to high light intensity”, “response to hydrogen peroxide” and “response to heat” in 5/6 comparisons (excepting #9)” and “response to water deprivation” in 4/6 (excepting #7, #9); “response to cadmium ion” in 4/6 comparisons (except-ing #9, #11); “response to salt stress” in 4/6 comparisons
(excepting #9, #10)]. In addition we observed enrich-ment in the tolerant PI mRNA pools for protein refold-ing-associated GO terms: “nucleosome assembly” in 4/6 comparisons (excepting #7, #11) and “response to endo-plasmic reticulum stress. The GO term “l-ascorbic acid biosynthesis” was also observed to be enriched in seed of the stress tolerant PI under the ESPS; these results are concordant our previous metabolomics study [21], which conclusively demonstrated that higher levels of ascorbate precursors were found in seeds of a heat-tolerant soy-bean line. Collectively, these results suggest fundamental differences exist between seed mRNA pools between the two genotypes; the more stress tolerant PI genotype is effectively “genetically primed” to more effectively man-age abiotic stress as well as for higher levels of seed anti-oxidant compounds. This mRNA priming trend persists through seed germination and ultimately biologically translates to more efficient and effective seed germina-tion (and in field condigermina-tions seedling emergence).
Weighted gene co‑expression network analysis
Weighted gene co-expression network analysis (WGCNA) is a systems biology method for describing the correlation patterns among genes across samples [16]. We utilized the WGCNA package in R on FPKM data of all samples to find modules (clusters) of highly correlated expressed differential genes (≥ twofold) and a total 16 clusters were detected (Additional files 6 and 7; clusters are color coded).
Co-expressed gene clusters were then examined for overabundance of GO Biological Process terms (Addi-tional file 8, GO Molecular Function are also provided in Additional file 9). For brevity, only Biological Process results will be discussed here. For 6/16 GO:BP clusters no significantly enriched GO terms were found (salmon, pink, purple, midnightblue, magenta, black). Several gene clusters were enriched for gene expression/chromatin remodeling (Yellow, GreenYellow, Brown) for transla-tion/ribosome components (Yellow, Blue), mRNA splic-ing (Cyan, Brown) Actin/Cytoskeleton (Red, Grey) for Cell wall/Carbohydrate metabolism (Turquoise, Red). Of particular interest is the Green gene expression module, which displayed enrichment for numerous GO:BP terms annotated for abiotic stress responses (e.g. response to temperature stimulus, response to reactive oxygen spe-cies, response to salt stress, response to heat, response to stress, etc.).
Validation of RNAseq data using qRT‑PCR
lower expressed genes (SAM-methyltransferase, aver-age 31 FPKM; UDP-glycosyl transferase, average 4.0 FPKM). qRT-PCR were tested via the ΔΔCt method and expressed as log2 ratios (Additional file 11). Correlations between qRT-PCR and FPKM results were robust for mature (r2= 0.9729) and imbibed (r2= 0.9919), but less
robust for germinated samples (r2= 0.6844). The high
concordance between RNAseq and qRT-PCR highlights the high quality of our RNAseq dataset.
Conclusions
In this study we provide substantial new mRNA sequencing data that defines the very early stages of soybean seed germination (mature seed > imbibed seed > germinated seed). We also contrasted two geno-types which differ in terms of tolerance to high tem-perature stress during seed development, which were produced under two distinct temperature stress field locations. We demonstrate that the more temperature-tolerant PI genotype is primed at the mRNA level to handle higher levels of temperature stress. In addition, we demonstrate that the PI line has faster, more efficient and more effective seed germination regardless of seed production location/environmental stress. These results highlight some of the genetic gains possible by leverag-ing exotic soybean germplasm as sources of novel traits in soybean breeding programs.
Limitations
The experiment mandated a need to visually rate seeds (exposure to light) during germination on prewetted filter paper. Therefore, the transcriptomes may not completely reflect how germination of seeds in soil would proceed.
We observed poor clustering of RNAseq data for ger-minated seeds of the PI produced in the ESPS with other samples (PEG, Additional file 2), which is most evident in the large number of significant DEGs detected (Addi-tional file 4).
Additional files
Additional file 1. Additional field, sample, RNA sequencing and mapping methods.
Additional file 2. Hierarchical clustering and heatmap of differentially expressed genes.
Additional file 3. Cufflinks fragment per kilobase million (FPKM) results for all samples.
Additional file 4. Cuffdiff differentially expressed gene results.
Additional file 5. Gene ontology (GO) enrichment results for 20 DEG comparisons.
Additional file 6. Heatmap of genes analyzed by weighted gene co-expression network analysis (WGCNA, ≥ twofold difference on a log2 scale).
Additional file 7. Weighted gene co-expression network analysis (WGCNA) for gene function for differentially expressed genes (≥ twofold difference on a log2 scale).
Additional file 8. Gene ontology biological process term enrichment analysis of modules identified by weighted gene co-expression network analysis (WGCNA).
Additional file 9. Gene ontology molecular function term enrichment analysis of modules identified by weighted gene co-expression network analysis (WGCNA).
Additional file 10. Primer sequences used for qRT-PCR.
Additional file 11. Figure displaying correlation of qRT-PCR and RNAseq data.
Abbreviations
CSPS: conventional soybean production system; DEG: differentially expressed genes; ESPS: early soybean production system; FPKM: fragment per kilobase million; GO: gene ontology; MG: maturity group; mRNA: messenger ribonu-cleic acid; PI: plant introduction; qRT-PCR: quantitative real time polymer-ase chain reaction; RNAseq: ribonucleic acid sequencing; SG: susceptible genotype S99-11986; TG: tolerant genotype PI587982A; USDA-GRIN: United States Department of Agriculture-Germplasm Resources Information Network; WCGNA: weighted co-expressed gene network analysis.
Acknowledgements Not applicable.
Authors’ contributions
JDG conceived of the study, performed germination experiments, isolated RNA, prepared libraries, and main-authored the paper. SY and WS carried out bioinformatics analyses under the supervision of SG. JB performed statistical analyses, and created the first draft of the manuscript. JRS was involved in the conception of the study, provided all soybean lines, and co-authored the manuscript. FB was involved in conception of the study, supervision of SY and JB and in co-authoring the manuscript. ZL performed the WGCNA gene module analysis. TJ was responsible for bioinformatics analyses related to the SoyKB (http://www.soykb .org) data depository and informatics tools hosted therein. All authors have reviewed the manuscript. All authors read and approved the final manuscript.
Funding
Funds for sequencing and bioinformatics analysis (to WS, SG) was drawn from internal USDA-ARS project funds (5070-21000-038-00D). The salary for SY was from a United Soybean Board Grant (1420-532-5613), and salary for JB from a Missouri Soybean Merchandising Council Grant (#14-359). Funding agencies provided financial support to certain authors, but played no direct role in study design, data collection/analysis/interpretation nor in writing the manuscript
Availability of data and materials
All sequence data obtained have been deposited in the NCBI Sequence Read Archive under project SRP090036. Analyzed datasets have also been uploaded to the SoyKB community resource (http://www.soykb .org) [22–24] and is freely available to all researchers for visualization and interactive data analysis purposes, within the “Differential Expression Suite of Tools” and gene card pages in SoyKB. PI 587982A and S99-11986 are available from the USDA-GRIN germplasm repository (https ://npgsw eb.ars-grin.gov/). Seed from public germplasm release DS25-1, which has heat tolerance from PI 587982A in an agronomically and yield improved line, is available by contacting Dr. Rusty Smith ([email protected]). DS25-1 is also available from the USDA-GRIN germplasm repository where and can be located under the identifier PI 684675.
•fast, convenient online submission •
thorough peer review by experienced researchers in your field • rapid publication on acceptance
• support for research data, including large and complex data types •
gold Open Access which fosters wider collaboration and increased citations maximum visibility for your research: over 100M website views per year •
At BMC, research is always in progress.
Learn more biomedcentral.com/submissions
Ready to submit your research? Choose BMC and benefit from: Consent for publication
Not applicable.
Competing interests
The authors declare that they have no competing interests.
Author details
1 USDA-ARS, Plant Genetics Research Unit, 205 Curtis Hall, University of Mis-souri, Columbia, MO 65211, USA. 2 Divisions of Plant Science, University of Missouri-Columbia, Columbia, MO 65211, USA. 3 Informatics Research Core Facility, University of Missouri-Columbia, Columbia, MO 65211, USA. 4 Bioinformatics and Biostatistics Core, Van Andel Research Institute, University of Missouri-Columbia, Columbia, MO, USA. 5 Department of Electrical Engi-neering and Computer Science, University of Missouri-Columbia, Columbia, MO, USA. 6 Health Management and Informatics, MU Informatics Institute, Interdisciplinary Plant Group and Christopher S. Bond Life Science Center, University of Missouri-Columbia, Columbia, MO 65211, USA. 7 USDA-ARS, Crop Genetics Research Unit, Stoneville, MS 38776, USA. 8 Present Address: Metro-politan Community College-Penn Valley, Kansas City, MO, USA.
Received: 18 June 2019 Accepted: 10 August 2019
References
1. Heatherly LG, Spurlock SR. Yield and economics of traditional and early soybean production system (ESPS) seedings in the midsouthern United States. Field Crops Res. 1999;63(1):35–45.
2. Heatherly LG. Early soybean production system (ESPS). In: Heatherly LG, Hodges HF, editors. Soybean production system in the midsouth. Boca Raton: CRC Press; 1999. p. 103–15.
3. Heatherly LG. Yield and germinability of seed from irrigated and nonirrigated early- and late-planted MG IV and V soybean. Crop Sci. 1996;36(4):1000–6.
4. Hesketh JD, Myhre DL, Willey CR. Temperature control of time intervals between vegetative and reproductive events in soybeans. Crop Sci. 1973;13(2):250–4.
5. Hatfield JL, Boote KJ, Kimball BA, Ziska LH, Izaurralde RC, Ort D, Thomson AM, Wolfe D. Climate impacts on agriculture: implications for crop pro-duction. Agron J. 2011;103(2):351–70.
6. Smith JR, Mengistu A, Nelson RL, Paris RL. Identification of soybean acces-sions with high germinability in high-temperature environments. Crop Sci. 2008;48(6):2279–88.
7. Mengistu A, Heatherly LG. Planting date, irrigation, maturity group, year, and environment effects on Phomopsis longicolla, seed germination, and seed health rating of soybean in the early soybean production system of the midsouthern USA. Crop Prot. 2006;25(4):310–7.
8. Hyten DL, Song Q, Zhu Y, Choi IY, Nelson RL, Costa JM, Specht JE, Shoemaker RC, Cregan PB. Impacts of genetic bottlenecks on soybean genome diversity. Proc Natl Acad Sci USA. 2006;103(45):16666–71. 9. Gizlice Z, Carter TE, Burton JW. Genetic base for north american
public soybean cultivars released between 1947 and 1988. Crop Sci. 1994;34(5):1143–51.
10. Smith JR. Soybean germplasm line DS25-1 with heat tolerance and competitive yield under heat stress. Columbia: USDA-ARS; 2017.
11. Libault M, Farmer A, Joshi T, Takahashi K, Langley RJ, Franklin LD, He J, Xu D, May G, Stacey G. An integrated transcriptome atlas of the crop model Glycine max, and its use in comparative analyses in plants. Plant J. 2010;63(1):86–99.
12. Severin AJ, Woody JL, Bolon Y-T, Joseph B, Diers BW, Farmer AD, Mue-hlbauer GJ, Nelson RT, Grant D, Specht JE, Graham MA, Cannon SB, May GD, Vance CP, Shoemaker RC. RNA-Seq atlas of glycine max: a guide to the soybean transcriptome. BMC Plant Biol. 2010;10(1):160.
13. Woody JL, Severin AJ, Bolon Y-T, Joseph B, Diers BW, Farmer AD, Weeks N, Muehlbauer GJ, Nelson RT, Grant D, Specht JE, Graham MA, Can-non SB, May GD, Vance CP, Shoemaker RC. Gene expression patterns are correlated with genomic and genic structure in soybean. Genome. 2010;54(1):10–8.
14. Komatsu S, Yamamoto R, Nanjo Y, Mikami Y, Yunokawa H, Sakata K. A comprehensive analysis of the soybean genes and proteins expressed under flooding stress using transcriptome and proteome techniques. J Proteome Res. 2009;8(10):4766–78.
15. Le DT, Nishiyama R, Watanabe Y, Tanaka M, Seki M, Ham LH, Yamaguchi-Shinozaki K, Yamaguchi-Shinozaki K. Tran L-SP: differential gene expression in soybean leaf tissues at late developmental stages under drought stress revealed by genome-wide transcriptome analysis. PLoS ONE. 2012;7(11):e49522.
16. Langfelder P, Horvath S. WGCNA: an R package for weighted correlation network analysis. BMC Bioinform. 2008;9(1):559.
17. Gillman JD, Kim W-S, Krishnan HB. Identification of a new soybean Kunitz trypsin inhibitor mutation and its effect on Bowman–Birk protease inhibi-tor content in soybean seed. J Agric Food Chem. 2015;63(5):1352–9. 18. Livak KJ, Schmittgen TD. Analysis of relative gene expression data using
real-time quantitative PCR and the 2(-Delta Delta C(T)) method. Methods. 2001;25(4):402–8.
19. Libault M, Thibivilliers S, Bilgin DD, Radwan O, Benitez M, Clough SJ, Sta-cey G. Identification of four soybean reference genes for gene expression normalization. Plant Genome. 2008;1:44–54.
20. Shannon JG, Nelson RL, Wrather JA. Registration of 11509 and S99-11986 improved soybean germplasm with diverse pedigree registration by CSSA. Crop Sci. 2005;45(4):1672–3.
21. Chebrolu KK, Fritschi FB, Ye S, Krishnan HB, Smith JR, Gillman JD. Impact of heat stress during seed development on soybean seed metabolome. Metabolomics. 2016;12(2):28.
22. Joshi T, Patil K, Fitzpatrick MR, Franklin LD, Yao Q, Cook JR, Wang Z, Libault M, Brechenmacher L, Valliyodan B, Wu X, Cheng J, Stacey G, Nguyen HT, Xu D. Soybean knowledge base (SoyKB): a web resource for soybean translational genomics. BMC Genom. 2012;13(Suppl 1):S15. 23. Joshi T, Wang J, Zhang H, Chen S, Zeng S, Xu B, Xu D. The evolution of
soybean knowledge base (SoyKB). Methods Mol Biol. 2017;1533:149–59. 24. Joshi T, Fitzpatrick MR, Chen S, Liu Y, Zhang H, Endacott RZ, Gaudiello EC,
Stacey G, Nguyen HT, Xu D. Soybean knowledge base (SoyKB): a web resource for integration of soybean translational genomics and molecular breeding. Nucleic Acids Res. 2014;42(Database issue):D1245–52.
Publisher’s Note