International Journal of Innovative Technology and Exploring Engineering (IJITEE) ISSN: 2278-3075, Volume-8 Issue-12, October 2019
Abstract: Emerging trends in the widespread use of technology has led to proliferation of images and videos acquired and distributed through electronic devices. There is an increasing need towards capturing high fidelity images and filtering of the concomitant noise inevitable in the capture, transmission and reception of the same. In this paper, we propose an OPSS (Optimized Patch based Self Similar) filter that exploits concurrently the photometric, geometric and graphical patch similarities of the image. This model recognizes similar patches to segregate the corrupted from the uncorrupted pixels in an image and improve the performance of denoising. Photometric patch similarity is established by using Non-Local Means Decision Based Unsymmetrical Trimmed Median (NLM-DBUTM) filter, which computes weights based on the reference patch. The geometrical patch similarity is done through the K-means clustering and graphically similar patches are identified through Ant Colony Optimization (ACO) technique. These “three similarities” based models have been taken advantage of and combined to arrive at a more comprehensive and effective denoising. The results obtained through the OPSS algorithm demonstrate improved efficiency in removing Gaussian and Impulse noise. Experimental results demonstrate that our proposed study achieves good performance with respect to other denoising algorithms being compared. Experimental results are based on performance measure (evaluation parameters) through Peak Signal to Noise Ratio (PSNR), Mean squared error (MSE) and Structural Similarity Index Measure (SSIM).
Keywords: Ant Colony Optimization (ACO), Image Denoising, Non Local Means-Decision Based Un-Symmetric Trimmed Median (NLM-DBUTM), Locally Adaptive Regression Kernels (LARKs), Optimized Self Similar Patch based Filter (OPSS).
I. INTRODUCTION
Noise is inevitable in the process of image capturing; hence the need to arrive at effective algorithms towards identification and filtering of noise is a challenging area for any researcher. With progressive improvement in optics and photo sensor technology in equipment that aid in capturing images, manufacturers are deploying sophisticated denoising algorithms towards minimizing noise to improve the clarity and accuracy of images [1]. This has fuelled the drive for developing improved denoising algorithms that selectively identify the noisy patches and filter them effectively to achieve accurate results.
Revised Manuscript Received on October 05, 2019.
* Correspondence Author
A.Gayathri, Associate Professor, Department of Computer Science and Engineering, Saveetha School of Engineering, SIMATS, Chennai, India
Email: [email protected] , [email protected] S.Christy, Assistant Professor (SG), Department of Information Technology, Saveetha School of Engineering, SIMATS, Chennai, India
Email: [email protected] , [email protected]
II. BACKGROUNDWORK
Image denoising is a familiar domain and researchers have developed various algorithms and methods to overcome noise. Among the varied approaches and models that have been developed for denoising of images, the following papers form the basis for the present study and research work. Priyam Chatterjee et al [2] [3] [4] proposed Patch based Locally Optimal Wiener filter (PLOW) method that takes advantage of patch redundancy parameter for denoising images. In this model, the authors have done in depth analysis of geometrical as well as photometrical similar patches to arrive at a design with a sound statistical foundation. Although this method improves the performance of denoising, it does not take into account the intensity parameters of images with signal dependent noise.
Yifeil Lou et al [5] proposed an algorithm that takes advantage of the recurrence of structures at different locations, orientations and scales in an image for denoising. Primarily this framework extracts similarity invariant descriptors at each pixel location and identifies similar patches by matching descriptors based on Scale-Invariant Feature Transform (SIFT). This algorithm is applied to estimate rotation and scale of each patch and transform it into canonical form. This method is an improvement over the earlier methods in terms of restoration of replicated patterns with different scale and rotation. However, this technique is not suitable for addressing Gaussian noise.
Jing Tian et al [6] proposed a technique termed ACO (Ant Colony Optimization), to tackle the problem of image edge detection in the denoising process, inspired by the natural behavior of ant species. This approach establishes a pheromone matrix that defines the edge information of each pixel in the image. This approach yields superior subjective performance over other prevalent edge detection algorithms. Angelino et al [7] developed a model based on steering weights of geometrical similar regions using clustering technique. The motivation behind clustering is to segregate the corrupted pixels from the uncorrupted ones of an image to identify geometrical similar patches. This is comparatively faster and performs better than other similar models.
Esakkirajan et al [8] proposed a Modified Decision Based Unsymmetrical Trimmed Median filter algorithm (MDBUTM) for the restoration of gray scale and color images that are highly corrupted with salt and pepper noise. In the process of image denoising this framework replaces the noisy pixels by trimmed median values and envisages a modified DBUTM filter to obtain better visual and quantitative results in terms of
PSNR.
Image De-noising using Optimized Self Similar
Patch based Filter
Literature Analysis - The bilateral filters used earlier by prominent researchers had a limitation in its denoising ability as the intensity similarity was evaluated by comparing its value of a given pixel with another pixel. To alleviate this problem, a patch based filter is proposed wherein the intensity (photometric) similarity is evaluated by comparing a whole patch around each pixel. The evolution from “dictionary construction and learning” to “structural clustering and sparsity optimization” offers refreshing insights on how locality and convexity have served to double-up in the denoising process of photographic images. The proposed work takes into account graphical patch similarity, in addition to geometric and photometric patch similarities for denoising an image.
III. PROPOSEDTECHNIQUE
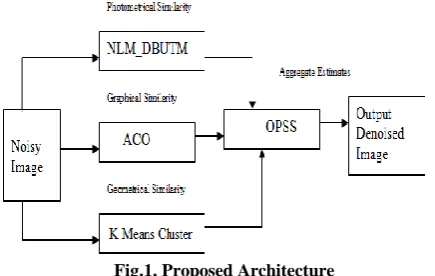
[image:2.595.63.281.325.463.2]The proposed Optimized Patch based Self Similar algorithm (OPSS) work aims to develop a novel technique for image denoising based on the process of restoration. This technique exploits the geometrical, photometrical [2] and graphical similar patches existing in an image.
Fig.1. Proposed Architecture
Figure 1 describes the architecture of OPSS and its sub modules - (i) Noise Distribution for adding noise to the original image σ = 5, 15 and 25, Noise distribution is the method of changing each pixel value in the image from the original value. Adding noise (w) to the original image (f) will result in the noisy image (y), which is used as a sample to demonstrate the efficiency and effectiveness of denoising model. The sample is processed and filtered subsequently to arrive at the corrected image, which closely matches the original picture. This validates the effectiveness of the algorithm to elicit a similar level of performance in the denoising of real time images. The pixel intensity of a noisy image yi can be estimated as yi = fi + wi for i = 1,··· ,M. Where y is the noisy image, f is the underlying true image and w is a zero-mean Gaussian noise with known variance σ2. (ii) NLM-DBUTM for finding photometrical Similar Patches in inner level iteration. (iii) K-means Clustering for finding geometrical similar patches in middle level iteration (iv) Ant Colony Optimization for finding graphical similar patches in outer level iteration. Based on the values derived from these modules, Optimized Self Similar Patch based Filter is applied for denoising an image.
3.1 OPTIMIZED SELF SIMILAR PATCH BASED FILTER (OPSS)
OPSS filter is expressed as a summation of three related parts namely photometrical, geometrical and graphical similarities obtained as denoised estimation for each patch of an image. The moment parameter Z is derived from
geometrically similar patches of an image and considered as naïve denoised over smoothened estimate. Weighted mean of photometrically similar patches are added with filtered residuals which serve as corrections and enhances the estimation. To suppress further noise, this process applies directional filtering of the residuals based on shared geometric structures and restores finer details of the image patches.
The OPSS estimates the patches in an image independently without explicit consideration of overlapping patches. This framework is in synchronization with underlying noise free patch parameters from each cluster of an image and are directly used exploiting the self-similarities within the image. To calculate the weights of similar patches, initially to identify patches within noisy image that are photometrically similar to a given reference patch and subsequently synonymous patches are denoised to exert greater influence over the image in the process of denoising. This is ensured by the analytically derived weight wij, which determines the contributing factor for patch yj in denoising the reference patch yi.
The primary task OPSS, is to identify geometrically similar
patches through clustering method
C
z1. After identification, these patches are used to estimate moments of the cluster for noise accountability( , I) 1
Ni i j j
and subsequently,
photometrically similar patches are identified based on neighborhood pixel weights. Further graphical similar patches are identified based on pheromone matrix ( )
( , ),( , )
(pn )
i j l m .
These estimated parameters are applied to OPSS filter to denoise an image.
Algorithm
Input : Noisy Image (Y) Output : Denoised image Ce
Step 1 : Set parameters like patch size n=11 x 11 and k=10 as number of clusters h2= 1.75σ2n
Step 2 : Standard deviation of noise σ to be estimated Step 3 : Ωk - Geometric clustering with k–means (L,K) and Compute LARK features (L) for each yi
Step 4 : For each Cluster Ωk do Step 4.1 : Initialize matrix Calculate center vectors Update vector for entire image
Estimate mean patch
z
ˆ
fromy
i0
k[See (7)];
1
ˆ
[
]
i k
i k y i
k
z
E y
y
M
Estimate cluster covariance
C
ˆ
z fromy
i0
k
International Journal of Innovative Technology and Exploring Engineering (IJITEE) ISSN: 2278-3075, Volume-8 Issue-12, October 2019
2
ˆ
[
ˆ
]
z y
C
C
I
Step 5 : For each Patch
y
i0
k do [see (3)];Step 5.1 : Identification of photometrically similar patches using NLM- DBUTM and computing its weights for
all
y
i0of
ijStep 5.2 : Weight Average [see (6)];
The pixel intensity value which holds minimum (0) or
maximum (255) is considered as noisy (corrupted pixel),
which is then processed and substituted by median value of
sub window 3X3.
Step 6 : For each Patch Ωi do [see (9)];
Step 6.1 : Identify graphically similar patches with ACO Initialize K as total ants position, τ (0) as pheromone matrix
for the ant index K = 1: k
Move the kth ant for L steps according to probabilistic
transition matrix P(n)
Update pheromone matrix τ(n)
Compute weights of patches graphically similar in nature
Calculate patches denoised
l,
(n 1)
, ,
(n)
(l,m),( , ) (n 1)
, ,
( , )
(T
) (
)
(T
) (
)
m
i j i j
i j
i j i j
i j
p
[see(12)];Step 7 : Denoised Image by aggregating multiple estimates for all types of similar Patches
C
e [see (13)];1 ( ) 1
( , ),( , ) , 1
(C
p
I)
i N n
e z i j l m i j
j
C
end
end
end
note : Equations and derivations given in Appendix A, B, C
and D.
IV. EXPERIMENTALANALYSISANDRESULT
Dataset: The proposed novel OPSS model has been tested on 61 standard images from the classical USC-SIPI and MATH WORK image databases. The USC-SIPI image database contains a group of digitized images divided into four volumes depending upon the characteristics of the images [9][10]. Testing was done for a miscellaneous volume consisting of 44 images and suited for the research work. The database images are available in three different sizes are 256x256, 512x512 and 1024x1024 pixels. All images in the database are in TIFF format. Remaining 17 standard test
images have been taken from the Math Work image database. All images in the database are in uncompressed tiff format and of the same 512 x 512 size [11][12].
To verify the performance of the proposed (OPSS) model is required to be carried out experiments on image database for verification. In the proposed (OPSS) model the noisy image is denoised based on photometrical, geometrical and graphical parameters using the similar patches[13][14]. The obtained results are compared with various existing methods using 8 bit gray scale image size 256 X 256 and 512 X 512 with Gaussian and Impulse noise. The results are collated and the analysis demonstrates that the proposed method is an improvement over the existing models for removing noise qualitatively and quantitatively.
Peak Signal-to-Noise Ratio (PSNR) is used in analogue systems as a consistent quality metric. In the Eq. (1), Mean Square Error (MSE) stands for the mean-squared error between two compared images and the PSNR equation is defined as follows[15][16][17].
PSNR=10 log10(2552/MSE) ...(1) The SSIM index is used in the Human Visual System (HVS) to measure similarity on the basis of three major factors: luminance, contrast and structure. The SSIM index is defined as follows.
SSIM(x,y)={(2 μx μy + C1 )(2 σx σy + C2)}/{( μx 2 μy2+ C1)( σx2 σy2 + C
2)} ...(2) where μx and μy, and σx and σy , denote the means and variances of the gradient for the patterns, x and y, respectively. The parameter, σxy, denotes the covariance of the gradient. The small constants {C1,C2,C3} are given as {(0.01L)2, (0.03L)2, C2/2 }, where L = 255.
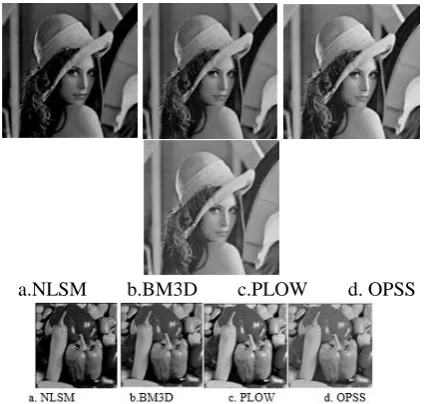
[image:3.595.318.550.474.835.2]a.NLSM b.BM3D c.PLOW d. OPSS
The numerical results derived from applying this algorithm on sample images are listed in subsequent table formats. The proposed method Peak Signal to Noise Ratio (PSNR), Structural Similarity Index Measure (SSIM) and Mean Square Error (MSE) values are compared against Non Local Sparse Model (NLSM), Block Matching 3D Filtering (BM3D), NLM-DBUTM and PLOW.
For enabling better image denoising, in the NLS model, similar patches in an image are shared using sub dictionary concept. The PLOW based image denoising method uses a high performance practical denoising algorithm, which is based on Wiener Filter approach on geometrical and photometrical similar patches to estimate the filter parameters to be used. The BM3D method adopts hybrid approach of grouping similar patches to perform collaborative filtering technique based on Discrete Cosine transform domain system.
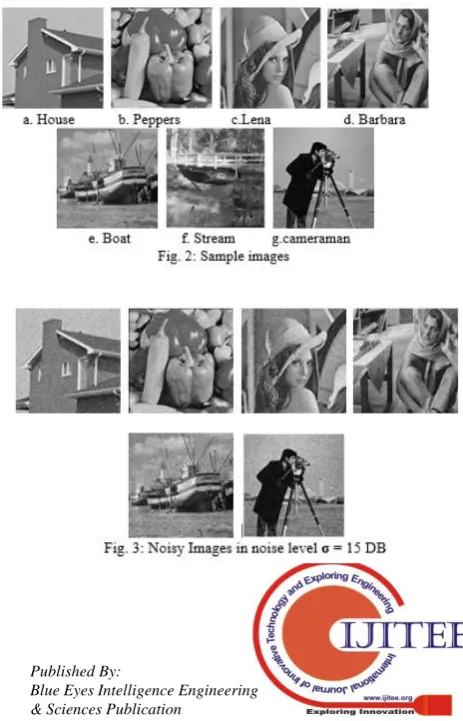
[image:4.595.58.277.53.250.2]Table -1 describes the value for benchmark image performance quantitatively across different images and the noise level based on different performance measures (PSNR, SSIM and MSE). Figure 3 shows noisy images at noise level σ = 15 dB and figure 4 shows denoised output images using (OPSS) the proposed method. Comparison of denoising results on noisy house, Pepper, Lena, Barbara, Boat, Stream and Camera man images corrupted by WGN of σ=25 shown in figure 5 to 10 (a to d). The PSNR performance in noise level σ = 5, 15 and 25 dB is graphically illustrated in Figure 11 to 16.
[image:4.595.63.277.287.489.2]TABLE 1 - Denoising Performance using Existing methods against Proposed Method for house image
[image:4.595.312.545.330.540.2]International Journal of Innovative Technology and Exploring Engineering (IJITEE) ISSN: 2278-3075, Volume-8 Issue-12, October 2019
Fig. 12: PSNR Comparison graph of Existing and proposed method for Pepper image.
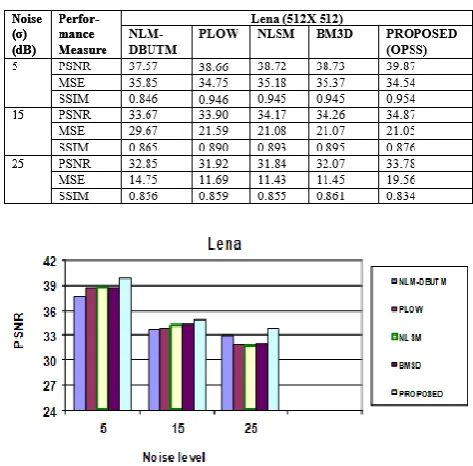
The denoising performance of the existing NLM-DBUTM, PLOW, NLSM and BM3D methods in comparison with OPSS has been tabulated (Table1). Individual image having different noise levels (σ) are represented in each table. The PSNR values, MSE and SSIM values for each varying noise decibel (σ=5, 15 and 25) are compared with different earlier models. When σ=5, 15 and 25 the proposed OPSS compared with NLSM, BM3D and PLOW respectively.
When applying the noise value σ=5, a better PSNR value has been obtained in comparison with the earlier models. For example, earlier NLSM model PSNR values 39.91 and 38.14 have been obtained for house and pepper image respectively.
Nevertheless, in the proposed OPSS, the PSNR value for the same images (house and pepper) is 41.24 and 39.34, which means the image has a higher resolution. The MSE value of earlier NLSM model for the same images (house and pepper), when noise level σ =5 is 42.35 and 76.37. The proposed OPSS model achieved MSE result is 39.86 and 70.98. The SSIM value is higher 0.965 and 0.932 for the house and pepper image when compared to the NLSM method.
While comparing with previous methods such as BM3D for the noise value σ=15, a better PSNR value has been obtained for the house and pepper image in the proposed OPSS. The existing BM3D method has 34.95 and 32.65 PSNR values respectively. On the other hand, the PSNR value for the proposed OPSS is 37.45 and 33.98 for the same images .The MSE value for the same images (σ = 15) is 36.37 and 64.02 in BM3D. The proposed method achieved 36.37 and 64.02. A higher SSIM value has been achieved, (0.912 and 0.898) when viewed against earlier models.
As observed in the table 1 for the noise value σ=25 for the image house and pepper. The PSNR value is much higher, when weighed against the earlier PLOW model. PLOW has 32.70 and 29.53 PSNR value. In the OPSS method, values 34.34 and 29.45 were achieved for the decibel value σ=25. The MSE value for PLOW is 20.39 and 50.13. The proposed method achieves MSE value of 20.13 and 50.78 respectively. For the same images the SSIM value 0.876 and 0.845 has been obtained.
[image:5.595.67.281.57.182.2]The other values are tabulated in Table 2 to 6 for peppers, Lena, Barbara, Boat and Stream. The values confirm that in the proposed algorithm the PSNR value increases, MSE decreases and SSIM values reaches the maximum approximate value 1.
TABLE 3 - Denoising Performance using Existing methods against Proposed Method for Lena image
[image:5.595.308.545.97.330.2][image:5.595.310.547.404.691.2]
Fig. 13: PSNR Comparison graph of Existing and proposed method for Lena image.
TABLE 4 - Denoising Performance using Existing methods against Proposed Method for Barbara image
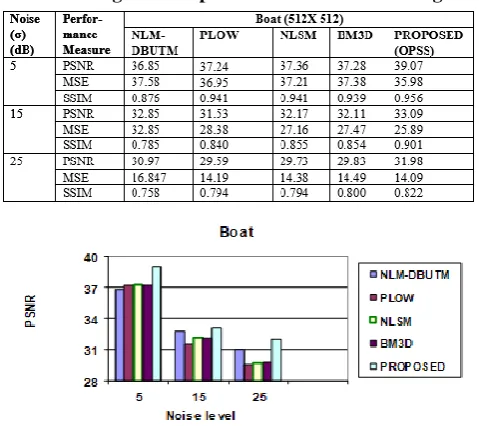
TABLE 5 - Denoising Performance using Existing methods against Proposed Method for Boat image
Fig. 15: PSNR Comparison graph of Existing and proposed method for Boat image.
TABLE 6 - Denoising Performance using Existing methods against Proposed Method for Stream image
Fig. 16: PSNR Comparison graph of Existing and proposed method for Stream image.
[image:6.595.305.547.78.245.2]From the above tables and figures, in the proposed method, it is evident that for the house image at noise level 5, highest PSNR value of 41.24 is achieved. This has been achieved by removing noise using three similarity patch based filters. Using this approach, for other images the PSNR value achieved is greater than the existing method. MSE value of the proposed method achieves the least value of 15.65 at a noise level of 10 dB and SSIM achieves highest value of 0.965 at noise level 5 dB for the house image.
TABLE 7 - Denoising Performance of PSNR for Proposed Method different sample image
Fig. 17: PSNR Comparison graph of proposed method for different images.
In terms of subjective visual quality, the OPSS model is comparable with NLM-DBUTM, PLOW, NLSM and BM3D, even outperforming them in many cases, where the images exhibit higher levels of redundancy due to considering graphical similarity. This can be observed in Figure 5 to 10, where results obtained using the OPSS filter is visually more pleasing in comparison with the earlier models.
[image:6.595.53.291.377.625.2]From the above tables 7 and figures 1, for the proposed method, it is evident to reached high PSNR value for the low noise level.
TABLE 8 - Denoising Performance of MSE for Proposed Method different sample image
Fig. 18: MSE Comparison graph of proposed method for different images.
[image:6.595.306.546.429.594.2]International Journal of Innovative Technology and Exploring Engineering (IJITEE) ISSN: 2278-3075, Volume-8 Issue-12, October 2019
Fig. 19: SSIM Comparison graph of proposed method for different images.
Limitations – This proposed optimized patch based self-similar algorithm is implemented using the Matlab programming language and configuration of PC with a Intel Core TM DUO 2.13 GHz CPU with 1 GB RAM. In terms of computational complexity, denoising a grayscale image size 256 x256 with a non-optimized implementation of OPSS takes approximately 85s of the execution time. Compare our method with existing PLOW takes on average 75s to denoise the same images.
V. CONCLUSION
The proposed Optimized Patch based Self Similar (OPSS) filter takes advantage of geometrically, photometrically and graphically similar patches for removing Gaussian and impulse noises from an image. The resultant approach has a statistical foundation while producing denoising results that are comparable and excels other methodologies, both visually and quantitatively. This approach is practical in nature and does not require any parameter tuning; it also has the additional advantage of unleashed statistical motivation. The OPSS model has primarily been developed to address and filter assorted noise in grayscale photographic images to enhance image quality. It is further envisaged that the performance of this model was improved by taking into account the correlation across graphically similar patches by using Ant Colony Optimization. Future work of this paper by deploying parallel processing, the algorithm can be speeded up further to reduce the processing time.
APPENDIX A
DERIVATION OF EXPRESSION FOR ESTIMATING
PHOTOMETRIC SIMILAR PATCHES WEIGHT AVERAGE USING NLM-DBUTM
Non Local Means (NLM) algorithm works on the basis of weighted average technique to decide the pixel values in matrix form rather than the consideration of the neighborhood pixels to create new matrix. Here, the updates are not by the average weight of pixels around it, but by the weighted average of pixels that are most similar. Further, the weight of each pixel is dependent on the distance between its intensity grey level vectors and that of the target pixel that helps in the identification of patches within the noisy, photometrically similar image in a given reference patch[18][19][20].
In the noisy image υ={(υ(i)| i
I), the estimated value NL(υ)(i), for a pixel i is computed as a weighted average of all the pixels in the image,[ ]( )
( , ) ( )
j I
NL
i
i j
j
(3)
( , )
i j
j
Weights depend on the similarity between the pixels i and j, under given condition0
( , ) 1
i j
and j( , ) 1
i j
(4) The similarity between two pixels i and j depends on the similarity of the intensity gray level vectors υ(Ni) and υ(Nj), the weight defined as
[image:7.595.55.284.51.174.2]2 2, 2 || (N ) (N )||
1
( , )
( )
i j a
h
i j
e
z i
(5) Where Z(i) is the normalizing constant „h‟ act as a degree of filtering h2= 1.75σ2n. It controls the decay of the exponential function and decay of the weights as a function of the Euclidean distances. The above equation written as,
2
2
2
1
h y y
wij
exp
i j , (6)Where, reference patch is denoted as Yi and the identical condition patches are defined as Y1….Yn.
Fig. 20 Similar neighborhoods comparison Figure 20 shows that the similar pixel neighborhoods yield a large weight, w(p,q1) and w(p,q2), while much different neighborhoods accord a small weight w(p,q3), the pixel q3 has the same grey level value of pixel p, but the neighborhoods are much different and the weight w(p,q3) is nearly zero. Then corrupted pixels are processed in DBUTM which initially detects impulse in images and corrects them accordingly. The pixels of an image have associated intensity values ranging from 0 to 255. The pixel intensity value which holds minimum (0) or maximum (255) is considered as noisy (corrupted pixel), which is then processed and substituted by median value of window [11].
APPENDIX B
DERIVATION OF EXPRESSION FOR ESTIMATING CLUSTER
1
ˆ
[
]
i k
i k y i
k
z
E y
y
M
(7)Where
k denotes the kth cluster cardinality Mk. Covariancematrix Cz is also estimated from the noisy patches within the cluster.
2
ˆ
[
ˆ
]
z y
C
C
I
(8)ˆ
[
C
y]
denotes sample covariance, σ2 represents noisecovariance.
The parameter estimated from each cluster of the image can be directly used for denoising in aggregate multiple pixel estimates step.
APPENDIX C
DERIVATION OF EXPRESSION FOR ESTIMATING THE
GRAPHICAL SIMILARIT GRADIENT USING ACO
ACO technique is inspired by behaviors of ants and is considered to be the most successful technique. This technique proffers the best possible solution through a guided search iteratively (the movement of a number of ants) over the solution space, by constructing the pheromone information. The movement of artificial ants is determined by the local texture features and the global pheromone distribution on the image of abundant artificial ants identifying the gradient edge pixels [12, 13]. To find the graphical similarity, the kth ant moves from the node i to the node j (pixel) according to a probabilistic action rule, which is determined by
(n 1)
, ,
(n)
, (n 1)
, ,
(T
) (
)
(T
) (
)
i
i j i j i j
i j i j j
p
, ifj
i(9)
Where
T
i j(n 1), pheromone information value of the arc linking the node i to the node j, (α, β) denote influenced of pheromone information and heuristics information respectively.
iis the neighborhood nodes on the node iand
i j, represents the heuristics information from node i tothe node j, which is fixed to be same for each graph construction step.
, ,
1
(I )
i j
V
c i jz
(10)1 2
, 1: 1:
(I )
c i j i M j M
Z
V
is a normalization factor,, 2, 1 2, 1 2, 1 2, 1 1, 2 1, 2
1, 1 1, 1 1, 1, 1, 1 1, 1
1, 2 1, 2 i, 1 , 1
( ) f(| I I | | I I | | I I |
| I I | | I I | | I I |
| I I | | I I |)
c i j i j i j i j i j i j i j
i j i j i j i j i j i j
i j i j j i j
V I
(11)
[image:8.595.374.479.48.155.2]Where Vc(Ii,,j) represent variation of image‟s intensity values, shown in the following graph (Fig. 21)
Fig. 21: Neighborhood pixels ( i, j)
ACO technique is based on four processes namely initialization, construction, updation and decision process. These processes help to find graphical similar nodes, which are connected towards preserving edges of the image. The initialization process paves the way to ascertain the optimal solution through the iterative search that is the movements of a number of ants over the solution space, by constructing the pheromone information. To explain it better, K ants are deployed to find the optimal solution consisting of M1 × M2 nodes. At the nth construction step, one ant is arbitrarily selected from the K ants, which is made to move consecutively on the image for L movement. It moves from the node (l,m) to its neighboring node (i,j) according to a transition probability that is defined as
l, (n 1)
, ,
(n)
(l,m),( , ) (n 1)
, ,
( , )
(T
) (
)
(T
) (
)
m
i j i j i j
i j i j i j
p
(12) Two steps are carried out for updating the pheromone matrix. The first update is performed after the movement of each ant within each construction step. Each component of the pheromone matrix is updated according to given equation 11.(n 1) ( )
(1 )T . , ( , ) is visited by the current K position ant.
(n 1) , ,
T,
(n 1)
T, ,
{
i j i jk if i ji j otherwise i j (13)
Where ρ is defined as evaporation rate is 0.1, ( )i j,k is determined by the heuristic matrix that is, ( )i j,k = ηi,j. The second update is carried out after the movement of all ants within each construction step according to equation 12.
( ) 1 (0)
(1
).
.
n n
T
T
T
(14) In the decision (binary decision) process, a threshold T is applied on the final pheromone matrix τ(n) in order to determine whether each pixel is graphically similar (edge) or not.
is pheromone decay coefficient andT
(0) represent initial value of each component of the pheromone matrix.APPENDIX D
DERIVATION OF EXPRESSION FOR ESTIMATING
AGGREGATION OF PIXEL
All estimated parameters derived based on above aggregation of patch similarity technique are used to perform OPSS filtering process. This filter runs on a per-patch basis (because parameters are estimated from multiple patches), yielding denoised estimates for
International Journal of Innovative Technology and Exploring Engineering (IJITEE) ISSN: 2278-3075, Volume-8 Issue-12, October 2019
Author-1 Photo
Author-2 Photo are chosen to overlap each other. An aggregation of the
multiple estimates is required in order to arrive at the denoised image.
The covariance of OPSS is approximated by,
1 ( ) 1
( , ),( , ) , 1
(C
p
I)
i N n
e z i j l m i j
j
C
(15)REFERENCES
1. Chui Mingwei, Youqian Feng, Wei Wang, Zhengchao Li and Xiaodong Xu, "Image Denoising Method with Adaptive Bayes Threshold in on sub sampled Contourlet Domain", AASRI Procedia. AASRI Conference on Computational Intelligence and Bioinformatics, Volume1, 2012, Pages 512–518, 2012
2. doi:10.1016/j.aasri.2012.06.080.
3. P. Chatterjee and P. Milanfar, "Patch-Based Near- Optimal Image Denoising", IEEE Transactions on Image Processing, vol 21, No. 4, P.g:1635-1649, 2012.
4. ISSN:1057-7149, DOI:10.1109/TIP.2011.2172799.
5. P. Chatterjee and P. Milanfar, "Clustering-Based Denoising With Locally Learned Dictionaries", IEEE Transactions on Image Processing, vol. 18, no. 7, pp. 1438-1451. 2009. ISSN: 1057-7149, DOI: 10.1109/TIP.2009.2018575.
6. Priyam Chatterjee, "Patch-based locally optimal denoising", 18th IEEE International Conference on Image Processing. Page(s):2553 – 2556, 2011. ISSN :1522-4880, DOI:10.1109/ICIP.2011.6116184 7. Yifei Lou, Paolo Favaro, Stefano Soatto and L. Andrea Bertozzi,
“Nonlocal Similarity Image Filtering,” In Proceedings of the International Conference on Image Analysis and Processing (ICIAP).
Pages pp 62-71, 2009. DOI: 10.1007/978-3-642-04146-4_9. 8. Jing Tian and Li Chen, "Image Noise Estimation using a variation –
Adaptive Evolutionary Approach", IEEE Signal Processing Letters,
Vol 19. No7, Page(s):395–398, 2012. ISSN :1070-9908, DOI: 10.1109/LSP.2012.2197200.
9. C. Angelino, E. Debreuve and M. Barlaud, “Patch confidence k-nearest neighbors denoising,” in Proc. IEEE Conf. Image Process.,
Hong Kong, pp. 1129–1132, 2010. ISSN: 1522-4880, DOI: 10.1109/ICIP.2010.5651316.
10. S. Esakkirajan, T. Veerakumar, N. Adabala, Subramanyam and C.H. PremChand, “Removal of High Density Salt and Pepper Noise through Modified decision Based Unsymmetric Trimmed Median Filter,”
IEEE SIGNAL PROCESSING LETTERS, VOL.18, NO. 5. Page(s):287 – 290, 2011. ISSN: 1070-9908, DOI: 10.1109/LSP.2011.2122333. 11. http://sipi.usc.edu/database/
12. http://imageprocessingplace.com/root_files_V3/image_databases.htm l
13. A.Gayathri, A.Srinivasan, “An Efficient algorithm for image denoising using NLM and DBUTM estimation“ IEEE Region 10 Annual International Conference Proceedings /TENCON, United States.
Page(s):1 – 6, 2015. ISSN: 2159-3442, DOI:
10.1109/TENCON.2014.7022388, Institute of Electrical and Electronics Engineers.
14. Jing Tian, "An ant colony optimization algorithm for image edge detection", IEEE Congress on Evolutionary Computation,
Page(s):751–756, 2008. Print ISBN:978-1-4244-1822-0, DOI:10.1109/CEC.2008.4630880
15. Peng Xiao, Jun Li, and Jian-Ping Li., "An improved ant colony optimization algorithm for image extracting", The 2010 International Conference on Apperceiving Computing and Intelligence Analysis Proceeding. Page(s):248 – 252, 2010. DOI:10.1109/ICACIA.2010.5709894.
16. P. M. J. Chan and M. Mohammadali, “Forecasting East Asian Indices Futures via a Novel Hybrid of Wavelet-PCA Denoising and Artificial Neural Network Models,” Plos One, vol. 11, no. 6, Article ID e0156338, 29 pages, 2016.
17. P. Jain and V. Tyagi, “An adaptive edge-preserving image denoising technique using patch-based weighted-SVD filtering in wavelet domain,” Multimedia Tools and Applications, vol. 76, no. 2, pp. 1659–1679, 2017.
18. Jia Li, Chenyan Bai, "Automatic Design of High-Sensitivity Color Filter Arrays with Panchromatic Pixels" in IEEE Transactions on Image Processing, 2017
19. Z. Zha, X. Liu, X. Huang, X. Hong, H. Shi, Y. Xu, Q. Wang, L. Tang, and X. Zhang, “Analyzing the group sparsity based on the rank minimization methods,” arXiv preprint arXiv:1611.08983, 2016
20. A.Gayathri,” Photometrical and Geometrical Similar Patch Based Image Denoising Using Wavelet Decomposition” Journal of Medical and Bioengineering Vol. 4, No. 1, February 2015
21. A.Gayathri, “Wavelet Based Self Learning Adaptive Dictionary Algorithm for Image Denoising” Advances in Natural and Applied Science, 9 (9), 7-17, 2015.
22. A.Gayathri, “Moving Object Detection by Fuzzy Aggregation Using Low Rank Weightage Representation”, Springer AISC Book Series- Advances in Intelligent System and computing, Vol.2, PP-335-342, Nov 2014.
AUTHORSPROFILE
Dr.A.Gayathri, received the B.E degree in Electronics and Communication Engineering from Periyar Maniammai College of Technology for Women (Bharathidasan University, India) in 2001 and the M.Tech (CSE) degree in Computer Science and Engineering specialization from Bharath University, Chennai, India in 2005. She completed the Doctorate in the Department of Information and Communication Engineering at Anna University. She is currently working as Associate Professor in Saveetha School of Engineering (Department of CSE), SIMATS, Chennai, and Tamil Nadu. She is the member of CSI, IAENG and ACM.