International Journal of Innovative Technology and Exploring Engineering (IJITEE) ISSN: 2278-3075, Volume-8 Issue-12, October 2019
Abstract: In this proposed work, Natural Rubber (NR) and Ethylene Propylene Diene Monomer (EPDM) are blended using Graphical method in 50:50 ratio. The blends are characterized by electrical characteristics like surface resistivity, arc resistance and mechanical properties such as comparative tracking index, elongation at break and tensile strength as per standard ASTM and IEC. Graphical method type of blending overcomes the drawback of Optimal Blend Ratio (OBR) which gives an approximate solution. The composite blended gives good electrical, mechanical characteristics with good weathering resistance.
Keywords : Polymeric insulator; Blend composition; Ethylene Propylene Diene Monomer; Natural Rubber.
I. INTRODUCTION
P
olymeric materials have outstanding chemical, physical, mechanical and electrical properties compared with ceramic and glass insulator, hence used in medium/high voltage cable insulation and jacket materials. The electrical and mechanical characteristics of NR and EPDM can be improved by blending two materials in proper ratio [1-4]. EPDM exhibits a saturated polymer back bone structure which results in stable, heat resistance, oxidation resistance, weather ageing, high tensile strength and oil swell resistance properties. Infrared (IR) spectral analysis reveals bonding capability of blends [5].The effect of NR/EPDM blend ratio to improvise electrical and mechanical characteristics is investigated using conventional methods and graphical method. The conventional method gives only approximate solution so there is need for optimization technique. The identification of suitable blend ratio depends upon the applications, such as high tensile strength, high dielectric strength and arc resistance. In practical situations it is difficult to identify the suitable blend ratio for specific application. Optimal blend must provide good mechanical and electrical characteristics. The electrical and mechanical characteristics are tested using suitable experiments and plotted using graphical method for
Revised Manuscript Received on October 05, 2019.
* Correspondence Author
Kannayeram G*, EEE Department, National Engineering College,
Kovilpatti, Tamilnadu, India. Email: [email protected]
Megala V, EEE Department, SRM Institute of Science and Technology,
Ramapuram, Chennai, Tamilnadu, India, Email: [email protected]
Prakash NB, EEE Department, National Engineering College,
Kovilpatti, Tamilnadu, India. Email: [email protected]
Muniraj R, EEE Department, National Engineering College, Kovilpatti,
Tamilnadu, India. Email: [email protected]
Sundar B, EEE Department, National Engineering College, Kovilpatti,
Tamilnadu, India. Email: [email protected]
cable applications [6]. Several computational techniques like Particle Swarm Optimization (PSO), Genetic Algorithm (GA) and Improved PSO (IPSO) are used to solve the complex engineering problems. In our future work PSO is used to identify the suitable blend ratio for cable applications [7,8]. PSO has population based evolutionary algorithm with simple concepts, high computation efficiency and easy to implement compared to other algorithm. PSO is initialized with population of random variable. It is associated with random velocity and potential solution called particles. Particles are flown through problem space. In PSO any weightage is assigned randomly to any particular parameter such as electrical/mechanical or both. PSO is implemented for two different sets. One set has equal weightage of key parameters i.e. one electrical & one mechanical and another set consists of unequal weightage of key parameters [9, 10]
II. SYNTHESISOFNR/EPDMBLEND NR and EPDM material were purchased from M/S Joy Rubbers, India. NR is of RNA type. EPDM is in the ratio of 52:48 of ethylene: propylene. Blending is the technology of converting the raw rubber resin into useful materials through the addition of various ingredients [11]. The preparation of NR/EPDM blends were carried out in two roll mixing mill dispersion kneader machine with chamber temperature at 35°C.
Conventional mixing procedures are used for preparation of these blend materials. At initial condition NR is masticate for 3 minutes followed by moulding in electrically headed plate machine for 5 minutes. The compounds are moulded by compression at 70°C using hydraulic hot press machine. Sheet specimens are made by zeon blend compositions hot press machine as listed in Table-I.
Table- I: Sheet Specimens blended compositions
MATERIALS (phr)
Blend 1
Blend 2
Blend 3
Blend 4
Blend 5
NR (%) 100 70 50 30 0
EPDM (%) 0 30 50 70 100
Dicumyl per oxide 2.5 2.5 2.5 2.5 2.5
ZnO 5 5 5 5 5
Stearic acid 2 2 2 2 2
MBT 0.5 0.5 0.5 0.5 0.5
TMTD 1.5 1.5 1.5 1.5 1.5
Sulphur 1.75 1.75 1.75 1.75 1.75
Assessment of NR/EPDM Blend Ratio using
Graphical Method
The commercial graded chemicals like Stearic acid, Zincoxide (ZnO), Sulphur, Mecapto Benzo Tiazole (MBT), Tetra Methyl Thiuram Disulphide (TMTD) were used as additives to increase vulcanization rate by activating the accelerators. The weightage of additives are expressed in parts per hundred (phr) of rubber shown in Table-I.
III. EXPERIMENTATIONAND
CHARACTERIZATIONOFNR/EPDM
The test conditions and procedures for the electrical and mechanical characteristics of the polymers used are explained below.
A. Tensile Strength and Elongation at Break (EB) The tensile strength and Elongation at break are determined as per standard ASTM D412. Tensile strength is obtained from the cross head movement at constant rate using universal testing machine. EPDM elastomer possesses good mechanical strength and outstanding resistance to attack by oxygen, ozone and weather [12].
B. Arc Resistance
Arc resistance is measured in seconds as per standard ASTM D495. A voltage of 12.5 kV is applied to the sample, whose size is 5 x 5 x 0.3cm. Voltage is increased gradually in steps until the arc occurs between the electrodes. The carbon path developed on the surface of the material leads to conduction.
C. Surface and Volume Resistivity
The surface and volume resistivity of the samples are measured as per standards IEC 60093 and ASTM D257 respectively using Million Mega Ohm meter MM-108D by prestige electronics. The thickness and diameter of the specimen are 3mm and 100 mm respectively. A DC supply of 500V is applied for 60 seconds at room temperature between main and guarded electrode to determine surface and volume resistivity.
D. Comparative Tracking Index (CTI)
CTI is measured as per standards IEC 60112 by CEAST meter. A 500V is applied to the test specimen of 3mm thickness. Ammonium chloride is used as electrolyte. The solution of ammonium chloride drops are made to fall between the electrodes at 30seconds interval. The voltage corresponding to 50 drops is noted and the corresponding numerical value of voltage is called as comparative tracking index (CTI). The voltage is applied in the range of 150-600V to the samples.
E. Dielectric Strength
Dielectric strength of sample is measured as per the standards IEC 60243-1 and ASTM D149. A sample of diameter 100mm and thickness 1mm is placed between the electrodes and the voltage applied is gradually increased at constant rate of 2kV/s till dielectric breakdown occurs. The voltage at which breakdown occurs is noted as dielectric breakdown voltage. Dielectric breakdown strength is calculated from the ratio of dielectric breakdown voltage to the thickness of the specimen.
IV. RESULTSANDDISCUSSION
The electrical & mechanical parameters of the blend are measured as per given standards and comparison was done to obtain the suitable blend ratio. The characterization is done thorough Graphical method. As one of high voltage insulation
applications, EPDM applied to a polymer housing arrestor, cables, insulating sleeving and tapes, potting and encapsulating purposes[13-17].
In graphical method point of intersection gives approximate blend ratio for the specific application. Disadvantage of graphical method is identification of exact optimal blend from the various blend ratios. Optimal blend ratio is predicted by varying the number of parameters [17-20].
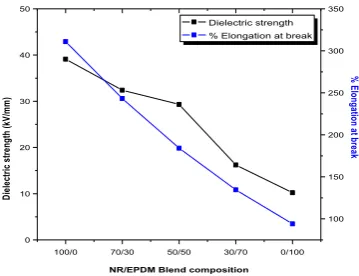
A. Results and Discussion on Dielectric Strength The dielectric strength of different blend ratios are compared with tensile strength of different blend ratios and the comparison shows the impact of natural rubber in the blends. The Fig.1 shows the proportion of natural rubber is increased then the dielectric strength is also increased in the blends. The % decrease in dielectric strength is given as 50% of EPDM = (39.1-29.3) /39.1 × 100 % = 25.06. The % increase in tensile strength is given as 50% of EPDM = (4.58-2.25) /2.25 × 100 % = 103.5.
From the Fig.1, 50:50 blend ratio of NR/ EPDM is the best composition for the specific application and it is obtained by intersection between the curves. For above equations 50:50 blend ratio is reduced by 25% and tensile strength is improved by 103%. In Fig.2 the relationship between dielectric strength and percentage elongation at break are plotted. If the content of EPDM increases then the dielectric strength decreases, with increase in % EB.
100/0 70/30 50/50 30/70 0/100
0 10 20 30 40 50
Dielectric Strength Tensile Strength
NR/EPBM Blend composition
D
ie
le
ct
ric
S
tr
en
gt
h(
kV
/m
m
)
2 3 4 5 6 7
Te
ns
ile
S
tre
ng
th
(N
/m
m
2
[image:2.595.344.525.404.541.2])
Fig. 1.Effect of Blend Composition on Dielectric Strenght and Tensile Strength.
100/0 70/30 50/50 30/70 0/100
0 10 20 30 40 50
Dielectric strength % Elongation at break
NR/EPDM Blend composition
D
ie
le
ct
ric
s
tr
en
gt
h
(k
V/
m
m
)
100 150 200 250 300 350
%
E
lo
ng
ati
on
at
b
re
ak
[image:2.595.341.521.588.726.2]International Journal of Innovative Technology and Exploring Engineering (IJITEE) ISSN: 2278-3075, Volume-8 Issue-12, October 2019
B. Results and Discussion on Arc Resistance
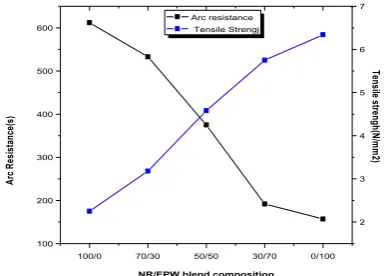
In Fig.3 the effect of blend composition on arc resistance and tensile strength is shown. EPDM is hydro carbon in nature, it increases the resistance towards electric arc when EPDM content is low [4]. The % decrease in arc resistance is given as 50% of EPDM = (612-375) /612 × 100 % = 38.7. From the above calculations, arc resistance for 50:50 blend of NR/EPDM is decreased by 39% and tensile strength is increased by 103%. The intersection point gives better dielectric strength and tensile strength.
100/0 70/30 50/50 30/70 0/100
100 200 300 400 500 600 Arc resistance Tensile Strengj
NR/EPW blend composition
[image:3.595.320.530.68.217.2]A rc R es is ta nc e( s) 2 3 4 5 6 7 Te ns ile st re ng h(N /m m 2)
Fig. 3.Effect of Blend Composition on Arc Resistance and Tensile Strength.
100/0 70/30 50/50 30/70 0/100
100 200 300 400 500
600 Arc Resistance
% Elongation
NR/EPDM Blend Composition
[image:3.595.64.258.187.325.2]A rc R es is ta nc e( s) 100 150 200 250 300 350 % E lo ng ati on at b re ak
Fig. 4.Effect of Blend Composition on Arc Resistance and %EB.
The Fig.4 shows the effect of blend composition on arc resistance and % EB. The increasing EPDM content decreases the % EB and increases the arc resistance.
C. Results and Discussion on Volume and Surface Resistivity
The Fig.5 and Fig.6 show the effect of blend composition on volume and surface resistivity with respect to tensile strength. If NR content is increased, it increases the volume and surface resistivity of the material. It is obtain clearly above 70 weight percentage of NR in the blend. Tensile strength is decreased when the NR content is increased in the blend. 50:50 blend ratio of NR &EPDM gives higher volume and surface resistivity.
100/0 70/30 50/50 30/70 0/100
-2.0x10¹⁵ 0.0 2.0x10¹⁵ 4.0x10¹⁵ 6.0x10¹⁵ 8.0x10¹⁵ 1.0x10¹⁶ 1.2x10¹⁶
1.4x10¹⁶ Surface Resistivity
Tensile strength
NR/EPDM Blend Composition
Su rf ac e R es is tiv ity (o hm ) -1 0 1 2 3 4 5 6 7 Te ns ile S tre ng th ( N /m m 2 )
Fig. 5.Effect of Blend Composition on Surface Resistivity and Tensile Strength.
100/0 70/30 50/50 30/70 0/100
-1x10¹⁵ 0 1x10¹⁵ 2x10¹⁵ 3x10¹⁵ 4x10¹⁵ 5x10¹⁵ 6x10¹⁵
7x10¹⁵ Volume Resistivity
Tensile Sterngth
NR/EPDM Blend Composition
[image:3.595.313.525.269.419.2]Vo lu m e R es is tiv ity (o hm -m ) 2 3 4 5 6 7 Te ns ile S tre ng th (N /m m 2 )
Fig. 6.Effect of Blend Composition on Volume Resistivity and Tensile Strength.
100/0 70/30 50/50 30/70 0/100
0 25 50 75 100 125 150 175 200 225 250 275 300 325 Elongation Break Volume Resitivity Surface Resistivity
NR/EPDM Blend Composition
% E lo ng at io n br ea k 0.0 2.0x10¹⁵ 4.0x10¹⁵ 6.0x10¹⁵ 8.0x10¹⁵ 1.0x10¹⁶ 1.2x10¹⁶ 1.4x10¹⁶ Vo lu m e R es ist ivit y ( O hm -m ) Su rfa ce R es ist ivit y ( O hm )
Fig. 7.Effect of Blend Composition on Volume Resistivity and Tensile Strength.
From the Fig.7, the decreasing content of EPDM decreases % EB. The surface &volume increases with decreasing of EPDM content.
D. Results and Discussion on Comparative Tracking Index
From Fig.8, tensile strength increases with increasing EPDM content. The values of CTI are obtained from the figure 8. If the CTI increases due
[image:3.595.84.278.374.515.2] [image:3.595.320.539.467.626.2]optimal blend. The % decrease in CTI is given by 50% of EPDM = (551-490) /551 × 100 % = 10. From the above calculation, the CTI for 50:50 NR and EPDM blends is reduced by 10% and the tensile strength of the blend is improved by 103%.
100/0 70/30 50/50 30/70 0/100
400 420 440 460 480 500 520 540
560 CIT
Tensile Strength
NR/EPDM Blend Composition
C
TI
V
ol
ts
2 3 4 5 6 7
Te
ns
ile
S
tre
ng
th
(N
/m
m
2
[image:4.595.73.273.139.301.2])
Fig. 8.Effect of Blend Composition on Comparative Tracking Index and Tensile Strength.
V. CONCLUSION
The mechanical properties are increased by increasing EPDM content. NR/EPDM composition gives better mechanical strength and has less effect on electrical properties. The electrical properties are increased by increasing NR content in the blend composition. Adding of EPDM to NR increases the mechanical properties by 103 %. The 50:50 blend ratios of NR and EPDM gives better electrical and mechanical characteristics using graphical methods. The intersection point gives approximate optimal solution. The changes in insulation characteristics of 50:50 blend ratio of NR/ EPDM by taking reference from 100% NR
The tensile strength is increased by 103.5%.
The dielectric strength is reduced by 25%
The arc resistance is reduced by 39%.
The comparative tracking index is reduced by 10%.
ACKNOWLEDGMENT
The authors would like to thank the Management, Director, Principal, Head of EEE Department, High Voltage Program Coordinator and EEE Department Colleagues of National Engineering College for permitting us to carry out this work and for providing suggestions and guidance for the successful completion.
REFERENCES
1. R.Deepalaxmi, M.Balaji and V.Rajini,(2013), “Particle swarm optimization based selection of Optimal polymeric blend”, IEEE Transactions on Dielectrics and Electrical Insulation Vol. 20, No. 3, pp. 922-930.
2. K. S. Suh, S. K. Park, C. H. Lee, S. W. Kim and S. O. Han, "Space charge distributions in EPDM compounds," in IEEE Transactions on Dielectrics and Electrical Insulation, vol. 4, no. 6, pp. 725-731, Dec. 1997.
3. W. Arayapranee and G.L. Rempel,(2007), “Properties of NR/EPDM Blends with or without Methyl Methacrylate-Butadiene-Styrene
(MBS) as Compatibilizer”, International journal of Materials Structural Reliability, Vol.5, No.1, pp.1-12.
4. R.RajaPrabhu, S.Usa and K.Udhyakumar, “Electrical Insulation Characteristics of Silicone and EPDM blends”, IEEE transaction on Dielectrics and Electrical insulation, Vol.14,No.5, pp. 1207-1214, 2007.
5. P.D. Blackmore, D. Birtwhistle, G.A. Cash and G.A. George, (1998 ), “Condition assessment of EPDM Composite insulators using FTIR Spectroscopy”, IEEE transaction on Dielectrics and Electrical insulation , Vol. 6, No. 5, pp.132-141.
6. M. Ehsani , H. Borsi , E. Gockenbach ,G. R. Bakhshandeh I, J. Morshedian I, N. Abed ( 2004 ), “Study of Electrical, Dynamic Mechanical and Surface Properties of Silicone-EPDM Blends’’ International Conference on Solid Dielectrics, Toi, louse, France. 7. R. Eberhart and J. Kennedy, (1995), “A new optimizer using particle
swarm theory”, IEEE 6th International. Symposia. Micro Machine and Human Science”, Japan, pp. 39-43.
8. Ioan,Cristian,Trelea,(2003), “The particle swarm optimization algorithm: convergence analysis and parameter selection”, Information Processing Letters 85 Elsevier Science, page no: 317–325.
9. V.P. Sakthivel, R. Bhuvaneswari and S. Subramanian,( 2010), “An Improved Particle Swarm Optimization for Induction Motor Parameter Determination”, International Journal of Computer Applications., Vol. 1, No. 2, pp. 62-67.
10.C. Ou and W. Lin, (2006), “Comparison between PSO and GA for Parameters Optimization of PID Controller”, IEEE International Conference on Automation, Luoyang, China, pp. 2471-2475. 11.M. Brown, "Compounding of ethylene-propylene polymers for
electrical applications," in IEEE Electrical Insulation Magazine, vol. 10, no. 1, pp. 16-22, Jan.-Feb. 1994.
12.R. R. Prabu, S. Usa, K. Udayakumar, M. A. Khan and S. S. M. A. Majeed, "Electrical Insulation Characteristics of Silicone and EPDM Polymeric Blends. I," in IEEE Transactions on Dielectrics and Electrical Insulation, vol. 14, no. 5, pp. 1207-1214, October 2007. 13.Y. Kurata, "Evaluation of EPDM rubber for high voltage
insulators", IEEE. Conf. Electr. Insul. Dielectr. Phenomena (CEIDP), pp. 471-474, 1995.
14.J. E. Davis, D. E. W. Rees, "Silicone Rubbers, Their Present Place in Electrical Insulation", Proc. IEE, vol. 112, pp. 1607-1613, 1965. 15.M. Ehsani, H. Borsi, E. Gockenbach, G. R. Bakhsahnde, J.
Morshedian and N. Abedi, "Study of electrical, dynamic mechanical and surface properties of silicone-EPDM lends," Proceedings of the 2004 IEEE International Conference on Solid Dielectrics, 2004. ICSD 2004., Toulouse, France, 2004, pp. 431-434,Vol.1.
16.M. Ehsani, H. Borsi, E. Gockenbach, G. R. Bakhshandeh and J. Morshedian, "Improvement of electrical, mechanical and surface properties of silicone insulators," The 17th Annual Meeting of the IEEE Lasers and Electro-Optics Society, 2004. LEOS 2004., Boulder, CO, USA, 2004, pp. 623-626.
17.R. R. Prabu, S. Usa, K. Udayakumar, M. A. Khan and S. S. M. A. Majeed, "Theoretical correlations amongst electrical and mechanical characteristics of polymeric housing materials for outdoor insulators," in IEEE Transactions on Dielectrics and Electrical Insulation, vol. 15, no. 3, pp. 771-782, June 2008.
18.G. A. Vignaux Dimensional Analysis in Data Modelling Kluwer Academic Publishers 1992.
19.E. Q. Isaacson M. Q. Isaacson Dimensional Methods in Engineering and Physics Edward Arnold 1975.
AUTHORSPROFILE
Kannayeram G is working as Assistant Professor
International Journal of Innovative Technology and Exploring Engineering (IJITEE) ISSN: 2278-3075, Volume-8 Issue-12, October 2019
He has 19 years of teaching and 2 years of industry experience and his interested research areas are FACTS controller tuning, Power system stability, High voltage Engineering and Smart Grids.
Megala V received her B.E degree in Electrical
and Electronics Engineering from Bharathiyar University, India in 2002 and M.E Degree in Applied Electronics from Government College of Technology, India in 2004. She has 13 years of teaching experience in Engineering College. She is currently working in Electrical and Electronics Engineering Department, SRM Institute of Science and Technology, Chennai, India. She is a life member of ISTE. Her current research interests include corona discharges, Electromagnetic Interference and Applications of Nano-technology.
Prakash NB received B.E Degree in Electrical
and Electronics Engineering Department and M.E (Applied Electronics) Degree in Electronics and Communication Engineering Department from Madurai Kamaraj University, Madurai by the year 2000 and 2002. He received his Ph.D Degree under the Faculty of Information and Communication Engineering (Research area: Medical Image Processing) from Anna University, Chennai by June 2018. He has more than 17 years of teaching experience and has published many papers in the reputed national and international journals and conferences. His area of specialization includes medical image processing, pollution performance analysis in insulators and bushings, embedded systems and power system engineering. He is also an approved research supervisor under the faculty of Information and Communication Engineering of Anna University, Chennai bearing AU New Reference Number: 3340036 (S.No.763). He is also a peer reviewer in Elsevier, Springer, SCOPUS and SCI indexed international journals.
Muniraj R received B.E Degree in Electrical and
Electronics Engineering Department from Madurai Kamaraj University, Madurai by the year 2004 and M.E (Control and Instrumentation) Degree in Electrical and Electronics Engineering Department from Anna University, Chennai by June 2006.He received his Ph.D Degree under the Faculty of Electrical Engineering (Research area: Control and Instrumentation Engineering) from Anna University, Chennai by April 2019. He has more than 13 years of teaching experience and has published many papers in the reputed national and international journals and conferences. His area of specialization includes PID Controller tuning, Control and Automation systems, power system engineering. Intelligent Control Algorithms and Instrumentation Engineering.
Sundar B received B.E Degree in Electrical and