Evaluating Long Range Reordering
with Permutation-Forests
Milos’ Stanojevic’ and Khalil Sima’an Institute for Logic, Language and Computation
[email protected]; [email protected]
December 4, 2013
Automatically evaluating the quality of word order of MT systems is challenging yet crucial for MT evaluation. Existing approaches em-ploy string-based metrics, which are computed over the permutations of word positions in system output relative to a reference transla-tion. We introduce a new metric computed overPermutation Forests (PEFs), tree-based representations that decompose permutations re-cursively. Relative to string-based metrics, PEFs offer advantages for evaluating long range reordering. We compare the present PEFs metric against five known reordering metrics on WMT13 data for ten language pairs. The PEFs metric shows better correlation with human ranking than the other metrics almost on all language pairs. None of the other metrics exhibits as stable behavior across language pairs.
1
Introduction
Evaluating word order (also reordering) in MT is one of the main ingredients in automatic MT evaluation, e.g., [Papineni et al., 2002, Denkowski and Lavie, 2011]. To monitor progress on evaluating reordering, recent work explores dedicated reordering evaluation metrics, cf. [Birch and Osborne, 2011, Isozaki et al., 2010, Talbot et al., 2011]. Existing work computes the correlation between the ranking of the outputs of different systems by an evaluation metric to human ranking, on e.g., the WMT evaluation data.
Isozaki et al [Isozaki et al., 2010, Talbot et al., 2011] argue that the conventional metrics cannot measure well the long distance reordering between an English reference sentence “A because B” and a Japanese-English hypothesis translation “B because A”, where A and B are blocks of any length with internal monotonic alignments. In this paper we ex-plore the idea of factorizing permutations into permutation-trees (PETs) [Gildea et al., 2006, Sima’an and Maillette de Buy Wenniger, 2011] and defining new tree-based reordering metrics which aims at dealing with this type of long range reorderings. We also generalize PETs into Permutation-Forests (PEFs) and exhibit an effective PEF-based metric.
The example in Figure 1 gives the flavor of PETs/PEFs. Observe how every internal node in this PET dominates a subtree whose fringe1is itself a permutation over aninteger sub-rangeof the
original permutation. Every node is decorated with a permutation over the child positions (called operator). For exampleh4,5,6i constitutes a contiguous range of integers (corresponding to a
h2,4,1,3i
2 h1,2i
4 h1,2i
5 6
1 3
Figure 1: A permutation tree forh2,4,5,6,1,3i
phrase pair), and hence will be grouped into a subtree; which in turn can be internally re-grouped into a binary branching subtree. Every node in a PET isminimum branching, i.e., the permutation factorizes into a minimum number of adjacent permutations over integer sub-ranges.
Since every node in a PET is itself decorated with a “small permutation” (the operator), defined over the positions of the children of that node, in this work we propose to compute new reordering measures that aggregate over the individual node-permutations in these PETs. For the Japanese-English example, there are two PETs (when leaving A and B as encapsulated blocks):
h2,1i
A h2,1i
because B
h2,1i
h2,1i
A because
B Our reordering measure interpolates the scores
over the two inversion operatorsh2,1iwith the internal scores forAandB, incorporating a weight for subtree height. If bothAandB are large blocks, internally monotonically aligned, then our measure will not count every single reordering of a word inA orB, but will consider this case as block reordering. From a PET perspective, the distance of the reordering is far smaller than when looking at a flat permutation. But does this hierarchical view of reordering cohere better with human judgement than string-based metrics?
The example above also shows that a permutation may factorize into different PETs, each
corresponding to a different segmentation of a sentence pair into phrase-pairs. In this paper we introducepermutation forests (PEFs); a PEF is a structure that compactly packs the set of PETs that factorize a permutation. We empirically show that a PEF-based evaluation measure correlates better with human rankings than the string-based measures oneightof the ten language pairs in WMT13 data. For the9thlanguage pair it is close to best, and for the10th(English-Czech) we find a likely explanation in theFindings of the 2013 WMT[Bojar et al., 2013]. Crucially, the PEF-based measure shows more stable ranking across language pairs than any of the other measures.
2
Measures on permutations: Baselines
In [Birch and Osborne, 2010, Birch and Osborne, 2011] Kendall’s tau and Hamming distance are combined with unigram BLEU (BLEU-1) leading to LRscore showing better correlation with hu-man judgment than BLEU-4. [Birch et al., 2010] additionally tests Ulam distance (longest com-mon subsequence – LCS – normalized by the permutation length) and the square root of Kendall’s tau. [Isozaki et al., 2010] presents a similar approach to [Birch and Osborne, 2011] additionally testing Spearman rho as a distance measure. [Talbot et al., 2011] extracts a reordering measure from METEOR [Denkowski and Lavie, 2011] dubbedFuzzy Reordering Scoreand evaluates it on MT reordering quality.
For an evaluation metric we need a function which would have the standard behaviour of evaluation metrics - the higher the score the better. Bellow we define thebaseline metrics that were used in our experiments.
Baselines A permutation over[1..n](subrange of the positive integers) is a bijective function from[1..n]to itself. To represent permutations we will use angle brackets as inh2,4,3,1i. Given a permutationπ over[1..n], the notationπi (1 ≤i≤ n) stands for the integer in theithposition
inπ;π(i)stands for the index of the position inπwhere integeriappears; andπji stands for the (contiguous) sub-sequence of integersπi, . . . πj.
The definitions of five commonly used metrics over permutations are shown in Figure 2. In these definitions, we useLCS to stand for Longest Common Subsequence, and Kronecker δ[a]
which is1if(a==true)else zero, andAn
1 =h1,· · ·, niwhich is the identity permutation over
[1..n]. We note that all existing metrics are defined directly over flat string-level permutations. In the next section we present an alternative view of permutations are compositional, recursive tree structures.
3
Measures on Permutation Forests
Existing work, e.g., [Gildea et al., 2006, Sima’an and Maillette de Buy Wenniger, 2011], shows how tofactorizeany permutationπ over[1..n]into a canonical permutation tree (PET). Here we will summarize the relevant aspects and extend PETs to permutation forests (PEFs).
A non-empty sub-sequence πij of a permutation π is isomorphic with a permutation over
[1..(j−i+ 1)]iff the set{πi, . . . , πj}is acontiguous rangeof positive integers. We will use the
kendall(π) =
Pn−1 i=1
Pn
j=i+1δ[π(i)< π(j)]
(n2−n)/2
hamming(π) =
Pn
i=1δ[πi ==i]
n
spearman(π) = 1−3
Pn
i=1(πi−i)2
n(n2−1)
ulam(π) = LCS(π,A
n 1)
n
f uzzy(π) = 1− c−1
n−1
[image:4.595.217.447.136.310.2]where c is # of monotone sub-permutations
Figure 2: Five commonly used metrics over permutations
h2,1i
h2,1i
h2,4,1,3i
5 7 4 6
3
h1,2i
1 2
h2,1i
4 h2,1i
3 h2,1i
2 1
h2,1i
4 h2,1i
h2,1i
3 2
1
h2,1i
h2,1i
4 3
h2,1i
2 1
h2,1i
h2,1i
h2,1i
4 3
2 1
h2,1i
h2,1i
4 h2,1i
3 2
1
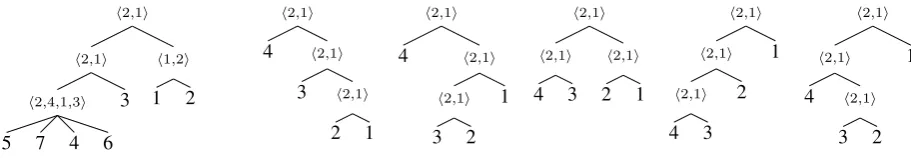
Figure 3: A PET forπ=h5,7,4,6,3,1,2i. And five different PETs forπ =h4,3,2,1i.
e.g., the subsequenceh3,5iofh1,2,3,5,4iis not a sub-permutation. One sub-permutationπ1ofπ
issmallerthan another sub-permutationπ2ofπiff every integer inπ1is smaller than all integers
inπ2. In this sense we can put a full order onnon-overlappingsub-permutations of π and rank
them from the smallest to the largest.
For every permutation π there is aminimum numberof adjacent sub-permutations it can be factorized into (see e.g., [Gildea et al., 2006]). We will call this minimum number thearityofπ
and denote it witha(π)(or simplyawhenπis understood from the context). For example, the arity ofπ =h5,7,4,6,3,1,2iisa= 2because it can be split into a minimum of two sub-permutations (Figure 3), e.g.h5,7,4,6,3iandh1,2i(but alternatively alsoh5,7,4,6iandh3,1,2i). In contrast,
π=h2,4,1,3i(also known as the Wu [Wu, 1997] permutation) cannot be split into less than four sub-permutations, i.e.,a= 4. Factorization can be applied recursively to the sub-permutations of
π, resulting in a tree structure (see Figure 3) called a permutation tree (PET) [Gildea et al., 2006, Zhang and Gildea, 2007].
[image:4.595.123.579.371.450.2][Gildea et al., 2006]. However, while different PETs of π exhibit the same reordering pattern, their different binary branching structures might indicate important differences as we show in our experiments.
Apermutation forest(akin to a parse forest)Fforπ(over[1..n]) is a data structure consisting of a subset of{[[i, j,Iij]]|0 ≤i ≤j ≤n}, whereIij is a (possibly empty) set ofinferencesfor
πij+1. Ifπij+1is a sub-permutation and it has aritya≤(j−(i+ 1)), then each inference consists of aa-tuple[p, l1, . . . , la−1], where theoperatorpis the permutation of theasub-permutations
(“children” ofπji+1), and for each1 ≤ x ≤ (a−1), lx is a “split point” which is given by the
index of the last integer in thexthsub-permutation inπ.
h2,1i
4
3 2 1
h2,1i
4 3 2 1
h2,1i
4 3 2 1
Figure 4: The factorizations ofπ=h4,3,2,1i.
Let us exemplify the inferences onπ = h4,3,2,1i(see Figure 4) which factorizes into pairs of sub-permutations (a= 2): a split point can be at positions with indexl1 ∈ {1,2,3}. Each of
these split points (factorizations) ofπwill be represented as an inferencefor thesame root node
which covers the whole ofπ(placed in entry[0,4]); an inference here consists of the permutation h2,1i(swapping the two ranges covered by the children sub-permutations) together with a−1
indexesl1, . . . , la−1signifying the split points ofπinto sub-permutations: sincea= 2forπ, then
a single indexl1 ∈ {1,2,3}is stored with every inference. For the factorization((4,3),(2,1))the
indexl1 = 2signifying that the second position is a split point intoh4,3i(stored in entry[0,2])
andh2,1i(stored in entry[2,4]). For the other factorizations ofπsimilar inferences are stored in the permutation forest.
Figure 5 shows a simple top-down factorization algorithm which starts out by computing the arityausing functiona(π). Ifa= 1, a single leaf node is stored with an empty set of inferences. If a > 1 then the algorithm computes all possible factorizations of π into a sub-permutations (a sequence of a−1 split points) and stores their inferences together as IJ
i associated with a
node in entry[[i, j,Iij]]. Subsequently, the algorithm applies recursively to each sub-permutation. Efficiency is a topic beyond the scope of this paper, but this naive algorithm has worst case time complexityO(n3), and when computing only a single canonical PET this can beO(n)(see e.g.,
[Zhang and Gildea, 2007]).
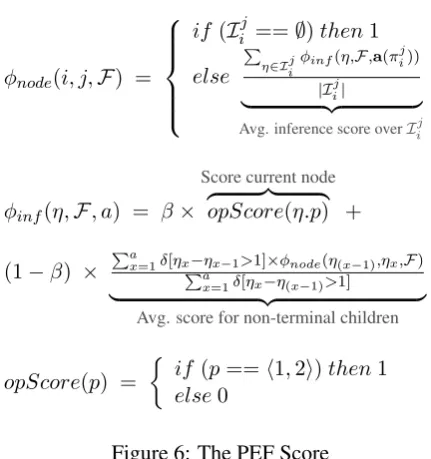
Our measure (P EF score) uses a functionopScore(p)which assigns a score to a given oper-ator, which can be instantiated to any of the existing scoring measures listed in Section 2, but in this case we opted for a very simple function which gives score 1 to monotone permutation and score 0 to any other permutation.
Given an inferenceη∈ Iij whereη= [p, l1, . . . , la−1], we will use the notationη.pto refer to
the operatorpinη, and we useηx to refer to split pointlx inηwhere1 ≤x≤(a−1), with the
convenient boundary assumption thatl0=iandla=j.
The PEF-score, P EF score(π) in Figure 6, computes a score for the single root node
[[0, n,In
FunctionP EF(i, j, π,F);
# Args: sub-perm. π over [i..j] and forest F
Output: Parse-ForestF(π)forπ;
begin
if ([[i, j, ?]]∈ F) then returnF;#memoization
a:=a(π);
ifa= 1returnF :=F ∪ {[[i, j,∅]]}; For each set of split points{l1, . . . , la−1}do
p:=RankListOf(πl1 1, π
l2
(l1+1), . . . , π
n
(la−1+1)); Iij :=Iij ∪[p, l1, . . . , la−1];
For eachπv ∈ {π1l1, π l2
(l1+1), . . . , π
n
(la−1+1)}do F :=F ∪P ermF orest(πv);
F :=F ∪ {[[i, j,Iij]]}; ReturnF;
[image:6.595.111.543.116.361.2]end;
Figure 5: Pseudo-code of permutation-forest factorization algorithm. Functiona(π) returns the arity ofπ. Function RankListOf(r1, . . . , rm)returns the list of rank positions (i.e., a
permu-tation) of sub-permutationsr1, . . . , rm after sorting them smallest first. The top-level call to this
algorithm usesπ,i= 0,j=nandF =∅.
P EF score(π) = φnode(0, n, P EF(π))
φnode(i, j,F) =
if(Iij ==∅)then1
else P
η∈Ij
i
φinf(η,F,a(πji))
|Iji|
| {z }
Avg. inference score overIji
φinf(η,F, a) = β×
Score current node
z }| { opScore(η.p) +
(1−β) ×
Pa
x=1δ[ηx−ηx−1>1]×φnode(η(x−1),ηx,F) Pa
x=1δ[ηx−η(x−1)>1]
| {z }
Avg. score for non-terminal children
opScore(p) =
if (p==h1,2i)then1
else0
[image:6.595.220.436.457.687.2]inferences of this node. The score of an inferenceφinf interpolates (β) between theopScore of
the operator in the current inference and (1−β) the scores of each child node. The interpolation parameterβcan be tuned on a development set.
The PET-score (single PET) is a simplification of the PEF-score where the summation over all inferences of a nodeP
η∈Iji inφnodeis replaced by “Select a canonicalη ∈ I
j i”.
4
Experimental setting
Data The data that was used for experiments are human rankings of translations from WMT13 [Bojar et al., 2013]. The data covers 10 language pairs with a diverse set of systems used for translation. Each human evaluator was presented with 5 different translations, source sentence and a reference translation and asked to rank system translations by their quality (ties were allowed).2
Meta-evaluation The standard way for doing meta-evaluation on the sentence level is with Kendall’s tau correlation coefficient [Callison-Burch et al., 2012] computed on the number of times an evaluation metric and a human evaluator agree (and disagree) on the rankings of pairs of translations. We extract pairs of translations from human evaluated data and compute their scores with all metrics. If the ranking assigned by a metric is the same as the ranking assigned by a human evaluator then that pair is considered concordant, otherwise it is a discordant pair. All pairs which have the same score by the metric or are judged as ties by human evaluators are not used in meta-evaluation. The formula that was used for computing Kendall’s tau correlation coefficient is shown in Equation 1. Note that the formula for Kendall tau rank correlation coefficient that is used in meta-evaluation is different from the Kendall tau similarity function used for evaluating permutations. The values that it returns are in the range[−1,1], where−1means that order is always opposite from the human judgment while the value1means that metric ranks the system translations in the same way as humans do.
τ = #concordant pairs−#discordant pairs
#concordant pairs+#discordant pairs (1)
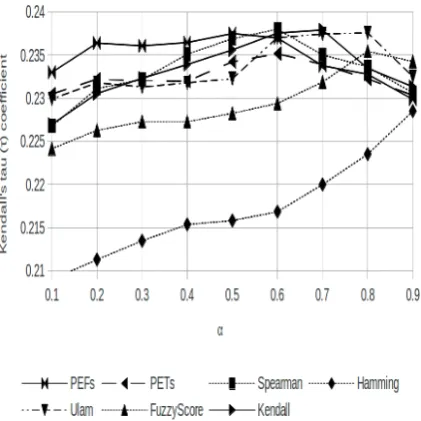
Evaluating reordering Since system translations do not differ only in the word order but also in lexical choice, we follow [Birch and Osborne, 2010] and interpolate the score given by each reordering metric with the same lexical score. For lexical scoring we use unigram BLEU. The parameter that balances the weights for these two metricsα is chosen to be0.5 so it would not underestimate the lexical differences between translations (α 0.5) but also would not turn the whole metric into unigram BLEU (α 0.5). The equation for this interpolation is shown in
2
Equation 2.3
F ullM etric(ref, sys) =α lexical(ref, sys) +
(1−α)×ordering(π(ref, sys)) (2)
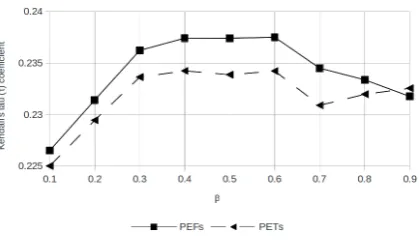
[image:8.595.225.436.286.497.2]Whereπ(ref, sys) is the permutation representing the word alignment fromsys to ref. The effect ofαon the German-English evaluation is visible on Figure 7. The PET and PEF measures have an extra parameterβ that gives importance to the long distance errors that also needs to be tuned. On Figure 8 we can see the effect ofβ on German-English forα = 0.5. For all language pairs forβ = 0.6both PETs and PEFs get good results so we picked that as value forβ in our experiments.
Figure 7: Effect ofαon German-English evaluation forβ = 0.6
Choice of word alignments The issue we did not discuss so far is how to find a permuta-tion from system and reference translapermuta-tions. One way is to first get alignments between the source sentence and the system translation (from a decoder or by automatically aligning sen-tences), and also alignments between the source sentence and the reference translation (man-ually or automatically aligned). Subsequently we must make those alignments 1-to-1 and merge them into a permutation. That is the approach that was followed in previous work [Birch and Osborne, 2011, Talbot et al., 2011]. Alternatively, we may align system and reference translations directly. One of the simplest ways to do that is by finding exact matches between words and bigrams between system and reference translation as done in [Isozaki et al., 2010]. The
3Note that for reordering evaluation it does not make sense to tuneαbecause that would blur the individual
con-tributions of reordering and adequacy during meta evaluation, which is confirmed by Figure 7 showing thatα0.5
Figure 8: Effect ofβon German-English evaluation forα= 0.5
way we align system and reference translations is by using the aligner supplied with METEOR [Denkowski and Lavie, 2011] for finding 1-to-1 alignments which are later converted to a per-mutation. The advantage of this method is that it can do non-exact matching by stemming or using additional sources for semantic similarity such as WordNets and paraphrase tables. Since we will not have a perfect permutation as input, because many words in the reference or system translations might not be aligned, we introduce a brevity penalty for the ordering component as in [Isozaki et al., 2010]. The brevity penalty is the same as in BLEU with the small difference that instead of taking the length of system and reference translation as its parameters, it takes the length of the system permutation and the length of the reference.
5
Empirical results
The results are shown in Table 1 and Table 2. These scores could be much higher if we used some more sophisticated measure than unigram BLEU for the lexical part (for example recall is very useful in evaluation of the system translations [Lavie et al., 2004]). However, this is not the issue here since our goal is merely to compare different ways to evaluate word order. All metrics that we tested have the same lexical component, get the same permutation as their input and have the same value forα.
5.1 Does hierarchical structure improve evaluation?
The results in Tables 1, 2 and 3 suggest that the PEFscore which uses hierarchy over permutations outperforms the string based permutation metrics in the majority of the language pairs. The main exception is the English-Czech language pair in which both PETs and PEFs based metric do not give good results compared to some other metrics. For discussion about English-Czech look at the section 6.1.
5.2 Do PEFs help over one canonical PET?
English-Czech English-Spanish English-German English-Russian English-French Kendall 0.16 0.170 0.183 0.193 0.218 Spearman 0.157 0.170 0.181 0.192 0.215 Hamming 0.150 0.163 0.168 0.187 0.196 FuzzyScore 0.155 0.166 0.178 0.189 0.215
Ulam 0.159 0.170 0.181 0.189 0.221
PEFs 0.156 0.173 0.185 0.196 0.219
[image:10.595.119.318.124.298.2]PETs 0.157 0.165 0.182 0.195 0.216
Table 1: Sentence level Kendall tau scores for translation out of English withα= 0.5andβ= 0.6
Czech-English Spanish-English German-English Russian-English French-English Kendall 0.196 0.265 0.235 0.173 0.223 Spearman 0.199 0.265 0.236 0.173 0.222 Hamming 0.172 0.239 0.215 0.157 0.206 FuzzyScore 0.184 0.263 0.228 0.169 0.216
Ulam 0.188 0.264 0.232 0.171 0.221
PEFs 0.201 0.265 0.237 0.181 0.228
[image:10.595.118.317.334.508.2]PETs 0.200 0.264 0.234 0.174 0.221
Table 2: Sentence level Kendall tau scores for translation into English withα= 0.5andβ= 0.6
but it also improves them in all cases except in English-Czech where both PETs and PEFs per-form badly. The main reason why PEFs outperper-form PETs is that they encode all possible phrase segmentations of monotone and inverted sub-permutations. By giving the score that considers all segmentations, PEFs also include the right segmentation (the one perceived by human evaluators as the right segmentation), while PETs get the right segmentation only if the right segmentation is the canonical one.
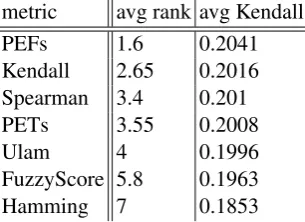
5.3 Is improvement consistent over language pairs?
metric avg rank avg Kendall
PEFs 1.6 0.2041
Kendall 2.65 0.2016
Spearman 3.4 0.201
PETs 3.55 0.2008
Ulam 4 0.1996
FuzzyScore 5.8 0.1963
[image:11.595.119.272.127.238.2]Hamming 7 0.1853
Table 3: Average ranks and average Kendall scores for each tested metrics over all language pairs
cases PEFs) and the worst scoring metric (in all cases Hamming score). We can see that, except in English-Czech, PEFs are consistently the best or second best (only in English-French) metric in all language pairs. PETs are not stable and do not give equally good results in all language pairs. Hamming distance is without exception the worst metric for evaluation since it is very strict about positioning of the words (it does not take relative ordering between words into account). Kendall tau is the only string based metric that gives relatively good scores in all language pairs and in one (English-Czech) it is the best scoring one.
6
Further experiments and analysis
So far we have shown that PEFs outperform the existing metrics over the majority of language pairs. There are two pending issues to discuss. Why is English-Czech seemingly so difficult? And does preferring inversion over non-binary branching correlate better with human judgement.
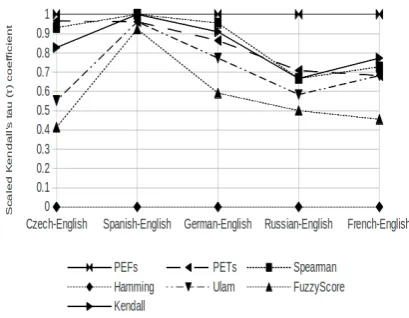
6.1 The results on English-Czech
Figure 9: Plot of scaled Kendall tau correlation for translation from English
6.2 Is inversion preferred over non-binary branching?
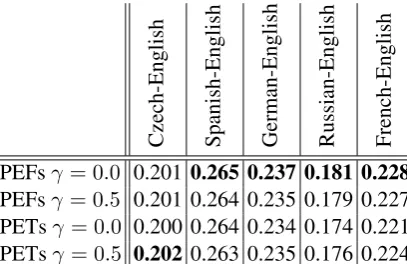
Since our original version of the scoring function for PETs and PEFs on the operator level does not discriminate between kinds of non-monotone operators (all non-monotone get zero as a score) we also tested whether discriminating between inversion (binary) and non-binary operators make any difference. Intuitively, we might expect that inverted binary operators are preferred by human evaluators over non-binary ones. So instead of assigning zero as a score to inverted nodes we give them 0.5, while for non-binary nodes we remain with zero. The experiments with the inverted operator scored with 0.5 (i.e.,γ = 0.5) are shown in Tables 4 and 5. The results show that there is no clear improvement by distinguishing between the two kinds of non-monotone operators on the nodes.
[image:12.595.226.431.486.645.2]English-Czech English-Spanish English-German English-Russian English-French PEFsγ = 0.0 0.156 0.173 0.185 0.196 0.219 PEFsγ = 0.5 0.157 0.175 0.183 0.195 0.219 PETsγ = 0.0 0.157 0.165 0.182 0.195 0.216 PETsγ = 0.5 0.158 0.165 0.183 0.195 0.217
Table 4: Sentence level Kendall tau score for translation out of English differentγ withα = 0.5
andβ = 0.6
Czech-English Spanish-English German-English Russian-English French-English PEFsγ = 0.0 0.201 0.265 0.237 0.181 0.228 PEFsγ = 0.5 0.201 0.264 0.235 0.179 0.227 PETsγ = 0.0 0.200 0.264 0.234 0.174 0.221 PETsγ = 0.5 0.202 0.263 0.235 0.176 0.224
Table 5: Sentence level Kendall tau score for translation into English for differentγwithα= 0.5
andβ = 0.6
7
Conclusions
[image:13.595.120.324.304.436.2]References
[Birch and Osborne, 2010] Birch, A. and Osborne, M. (2010). LRscore for Evaluating Lexical and Reordering Quality in MT. In Proceedings of the Joint Fifth Workshop on Statistical Machine Translation and MetricsMATR, pages 327–332, Uppsala, Sweden. Association for Computational Linguistics.
[Birch and Osborne, 2011] Birch, A. and Osborne, M. (2011). Reordering Metrics for MT. In
Proceedings of the Association for Computational Linguistics, Portland, Oregon, USA. Asso-ciation for Computational Linguistics.
[Birch et al., 2010] Birch, A., Osborne, M., and Blunsom, P. (2010). Metrics for MT evaluation: evaluating reordering.Machine Translation, pages 1–12.
[Bojar et al., 2013] Bojar, O., Buck, C., Callison-Burch, C., Federmann, C., Haddow, B., Koehn, P., Monz, C., Post, M., Soricut, R., and Specia, L. (2013). Findings of the 2013 Workshop on Statistical Machine Translation. InProceedings of the Eighth Workshop on Statistical Machine Translation, pages 1–44, Sofia, Bulgaria. Association for Computational Linguistics.
[Callison-Burch et al., 2012] Callison-Burch, C., Koehn, P., Monz, C., Post, M., Soricut, R., and Specia, L. (2012). Findings of the 2012 Workshop on Statistical Machine Translation. In Pro-ceedings of the Seventh Workshop on Statistical Machine Translation, pages 10–51, Montr´eal, Canada. Association for Computational Linguistics.
[Denkowski and Lavie, 2011] Denkowski, M. and Lavie, A. (2011). Meteor 1.3: Automatic Met-ric for Reliable Optimization and Evaluation of Machine Translation Systems. InProceedings of the EMNLP 2011 Workshop on Statistical Machine Translation.
[Gildea et al., 2006] Gildea, D., Satta, G., and Zhang, H. (2006). Factoring Synchronous Gram-mars by Sorting. InACL.
[Isozaki et al., 2010] Isozaki, H., Hirao, T., Duh, K., Sudoh, K., and Tsukada, H. (2010). Auto-matic evaluation of translation quality for distant language pairs. InProceedings of the 2010 Conference on Empirical Methods in Natural Language Processing, EMNLP ’10, pages 944– 952, Stroudsburg, PA, USA. Association for Computational Linguistics.
[Lapata, 2006] Lapata, M. (2006). Automatic Evaluation of Information Ordering: Kendall’s Tau.
Computational Linguistics, 32(4):471–484.
[Lavie et al., 2004] Lavie, A., Sagae, K., and Jayaraman, S. (2004). The significance of recall in automatic metrics for MT evaluation. InProceedings of the Sixth Conference of the Association for Machine Translation in the Americas.
[Papineni et al., 2002] Papineni, K., Roukos, S., Ward, T., and Zhu, W.-J. (2002). Bleu: a method for automatic evaluation of machine translation. InProceedings of ACL’02, pages 311–318, Philadelphia, PA, USA.
[Sima’an and Maillette de Buy Wenniger, 2011] Sima’an, K. and Maillette de Buy Wenniger, G. (2011). Hierarchical translation equivalence over word alignments. Technical Report Technical report PP-2011-38 (second version 2012), Institute for Logic, Language and Computation.
[Talbot et al., 2011] Talbot, D., Kazawa, H., Ichikawa, H., Katz-Brown, J., Seno, M., and Och, F. (2011). A Lightweight Evaluation Framework for Machine Translation Reordering. In Pro-ceedings of the Sixth Workshop on Statistical Machine Translation, pages 12–21, Edinburgh, Scotland. Association for Computational Linguistics.
[Wu, 1997] Wu, D. (1997). Stochastic inversion transduction grammars and bilingual parsing of parallel corpora. Computational Linguistics, 3(23):377–403.