Article
A Multi Model HMM Based Speech Synthesis
Supadaech Chanjaradwichai
a,*, Atiwong Suchato
b, and Proadpran Punyabukkana
cSpoken Language Systems Research Group, Department of Computer Engineering, Faculty of Engineering, Chulalongkorn University, Bangkok 10330, Thailand *E-mail: [email protected]
Abstract. The Multi-Space Probability Distribution Hidden Markov model (MSD-HMM) is a discrete model that learns a fundamental frequency feature, however it has been proven that synthesized speeches from that model contain buzziness and hoarseness which affect to an intelligibility of synthesized speeches. This research aims to improve an intelligibility of synthesized speeches by proposing a multi model HMM based speech synthesis which it models spectral features and fundamental frequency features separately called spectral model and fundamental frequency model instead of combining them to a same model. The fundamental frequency model is modelled by MSD-HMM. Output durations are calculated from maximum probability of both models. A voicing condition restriction rule with minimum output duration criteria are proposed to prevent an unmatched voicing condition of the generated parameter. Objective results show that the proposed multi model is comparable to the shared model while subjective results show that the proposed model with voicing condition restriction rule and without voicing condition restriction rule is outperform the shared model and reduce the buzziness and hoarseness of the synthesized voice. Intelligibility MOS scores of the proposed model with a voicing condition restriction, the proposed model without a voicing condition restriction and the share model are 3.62, 3.69 and 3.08 respectively and naturalness MOS scores are 3.71, 3.71 and 3.14 respectively.
Keywords: HMM-Based Speech Synthesis, multi model HMM, multi-space probability distribution HMM.
ENGINEERING JOURNAL Volume 22 Issue 1 Received 4 May 2017
1.
Introduction
A speech synthesis technology transforms texts to speeches which it is widely used as an assistive technology [1], an interactive voice response and an augmented way for receiving an information. An improvement of handheld devices in term of a computing performance and a cost enables a speech synthesis technology to the user who use the device [2], for example, The Google map voice its navigation label including street names by using a speech synthesis technology.
The hidden Markov model (HMM) based speech synthesis is one of the most successful model for modelling a speech synthesis [3]. It represents speech waveforms as speech features, and stores the trajectory of speech feature in a HMM Model which it reduces the footprint size of the model compared to store the whole pieces of the speech waveform.
A quality of synthesized speeches in the aspect of an intelligibility affects an understandability of a listener. To achieve the intelligibility, the synthesized speech must be cleared (no buzzy sound) and correctly pronounced.
The intelligibility of HMM based synthesized speeches may be low because of the poor performance of trained models which they can not reconstruct the output feature correctly. K. Yu and S. Young [4] reported that the MSD-HMM [5] which it models the fundamental frequency feature causes the poor performance of intelligibility because of the MSD-HMM models the fundamental frequency feature as either unvoiced state or voiced state which it means that the voicing condition of synthesized speech is the same for whole states
This research focus on a reconstruction of the fundamental frequency and aims to improve the intelligibility of a synthesized speech by proposing a multi model HMM based speech synthesis that allows to train model of spectral features separately with fundamental frequency.
2.
Background Knowledge
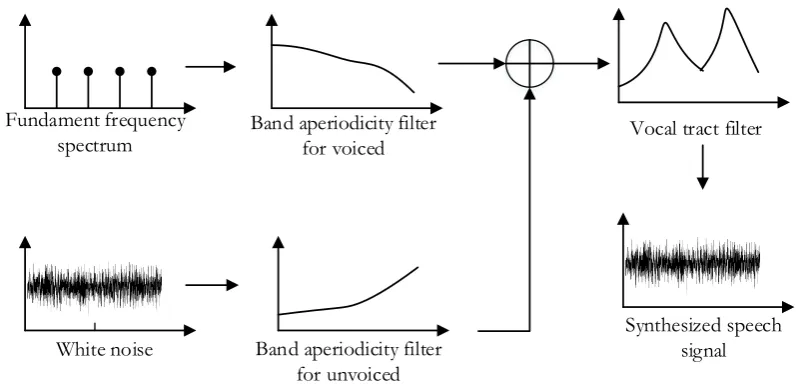
The input speech waveform is converted to features for using as inputs of a HMM via a vocoder. The state of the art source-filter vocoder [6] is STRIAGHT [7]. Output features from STRAIGHT are spectral coefficients, fundamental frequency and band aperiodic coefficients. Spectral coefficients represent a vocal tract filter. A fundamental frequency feature represents a resonance of a larynx which it is a discrete function because a larynx operates in two modes which are an open mode generating an unvoiced speech (white noise) and a resonant mode generating a voiced speech (fundamental frequency spectrum). Band aperiodic coefficients represent a filter modulated with the larynx’s spectrum. A summary of STRIAGHT vocoder is shown at Fig. 1.
Fundament frequency spectrum
White noise Band aperiodicity filter
for unvoiced Band aperiodicity filter
for voiced Vocal tract filter
Synthesized speech signal
[image:2.595.98.498.531.723.2]Inputs for training HMM model are speech feature vectors including their delta (∆) and delta-delta (∆∆), transcription of the input in the phoneme level and context features corresponding to the transcription. Context features are additional contexts describing the input data such as a stress, a part of speech and adjacent phonemes.
A single HMM model contains multiple states and a state contains multiples streams. Probabilistic
models which are the Gaussian distribution are grouped into stream as shown on Fig. 2. Streams can be
weighted. For example on Fig. 2, the third stream’s weight is 0 while the other streams’ weight are 1 which it mean that an output probability exclude probability from the third stream.
The spectral HMM model structure proposed by [8] shown on Fig. 2 combines with 3 streams which are spectral features with their ∆ and ∆∆ at the first stream, fundamental frequency feature with it ∆ and ∆∆ at the second stream, and band aperiodic features with their ∆ and ∆∆ at the third stream. Durations of sound units are modelled with another HMM models call duration model. A number of states in a duration model are equal to a number of states in a spectral model. The duration model contains only 1 stream with one feature which represents a number of frames of a corresponding state.
Due to a value of fundamental frequency features are discontinuous, the MSD-HMM is required to model fundamental frequency features. The model in a state of the MSD-HMM contains two Gaussian
distributions. The first distribution called a voicing condition distribution represents the probability of
whether a state is continuous or discrete value (voiced or unvoiced). The second distribution called a fundamental frequency distribution represents the value of continuous function (fundamental frequency). If the probability of the first distribution is greater than a defined threshold, it indicate that the model is continuous function.
Spectral + Δ+ ΔΔ
f0
Δf0
ΔΔf0
Spectral + Δ+ ΔΔ
f0
Δf0
ΔΔf0
State duration
State duration
State State State
a) Spectral and F0 HMM prototype
Spectral + Δ+ ΔΔ
f0
Δf0
ΔΔf0
State State State
b) DurationHMM prototype
State duration
BAP + Δ+ ΔΔ
BAP + Δ+ ΔΔ
BAP+ Δ+ ΔΔ
1st stream
2nd stream
3rd stream
Fig. 2. HMM prototype proposed by [8].
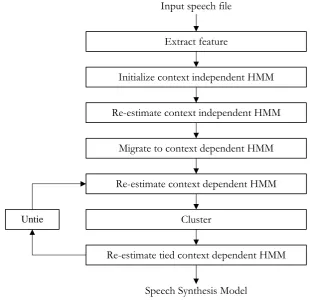
[image:3.595.148.440.357.686.2]context-training speech utterances. Then, the trained context-independent models are used as the starting models for constructing their associated full context dependent HMM.
The full context dependent HMM is huge caused by a combination of many context features. To reduce a number of context-dependent models, tree-based context clustering is performed on the full content dependent models [9]. Nodes of a tree are grouping questions derived by grammar rules. Answers of the question are either in a group of the question or not in a group of the question. The minimum generation error (MGE) criterion [9] calculated from a probability of the full context dependent HMM is used to construct a context clustering tree. Leaf nodes of a context clustering tree are grouped models called tied context dependent models.
At this stage, tied context dependent models are re-estimated again. The tied context dependent models can be improved further by untying each tied context dependent model back into their corresponding full context dependent models, which can be re-estimated again as proposed by [8]. These steps, tying full context dependent models into tied context dependent models, re-estimation of tied context dependent models, untying tied context dependent models, and re-estimation of full context dependent model before being tied again, can be repeated for an arbitrary number of iterations. Duration models are trained during each re-estimation process [10].
Finally, the global variance model [11] is trained and applied to compensate for possible over-smoothing effects. This process is optional.
The state boundaries of HMM models are not observable from the given transcriptions because they are labelled in a phoneme level while a state level is sub segmental of a phoneme level. The expectation-maximization algorithm estimates state boundaries which maximize the output probability of a HMM model.
A duration model is modelled with the Gaussian distribution model, and trained with the state duration of a corresponding state at the re-estimation process simultaneously with a speech model.
Extract feature
Initialize context independent HMM
Re-estimate context independent HMM
Migrate to context dependent HMM
Re-estimate context dependent HMM
Cluster
Re-estimate tied context dependent HMM Untie
Input speech file
Speech Synthesis Model
Fig. 3. HMM based speech synthesis training process.
[image:4.595.132.443.389.689.2]Spectral coefficients, fundamental frequency, and band aperiodicity coefficients collect from a mean value of each state in speech model and repeat until a number of the output duration. The synthesized features from the speech model are processed with the smoothing function proposed by [12] and global variance [11], then they are synthesized to speech waveform.
To determine a fundamental frequency from the fundamental frequency MSD model, a mean value of the voicing condition distribution is considered. If the value is lower than a threshold, a result is unvoiced, otherwise, a result is voiced and a fundamental frequency is determined from the fundamental frequency distribution of the MSD-HMM.
3.
Literature Review
This section reviews an improvement in a reconstruction of the fundamental frequency for enhancing an intelligibility of the synthesized speech.
A fundamental frequency contains voiced and unvoiced regions which it is represented as a discrete parameter. In voiced regions, values of the fundamental frequency are continuous and range from 60Hz to 300Hz [13] and in unvoiced regions, the fundamental frequency is replaced with a spectrum of turbulence airflow which it can not represented with real value. A representation of the fundamental frequency with continuous value is not possible.
To deal with that problem, two solutions were proposed. The first solution is modifying a HMM model to support a discontinuous parameter. The second solution is changing the representation of fundamental frequency to a continuous parameter called continuous vocoder.
The MSD-HMM was proposed to model a discrete parameter like a fundamental frequency. It contains two probability distributions which are the probability distribution of being a discontinuous parameter (unvoiced) and the value of continuous region (voiced). The voicing condition of MSD-HMM is determined from a probability distribution of being a discontinuous parameter.
The speech synthesis modelled with MSD-HMM has a problem at a parameter generation process because the voicing condition is same amount state and the mismatch of a voicing condition between spectral feature and fundamental frequency can be occurred which it lead to a buzziness and a hoarseness problem. A continuous vocoder was proposed to fix this problem.
A continuous vocoder generates continuous values in an unvoiced region by using estimation functions [14], heuristic rules [15] and multiple F0 candidates tracker [16]. A voicing condition classification of a generated parameter is required for a continuous vocoder. Features for classifying are band aperiodicity [7] and maximum voiced frequency [17]. These features are continuous value and modelled with standard HMM model [18]. The voicing condition is not depended on the state so the synthesized speech is better than MSD-HMM.
A hybrid approach by using joint model like MSD-HMM with continuous vocoder was proposed by [4, 19]. The voicing condition of this model is jointly modelled with a fundamental frequency instead of separated HMM model, and is trained with voicing labels information.
Both methods outperform MSD-HMM in objective tests and subjective tests because a voicing condition is not modelled in state level which it allows the voicing condition of synthesized speech in the same state can be either voiced or unvoiced. It leads to the assumption of this research that the state boundary definition of the traditional model proposed by [19] is ineffective for reconstruction a fundamental frequency with MSD-HMM because the spectral model proposed by [20] combines spectral features and fundamental frequency features into the same model. An output probability of the state is shared between those features. This research proposes multi-model HMM based speech synthesis which it models the spectral feature and fundamental frequency feature separately.
4.
Proposed Method
4.1. The Multi Model HMM-based Speech Synthesis
A state boundary definition of HMM model relies on the output probability of a state. The output probability is a summation of the probability of every features and weighted with the stream weight. The probability of a feature is calculates from the Gaussian distribution probability density function of the trained model with value of an observation (training data).
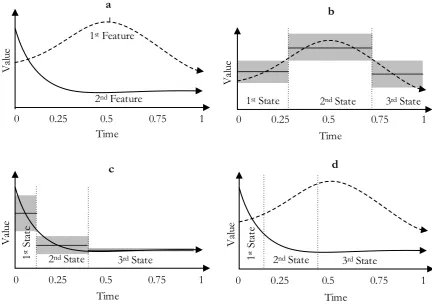
The example of state boundary definition shows in Fig. 4. Training data compose of 2 features as show in Fig. 4(a). The value of the first feature is move upward until 50% of the data and then move downward but the value of the second feature is drop sharply until 40% of the data and then steady to the end.
The HMM with 3 states models the data show in Fig. 4(a). The maximum output probability criterion is applied to find state boundaries. The Gaussian probability distribution function is used to model a state. A mean and variance of a state calculated from observation data placed in the state interval. An output probability of the state is calculated by product of every probability from observation data placed in the state interval.
For the first feature, state boundaries place at approximately 0 - 0.25, 0.25 – 0.75 and 0.75 – 1 for the first, second and third state respectively as shown on Fig. 4(b) where the horizontal lines in the graph represent a mean value and the shade areas represent the variance. For the second feature, state boundaries place at approximately 0 - 0.125, 0.125 – 0.4 and 0.4 – 1 for the first, second and third state respectively as shown on Fig. 3(c). The third state of Fig. 4(c) contains steady observation data so its variance is little and its output probability is too high.
When both features combine to the same model, the results may be bias to either the first feature or the second feature. From Fig. 4(b) and Fig. 4(c) show that a output probability of the second feature is more than the first feature because the second feature contains steady values at interval 0.4 – 1 so the state definition of the combining the first and second features is shown at Fig. 3(d) where the state boundary is bias to the second feature.
V
al
ue
1st Feature
2nd Feature
Time
1st State 2nd State 3rd State
V
al
ue
Time
1
st S
ta
te
2nd State 3rd State
V
al
ue
Time
1
st S
ta
te
2nd State 3rd State
V
al
ue
Time
a b
c
d0 0.25 0.5 0.75 1 0 0.25 0.5 0.75 1
0 0.25 0.5 0.75 1 0 0.25 0.5 0.75 1
[image:6.595.80.513.413.718.2]The previous example shows that a state boundary definition of a combination of multiple features isn’t optimal as separation. Comparing to a combination of spectral features and fundamental frequency features in the same model may cause a state boundary of fundamental frequency features is biased with spectral features.
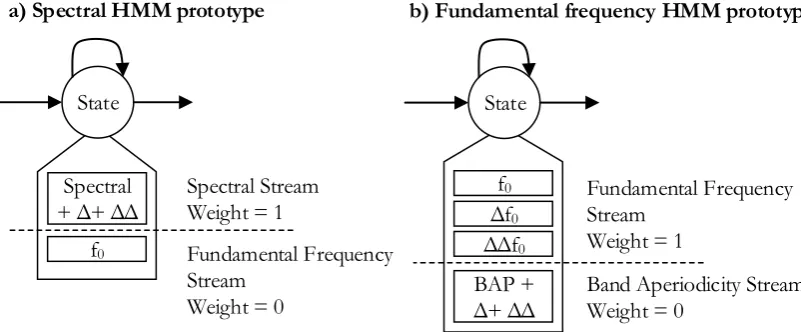
This research proposes a multi model HMM-based speech synthesis to eliminate that problem by splitting to spectral model and a fundamental frequency model. A component of the spectral model consists of a spectral stream and a fundamental frequency stream but a weight of the fundamental frequency stream is set to 0 to ignore a bias from a fundamental frequency as shown on Fig. 5(a). A fundamental frequency model contains a fundamental frequency stream and a band aperiodicity stream as shown on Fig. 5(b).
A duration model and clustered trees are duplicated to both a spectral model and a fundamental frequency model.
The reason for storing fundamental frequency stream in a spectral model is for checking a corresponding of a voicing condition of output speech parameters, for example output spectral features generated from the unvoiced region of a spectral model should not match with output fundamental frequency generated from a voiced region.
A band aperiodicity is a filter for convoluting with a fundamental frequency filter as shown on Fig. 1 so a band aperiodicity stream is combined with a fundamental frequency stream at the fundamental frequency model.
A training procedure of both models is same as proposed by [8]. Both models are individually trained with a same dataset and same parameter tuning configurations.
State
a) Spectral HMM prototype
Spectral + Δ+ ΔΔ
f0
State
b) Fundamental frequency HMM prototype
f0
Δf0
ΔΔf0
BAP + Δ+ ΔΔ Spectral Stream
Weight = 1
Fundamental Frequency Stream
Weight = 0
Fundamental Frequency Stream
Weight = 1
Band Aperiodicity Stream Weight = 0
Fig. 5. The proposed multi model HMM.
4.2. TheOutputDurationCalculation
The duration model stores the length of a corresponding model in frame unit. It is modelled as a Gaussian probability controlled with mean and variance parameter. Mean and variance of the models are trained during the model training process [17].
This proposed method has 2 duration models stored at the spectral model and fundamental frequency model. In a shared model, the output duration is calculated by the summation of all mean value in the state of the duration models. For multi model, if the output duration calculated by that method separately, it may result in an inequality of the output generated by both models.
A maximum probability equation of both duration models with an equal total length criterion as shown
on Eq. (1) is used to find the output duration of the multi model. dsi and dfi are output duration at ith state
of a spectrum model and a fundamental frequency model respectively. si and fi are the Gaussian
probability density functions of duration model at the ith state of a spectrum model and a fundamental
[image:7.595.96.497.358.524.2])
(
)
(
max
arg
}
,...,
,
,...,
{
1 ,..., , ,..., 1 1 1 1 si fi si n i si d d d d fn f sns
d
d
d
d
d
d
fn f sn s
where
ni fin
i 1
d
si 1d
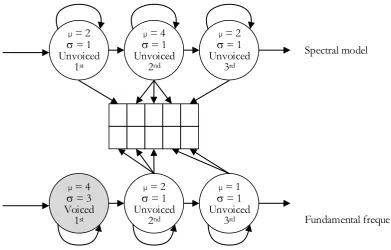
(1)The example of applying Eq. (1) is shown on Fig. 6. The mean values of duration model at spectral
model are 2, 4 and 2 for the 1st, 2nd and 3rd state respectively and for fundamental frequency model are 4, 2
and 1 for the 1st, 2nd and 3rd state respectively so a summation of the mean value of spectral model and
fundamental frequency model are 8 and 7 respectively. A maximum probability in each state of duration model occurs when a number of output frames is equal to a mean value. To maximize the probability of
Eq. (1), the output duration is 8 frames by extending the 1st state of the fundamental frequency model to 5
frame because increasing the 1st state of fundamental frequency model which its variance is 3 reduces the
probability of Eq. (1) less than increasing other state in fundamental frequency model or decreasing states in spectral model which their variance are 1.
µ = 2 s = 1 Unvoiced
1st
µ = 4 s = 1 Unvoiced
2nd
µ = 2 s = 1 Unvoiced
3rd
µ = 4 s = 3 Voiced
1st
µ = 2 s = 1 Unvoiced
2nd
µ = 1 s = 1 Unvoiced
3rd
Spectral model
Fundamental frequency model
Fig. 7. Output duration without voicing condition restriction rule.
Due to both models are individually trained, a relation about a voicing condition of generated parameters is ignored as described in section 4.1. The rule for checking voicing condition called voicing condition restriction rule is defined that the parameter generated at the same frame form both model must be same voicing condition. To determine the voicing condition of a spectral model, the mean value from a voicing condition distribution in the MSD-HMM at a fundamental frequency stream of a spectral model is considered.
In some situations, they are impossible to match the same voicing condition between both models. This situation is called unmatched voicing condition. The example of unmatched voicing condition is shown on Fig. 8. The spectral model contains 3 unvoiced states and the fundamental frequency model contains 1 voiced states at the first state and 2 unvoiced states.
An approach to eliminate this problem is ignoring some states by setting the duration of that state to 0. The result of a state duration using the Eq. (1) and applying the voicing condition restriction rule is shown on Fig. 8.
[image:8.595.78.464.254.503.2]algorithm increase the number of dropped state by one until a case which satisfied the voicing condition restriction rule is found.
µ = 2 s = 1 Unvoiced
1st
µ = 4 s = 1 Unvoiced
2nd
µ = 2 s = 1 Unvoiced
3rd
µ = 4 s = 3 Voiced
1st
µ = 2 s = 1 Unvoiced
2nd
µ = 1 s = 1 Unvoiced
3rd
Spectral model
Fundamental frequency model
Fig. 8. Output duration with voicing condition restriction rule.
Using only an equation Eq. (1) for generating state durations from both model is affected by the ignoring states because when states are ignored, the output duration is reduce as shown on Fig. 8 comparing to the example shown on Fig. 7. A minimum output duration rule is proposed to fix that problem by limiting the minimum output duration for each models. Rules proposed by this research are
shown on Eq. (2) – Eq. (5) where µsi and µfi at Eq. (2) to Eq. (5) are a mean value of duration model at ith
state on a spectral model and a fundamental frequency model respectively. Only one rule of Eq. (2) to Eq. (5) is applied with Eq. (1) at once. The detail of each rules are:
1. A output duration must more than the summation of mean values in each states including ignored
states on a fundamental frequency model called CRI_F as shown on Eq. (2).
n i fi n
i fi n
i 1
d
si 1d
1
(2)2. A output duration must more than the summation of mean values in each states including
ignoring states on a spectral model called CRI_SPEC as shown on Eq. (3).
n i si n
i fi n
i 1
d
si 1d
1
(3)3. A output duration must more than the summation of minimum mean values between a spectral
model and a fundamental frequency model at the same states including ignoring states called CRI_MIN as shown on Eq. (4).
n
i si fi n
i fi n
i 1
d
si 1d
1min(
,
)
(4)4. The output duration must more than the summation of average mean values between spectral
[image:9.595.78.470.118.368.2]
n
i
fi si n
i fi n
i1dsi 1d 1 2
(5)
An output duration can be generated by using only Eq. (1), however applying the phrase restriction rule and the minimum state duration rule are optional to prevent the problem described above. A performance of applying the voicing condition restriction rule and the minimum state duration rule are discussed at section 6.
5.
Evaluation Method
This section describes a corpus detail, model configurations and a methodology of objective and subjective evaluation.
5.1. Training Configuration
TSYNC corpus [21] is used in this evaluation. Specifications of TSYNC corpus are 5,200 sentences from the selected Thai publication article, 13.94 hours, recording by a Thai female news reporter and tri-phonetically balanced. The context featured tagged with this corpus is only a part of speech.
The corpus is divided to training set and evaluation set. The evaluation set contains 500 sentences selected by using the most unique full context contained in the sentence criterion. The evaluation set is used to perform objective test. Only 25 sentences from evaluation set called listening dataset are randomly selected to perform a subjective test. Details of all data sets are described in Table 1.
Table 1. Detail of corpus.
Attribute Training Evaluation Listening
Number of files 4700 500 25
Duration 13.94 hour 1.05 hour 3.13 min
Phoneme count 422,261 24,002 1,239
Distinct full context count 233,041 22,192 1,157
% overlapped full context comparing to
training data --- 11.34% 10.63%
A structure of Thai syllable begins with initial consonants, follows by vowels and ends with final consonants as shown on Fig. 9. Final consonants are optional.
Context features applied to every models in this evaluation are
- 7 context dependent phonemes (3 phonemes forward, current and 3 phonemes backward)
- 7 context dependent tones in phoneme level (3 tones forward, current and 3 tones backward)
Generally, a tone is a property in syllable level, so a tone feature is inserted to each phoneme in the same syllable. For example, a full context feature of the underlined phoneme at the Fig. 6 is “r<vv_m-ii+k=aa>n^/A:4<4_0-0+0=0>0” where “^/A:” is a separator between a phoneme part and a tone part.
r-vv-4 m-ii-0 k-aa-n^-0
tone consonant
final consonant vowel
1 syllable
Fig. 9. Thai syllable structure.
5.2. Model Configuration
Models in this evaluation are 1) baseline model (BASE) trained with the toolkit provided by [3] without any modification, 2) propose model without an unmatched phrase rejection (PRO_NO_REJ) trained with the toolkit provided by [3] with modified HMM model prototype but not applied an unmatched phrase rejection and 3) propose model with an unmatched phrase rejection (PRO_REJ) trained with the toolkit provided by [3] with modified HMM model prototype and applied an unmatched voicing condition rejection.
Training configurations of all model are same as default setting defined by [3]. A MGE tree-based context clustering [9] and global variance [11] are applied. For a proposed model the global variance is separately trained to a spectral model and fundamental frequency model.
5.3. Minimum Output Duration Criteria Evaluation
To select minimum output duration criteria applied in PRO_REJ model, all of the criteria described in section 4.2 are evaluated by an objective measurement using root mean square error in phoneme level calculated by Eq. (6) called RMSE/D.
n x x RMSE
n
i si ri
1
2
) (
(6)
Xsi is the calculated duration in phoneme level at ith sequence, Xri is the actual duration from reference
data at ith sequence and n is a total number of sequence.
The proposed model generates output duration of all training data with every criteria for comparing to the actual duration from training data. Silent and short pause segments are not included in this experiment.
5.4. Objective Measurement
Objective measurements are a mel cepstral distortion (MCD) [22] for evaluating spectrum features, a band aperiodicity distortion (BAD) [23] for evaluating band aperiodicity features, a count of unmatched voicing condition frame (CV/U) [23] for detecting unmatched voicing conditions, a root mean square error of fundamental frequency (RMSE/F) [24] for evaluating a trajectory of fundamental frequency and a root mean square error of duration (RMSE/D) for evaluating an output duration.
To perform MCD, BAD, CV/U and RMSE/F, synthesized speeches are warped with reference speeches using a dynamic time warping algorithm [25]. A minimum distance of spectrum features is a criterion for wrapping. Then wrapped synthesized speeches are compared frame by frame. A calculation of BAD is the same as MCD described in [20] but using band aperiodicity features instead of Mel cepstral features. They measure the differences at the frame level between synthesized speech and reference speech. A CV/U is calculated by counting unmatched a voiced and an unvoiced phrase at the same frame position between synthesized speeches and reference speeches. RMSE/F and RMSE/D are calculated with Eq. (6)
where Xri is a value of reference sample, Xsi of RMSE/F is a fundamental frequency in hertz unit at ith
frame ofsynthesized speech; Xsi of RMSE/D is the duration of the synthesized speech at ith phoneme
sequence. Only matched voiced frames between synthesized and reference frame are included in RMSE/F calculation. Silent and short pause segments aren’t included in RMSE/D calculation.
Every models synthesize speech sentences corresponding to the evaluation set and evaluate with the objective measurement by using human speeches as a reference.
5.5. Subjective Measurement
Table 2. Description of naturalness MOS.
MOS Level Description
1 Listeners can not determine a content from listened speeches
2 A rhythm of listened speeches is not the same as the human speech in most of the duration, approximate 50-100% of all syllables.
3 A rhythm of listened speeches is not the same as the human speech in some parts of the duration, approximate 10-50% of all syllables.
4 A rhythm of listened speeches is not the same as human speech in some syllables, approximate 0-10% of all syllables.
5 A rhythm of listened speeches is the same as a human speech.
Table 3. Description of intelligibility MOS.
MOS Level Description
1 Listeners can not determine the content from listened speeches
2 Listeners can not determine the content of listened speeches in most of the duration,
approximate 50-100% of all syllables.
3 Listeners can not determine the content of listened speeches in some parts of the
duration, approximate 10-50% of all syllables.
4 Listeners can not determine the content of listened speeches in some syllables,
approximate 0-10% of all syllables.
5 Listeners can determine all of the content from listened speeches.
A preference test asked listeners to rank a preference by paired comparisons which are BASE compared with PRO_REJ, BASE compared with PRO_NO_REJ and PRO_REJ compared with PRO_NO_REJ. An equal preference level is included.
Listeners listened to the same sentence generated from all variant of models in a same question. The MOS and preference tests are performed at the same time. The human speeches are added to the test as a reference. Listeners were allowed to listen to each choice repeatedly.
Listeners are 6 males and 5 females, from 20 to 27 years old. All of listeners were briefed about a meaning of naturalness and intelligibility before testing.
6.
Result & Discussion
This section presents results of the evaluation described at previous section.
6.1. Minimum Output Duration Criteria Results
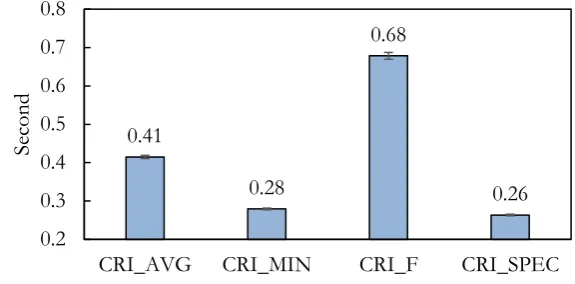
Minimum output duration criteria results are shown in Fig. 10. CRI_SPEC gets the lowest RMSE/D scores (0.263 second) while CRI_F gets the highest RMSE/D scores (0.678 second). Results indicate that the duration model trained by spectral features is significantly better than the duration model trained by fundamental frequency features. The output durations with CRI_SPEC are slightly longer than the reference data while the output durations with CRI_F are extremely longer than the training data, so the result with CRI_MIN is closer to CRI_SPEC and the result of CRI_AVG is between the CRI_SPEC and CRI_F.
[image:12.595.65.514.104.221.2] [image:12.595.63.516.253.369.2]Fig. 10. Minimum output duration criteria results.
6.2. Objective Results
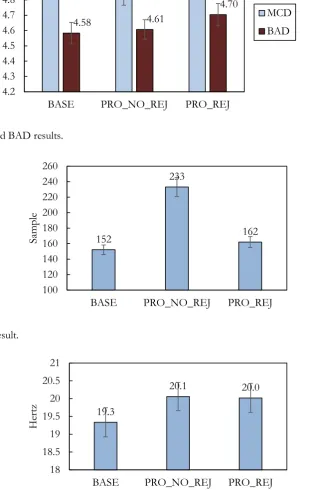
MCD and BAD results are shown in Fig. 11. MCD result of PRO_NO_REJ model is better than BASE model which it may cause by a modelling of the spectral model separately but when an unmatched phrase rejection is applied, MCD result is worse than BASE model because some states are dropped.
A result of BAD is contrast to MCD. The BAD result of PRO_ REJ and PRO_NO_REJ model is slightly worse than the BAD result of BASE model and the BAD result of PRO_ REJ is worse than PRO_NO_REJ.
However, the difference between BASE, PRO_NO_REJ and PRO_REJ in MCD and BAD test is less than 3% which they may not impact to a perception of the listeners.
CV/U result is shown at Fig. 12. An error at PRO_NO_REJ model is more than BASE model as expected. When unmatched phrase rejection is applied, the CV/U result of PRO_REJ is close to the BASELINE.
RMSE/F result of PRO_NO_REJ model is same as PRO_ REJ model but slightly worse than the result of BASE model as shown on Fig. 13.
The objective evaluations of fundamental frequency model in BAD, CV/U and RMSE/F evaluation is slightly worse than baseline model, however [26] indicates that a small distortion in fundamental frequency (< 5 hertz) is not affected a naturalness and intelligibility listener perceived.
The objective results indicate that PRO_NO_REJ spectral model is slightly better than BASE model while the fundamental frequency components which are fundamental frequency and BAP coefficients is worse than BASE model which it may cause by the warping criteria which relied on only spectral features. Appling unmatched voicing condition in PRO_REJ model improves the performance on CV/U test but degrades the performance on MCD and BAD test.
The result of RMSE/D on Fig. 14 shows that the result of PRO_REJ model is close to BASE model while PRO_NO_REJ model is the worst because output durations of PRO_NO_REJ apply the maximum probability from both spectrum and fundamental frequency model which it has been proven in the minimum output duration criteria evaluation that the duration model of fundamental frequency model is worse than the spectral model.
0.41
0.28
0.68
0.26
0.2 0.3 0.4 0.5 0.6 0.7 0.8
CRI_AVG CRI_MIN CRI_F CRI_SPEC
Se
Fig. 11. MCD and BAD results.
Fig. 12. CV/U result.
Fig. 13. RMSE/F result.
4.97
4.86
5.00
4.58 4.61
4.70
4.2 4.3 4.4 4.5 4.6 4.7 4.8 4.9 5 5.1 5.2
BASE PRO_NO_REJ PRO_REJ
dB MCD
BAD
152
233
162
100 120 140 160 180 200 220 240 260
BASE PRO_NO_REJ PRO_REJ
Sa
mple
19.3
20.1 20.0
18 18.5 19 19.5 20 20.5 21
BASE PRO_NO_REJ PRO_REJ
He
[image:14.595.141.454.152.643.2]Fig. 14. RMSE/D result.
6.3. Subjective Results
The result of MOS test is shown on Fig. 15. The intelligibility and naturalness MOS of PRO_NO_REJ are 3.69 and 3.71 respectively, and PRO_REJ model are 3.62 and 3.71 respectively. The results of proposed model are better than BASE model which its intelligibility and naturalness MOS score are 3.08 and 3.14.
ANOVA significant values and Fisher’s least significant difference (LSD) values are calculated to measure a significant of the result. The ANOVA significant value of the naturalness and the intelligibility test are 0.032 and 0.035 respectively indicating that the results are significantly difference at 95% confidence interval. The post hoc LSD results are shown on Table 4 indicating that the intelligibility and naturalness MOS of PRO_NO_REJ and PRO_REJ are significantly better than BASE model and a different between the intelligibility and naturalness MOS of PRO_NO_REJ and PRO_REJ is not significant.
The result of the preference test is shown in Table 5 and its trend is the same as the one of MOS test. The listeners prefer PRO_NO_REJ and PRO_REJ more than BASE model 58.91% and 62.91% respectively and equally preference between PRO_NO_REJ and PRO_REJ.
[image:15.595.145.452.461.586.2]Listeners gave opinions that the BASE model is more buzzy speech than PRO_NO_REJ and PRO_REJ, but in some speech file, the listeners feel that PRO_NO_REJ model and PRO_REJ model produce wrong tones and phonemes and both models produce in the different way.
Fig. 15. Minimum output duration criteria results.
Table 4. LSD significant value of MOS test.
Model Intelligibility Naturalness
BASE and PRO_REJ 0.038 0.023
BASE and PRO_NO_REJ 0.020 0.022
PRO_REJ and PRO_NO_REJ 0.771 0.988
0.303
0.315
0.304
0.28 0.29 0.3 0.31 0.32 0.33
BASE PRO_NO_REJ PRO_REJ
Se
cond
3.083.14 3.693.71 3.623.71
0 1 2 3 4 5
BASE PRO_NO_REJ PRO_REJ
Table 5. Preference result.
Model A Prefer A Equal Prefer B Model B
BASE 15.64% 25.45% 58.91% PRO_NO_REJ
BASE 12.00% 25.09% 62.91% PRO_REJ
PRO_REJ 32.00% 37.09% 30.91% PRO_NO_REJ
7.
Conclusion
This research proposed an alternative method for improving a synthesized speech in the aspect of removing a buzziness and a hoarseness. The proposed multi model HMM method splits spectral features and fundamental frequency features to separate models. The fundamental frequency models with MSD-HMM which it was reported that the synthesized speech with MSD-MSD-HMM contains buzziness and hoarseness. The methods for generating output durations from multi model HMM are proposed which are the maximum probability from both duration models and added on with voicing condition restriction rule and minimum duration criteria.
The evaluation on minimum duration criteria showed that the duration models generated with minimum duration from mean values of the spectral model were far better than the fundamental frequency model, so voicing condition restriction is used with minimum duration criteria from spectral models.
The objective results showed that the test synthesized parameters from baseline models were slightly better than synthesized parameters from proposed model in most of the tests, except for the MCD test of proposed model without voicing condition restriction. The applying voicing condition restriction improved the mismatch of voicing condition as shown on U/V test, however in the MCD and BAD test, it was slightly worse than not applying the voicing condition restriction.
The result of subjective test was contrast with the objective test, both propose models outperformed a baseline model with significant but listeners can not notice the difference between applying and not applying voicing condition restriction rule. The opinions of the listener indicated that the synthesized speeches from baseline model contained the buzziness sound more than proposed models.
The factor about the uncorrelated between objective result and subjective result may caused by the wrapping between the synthesized speech and the reference speech. In the objective tests, the synthesized speeches were wrapped with reference speech by optimizing the distance of spectral features. The wrapping algorithm allowed some frames of synthesized speech to be drop or repeat. The dropped frames may be buzzy frames. A duration of buzzy segments is short compare to the overall time because the objective measurements that use an average algorithm weren’t affect by the buzzy sound.
According to the subjective results, they can conclude that the proposed multi model produce less buzziness and hoarseness than the shared MSD-HMM, however some phonemes synthesized from proposed model are pronounce incorrectly which it need to be improved.
Acknowledgement
This research was supported by CU Graduated school thesis grant.
References
[1] N. Chinathimatmongkhon, A. Suchato, and P. Punyabukkana, “Implementing Thai text-to-speech
synthesis for hand-held devices,” in Electrical Engineering/Electronics, Computer, Telecommunications and
Information Technology, 2008.
[2] A. Suchato, V. Chetsiri, V. Skulareemit, P. Thongprasert, and P. Punyabukkana, “Multilingual AAC on
Android,” in Proceedings of the 5th International Conference on Rehabilitation Engineering & Assistive Technology, 2011.
[3] R. A. Khan and J. S. Chitode, “Concatenative speech synthesis: A Review,” International Journal of
Computer Applications, vol. 136, no. 3, 2016.
[4] K. Yu and S. Young, “Continuous F0 modeling for HMM based statistical parametric speech
[5] K. Tokuda, T. Masuko, N. Miyazaki, and T. Kobayashi, “Multi-space probability distribution HMM,”
IEICE Transactions on Information and Systems, vol. 85, no. 3, pp. 455-464, 2002.
[6] B. Milner, and X. Shao. “Speech reconstruction from mel-frequency cepstral coefficients using a
source-filter model,” in INTERSPEECH, 2002.
[7] H. Kawahara, J. Estill, and O. Fujimura, “Aperiodicity extraction and control using mixed mode
excitation and group delay manipulation for a high quality speech analysis, modification and synthesis system straight,” in International Workshop Models and Analysis of Vocal Emissions for Biomedical Applications, 2001.
[8] H. Zen, T. Nose, J. Yamagishi, S. Sako, T. Masuko, A. W. Black, and K. Tokuda, “The HMM-based
speech synthesis system (HTS) version 2.0,” in IEEE Speech Synthesis Workshop, 2007, pp. 294-299.
[9] Y. J. Wu and R. H. Wang, “Minimum generation error training for HMM-based speech synthesis,” in
IEEE International Conference on Acoustics, Speech and Signal Processing, 2006, vol. 1.
[10] T. Yoshimura, K. Tokuda, T. Masuko, T. Kobayashi, and T. Kitamura, “Duration modeling for
HMM-based speech synthesis,” in International Conference on Spoken Language Processing, 1998, pp. 29-32.
[11] T. Tomoki and K. Tokuda, “A speech parameter generation algorithm considering global variance for
HMM-based speech synthesis,” IEICE Transactions on Information and Systems, vol. 90, no. 5, pp. 816-824, 2007.
[12] K. Tokuda, T. Kobayashi, and S. Imai, “Speech parameter generation from HMM using dynamic
features,” in International Conference on Acoustics, Speech, and Signal Processing, 1995, vol. 1, pp. 660-663.
[13] X. Huang, A. Acero, and H. W. Hon, Spoken Language Processing: A Guide to Theory, Algorithm, and System
Development. Upper Saddle River: Prentice Hall, 2001.
[14] T. Lyche and L. L. Schumaker, “On the convergence of cubic interpolating splines,” in Spline Functions
and Approximation Theory. Birkhäuser Basel, 1973, pp. 169-189.
[15] P. N. Garner, M. Cernak, and P. Motlicek, “A simple continuous pitch estimation algorithm,” IEEE
Signal Processing Letters, vol. 20, no. 1, pp. 102-105, 2013.
[16] H. Kawahara, I. M. Katsuse, and A. D. Cheveigne, “Restructuring speech representations using a
pitch-adaptive time-frequency smoothing and an instantaneous-frequency-based F0 extraction: Possible role of a repetitive structure in sounds,” Speech Commun., vol. 27, no. 3–4, pp. 187–207, 1999.
[17] T. Drugman and Y. Stylianou, “Maximum voiced frequency estimation: Exploiting amplitude and
phase spectra,” IEEE Signal Processing Letters, vol. 21, no. 10, pp. 1230-1234, 2014.
[18] T. G. Csapó, G. Németh, M. Cernak, and P. N. Garner, “Modeling unvoiced sounds in statistical
parametric speech synthesis with a continuous vocoder,” in European Signal Processing Conference, 2016, pp. 1338-1342.
[19] K. Yu, B. Thomson, S. Young, and T. Street, “From discontinuous to continuous F0 modelling in
HMM-based speech synthesis,” in Proc. ISCA SSW7, Kyoto, Japan, 2010, pp. 94–99.
[20] T. Yoshimura, K. Tokuda, T. Masuko, T. Kobayashi, and T. Kitamura, “Simultaneous modeling of
spectrum, pitch and duration in HMM-based speech synthesis,” in Proc. Eurospeech, 1999, pp. 2347-2350.
[21] C. Hansakunbuntheung, V. Tesprasit, and V. Sornlertlamvanich, “Thai tagged speech corpus for
speech synthesis,” in International Committee for the Co-ordination and Standardization of Speech Databases and
Assessment Techniques, 2003, pp. 97-104.
[22] J. Kominek, T. Schultz, and A. W. Black, “Synthesizer voice quality of new languages calibrated with
mean mel cepstral distortion,” in International Workshop on Spoken Language Technologies for Under-resourced
Languages, 2008, pp. 63-68.
[23] Z. Wu, O. Watts, and S. King, “Merlin: An open source neural network speech synthesis system,” in
9th ISCA Speech Synthesis Workshop, pp. 202-207, 2016.
[24] S. N. Kayte, M. Mundada, S. Gaikwad, and B. Gawali, “Performance evaluation of speech synthesis
techniques for English language,” in Proceedings of the International Congress on Information and
Communication Technology, 2016, pp. 253-262.
[25] S. Salvador and P. Chan, “Toward accurate dynamic time warping in linear time and space,” Intell.
Data Anal., vol. 11, pp. 561-580, Oct. 2007.
[26] K. Trakulsuk, A. Suchato, P. Punyabukkana, and C. Wutiwiwatchai, “Prediction of tone naturalness
perception using geometric model,” in Computer Science and Software Engineering, (JCSSE), 2014 11th
![Fig. 2. HMM prototype proposed by [8].](https://thumb-us.123doks.com/thumbv2/123dok_us/8107402.235454/3.595.148.440.357.686/fig-hmm-prototype-proposed.webp)