David Duffy
Joseph Durkan
Kevin Timoney
Eddie Casey
Winter 2012
THE
ESRI
The
Economic
Research
Institute
was
founded
in
Dublin
in
1960,
with
the
assistance
of
a
grant
from
the
Ford
Foundation
of
New
York.
In
1966
the
remit
of
the
Institute
was
expanded
to
include
social
research,
resulting
in
the
Institute
being
renamed
The
Economic
and
Social
Research
Institute
(ESRI).
In
2010
the
Institute
entered
into
a
strategic
research
alliance
with
Trinity
College
Dublin,
while
retaining
its
status
as
an
independent
research
institute.
The
ESRI
is
governed
by
an
independent
Council
which
acts
as
the
board
of
the
Institute
with
responsibility
for
guaranteeing
its
independence
and
integrity.
The
Institute’s
research
strategy
is
determined
by
the
Council
in
association
with
the
Director
and
staff.
The
research
agenda
seeks
to
contribute
to
three
overarching
and
interconnected
goals,
namely,
economic
growth,
social
progress
and
environmental
sustainability.
The
Institute’s
research
is
disseminated
through
international
and
national
peer
reviewed
journals
and
books,
in
reports
and
books
published
directly
by
the
Institute
itself
and
in
the
Institute’s
working
paper
series.
Researchers
are
responsible
for
the
accuracy
of
their
research.
All
ESRI
books
and
reports
are
peer
reviewed
and
these
publications
and
the
ESRI’s
working
papers
can
be
downloaded
from
the
ESRI
website
at
www.esri.ie
The
Institute’s
research
is
funded
from
a
variety
of
sources
including:
an
annual
grant
‐
in
‐
aid
from
the
Irish
Government;
competitive
research
grants
(both
Irish
and
international);
support
for
agreed
programmes
from
government
departments/agencies
and
commissioned
research
projects
from
public
sector
bodies.
Sponsorship
of
the
Institute’s
activities
by
Irish
business
and
membership
subscriptions
provide
a
minor
source
of
additional
income.
Quarterly
Economic
Commentary
The
Quarterly
Economic
Commentary
analyses
current
economic
trends
and
provides
macro
‐
economic
forecasts
for
the
current
and
following
year.
It
assesses
international
economic
prospects
and
provides
short
‐
term
forecasts
in
the
framework
of
a
consistent
set
of
national
accounts
for
Ireland.
Its
wide
range
of
users
includes
government
departments,
policy
‐
makers,
social
partners,
international
organisations,
academics
and
the
national
and
international
financial
sectors.
Research
Bulletin
The
Research
Bulletin
provides
short
summaries
of
work
published
by
ESRI
staff
and
overviews
of
thematic
areas
covered
by
ESRI
programmes
of
research.
Bulletin
articles
are
designed
to
be
easily
accessible
to
a
wide
readership.
A
reference
or
references
to
the
full
publication
is
included
at
the
end
of
each
Bulletin
article.
An
archive
of
bulletin
articles
will
be
found
at
www.esri.ie/bulletin
Quarterly Economic
Commentary
David Duffy Joseph Durkan Kevin Timoney Eddie Casey
Winter 2012
Research Notes
Tim Callan, Michael Savage, Elish Kelly, Seamus McGuinness, Philip O’Connell (UCD Geary Institute), Edgar Morgenroth, Brian O’Connell, Conor O’Toole, Nuša
Žnuderl, Kevin Timoney
Research Bulletins
12/4
Authors
David Duffy is a Research Officer and Editor of the Commentary, Joseph Durkan is an Associate Research Professor, Kevin Timoney is a Research Assistant and Eddie Casey (formerly a Research Assistant) at the Economic and Social Research Institute (ESRI).
The Commentary, Research Notes and Research Bulletins contained within have
Table of Contents
Summary Table ... ii
Summary ... iii
National Accounts Table 2012, 2013, 2014 ... iv
CHAPTERS 1. The International Economy ... 1
2. Exports of Goods and Services ... 5
3. Investment ... 7
4. Incomes, Price and Consumption ... 9
5. Public Finances ... 15
6. Population and the Labour Market ... 17
7. Imports and the Balance of Payments ... 23
8. Monetary Sector Developments ... 27
9. General Assessment of the Irish Economy ... 33
RESEARCH NOTES ... 43
Tax and Taxable Capacity: Ireland in Comparative Perspective – Tim Callan and Michael Savage Comparing Public and Private Sector Pay in Ireland: Size Matters – Elish Kelly, Seamus McGuinness and Philip O’Connell (UCD Geary Institute) The Regional Dimension of the Unemployment Crisis – Edgar Morgenroth Trends in Consumption since the Crisis – Brian O’Connell, Conor O’Toole andNuša Žnuderl Revisions to Population, Migration and the Labour Force, 2007-2011 – Kevin Timoney RESEARCH BULLETINS ... 93
Maternal Smoking During Pregnancy and Child Well-Being: A Burning Issue –
Cathal McCrory (TCD), Richard Layte
The Macro-Economic Effects of Raising Revenue through Different Taxes –
Thomas Conefrey (Central Bank of Ireland), John FitzGerald, Laura Malaguzzi Valeri and
Richard S. J. Tol (University of Sussex)
Telecommunications Consumers: A Behavioural Economic Analysis – Pete Lunn
The Impact of Foreign Direct Investment to China on Foreign Direct Investment to Other Countries –
Laura Resmini (Università di Milan Bicocca) and Iulia Siedschlag
ii | Quarterly Economic Commentary – Winter 2012
Summary Table
2010 2011 2012 2013 2014
Output (Real Annual Growth %)
Private Consumer Expenditure 1.0 -2.4 -1.0 -0.5 -0.5
Public Net Current Expenditure -6.5 -4.3 -3.0 -1.5 -1.5
Investment -22.6 -12.6 -3.9 3.1 3.6
Exports 6.2 5.1 2.7 3.9 4.9
Imports 3.6 -0.3 0.0 4.3 4.4
Gross Domestic Product (GDP) -0.8 1.4 1.3 1.3 2.3
Gross National Product (GNP) 0.9 -2.5 3.1 -2.0 1.4
Prices (Annual Growth %)
Consumer Price Index (CPI) -1.0 2.6 1.7 1.8 2.0
Growth in Average Hourly Earnings -1.5 0.1 1.1 1.2 1.5
Labour Market
Employment Levels (ILO basis (000s)) 1,882 1,849 1,832 1,832 1,839
Unemployment Levels (ILO basis (000s)) 303 317 322 314 307
Unemployment Rate (as % of Labour Force) 13.9 14.6 14.9 14.6 14.3
Public Finance
Exchequer Balance (€bn) -18.7 -24.9 -14.9 -15.2 -12.4
General Government Balance (€bn) -48.4 -20.2 -12.9 -12.6 -9.1
General Government Balance (% of GDP) -30.9 -12.7 -7.9 -7.5 -5.1
General Government Balance excluding bank costs
(% of GDP) -10.8 -9.0 -7.9 -7.5 -5.1
General Government Debt, % of GDP 92 106 117 121 118
External Trade
Balance of Payments Current Account (€bn) 1.8 1.8 7.8 4.3 6.9
Current Account (% of GNP) 1.4 1.4 5.9 3.2 5.0
Summary
Since the last Commentary, expectations for global economic activity have been scaled back once more. The outcome for 2012 is likely to be slightly more muted than had been expected, while any improvement in 2013 also looks set to be more subdued than previously thought. There are some signs that there could be a slight pick-up in growth in 2014. A resumption of trend growth in the eurozone would lead to an upward revision to Irish export growth forecasts, higher levels of GNP and GDP, an improvement in the public finances and a more speedy resolution of the public finances crisis.
GDP is estimated to have increased by 1.3 per cent in 2012. Export growth in 2012 was driven by a large expansion in services, while exports of goods declined. The domestic economy remained weak with contractions in household consumption, investment and government consumption. Employment levels are likely to have continued to decline and, as a result, the unemployment rate is estimated to have averaged 14.9 per cent, an increase on the 2011 average of 14.6 per cent.
This Commentary presents our firstforecast for 2014. We forecast that GDP will grow by 1.3 per cent this year and by 2.3 per cent in 2014. In 2013 and 2014 we expect exports of goods to increase and exports of services to continue to grow rapidly. Domestic demand, on the other hand, will further contract as high unemployment, fiscal adjustment and deleveraging persist. A large balance of payments surplus in 2012 is expected to remain over the forecast horizon.
The unemployment rate is forecast to decline from 14.9 per cent in 2012 to 14.6 per cent in 2013 and 14.3 per cent in 2014, mainly due to ongoing net emigration. We expect continued stabilisation in employment and the labour market over the two years.
iv | Quarterly Economic Commentary – Winter 2012
National Accounts 2012
A: Expenditure on Gross National Product2011 2012 % Change in 2012
€bn €bn Value Price Volume
Private Consumer Expenditure 81.3 81.6 0.4 1.4 -1.0
Public Net Current Expenditure 25.4 25.0 -1.6 1.5 -3.0
Gross Fixed Capital Formation 16.1 15.6 -3.3 0.6 -3.9
Exports of Goods and Services 166.8 176.9 6.1 3.3 2.7
Physical Changes in Stocks 0.2 -0.1
Final Demand 289.8 299.0 3.2 2.4 0.7
less:
Imports of Goods and Services (M) 131.9 136.8 3.7 3.7 0.0
Statistical Discrepancy 1.0 1.0
GDP at Market Prices 159.0 163.2 2.7 1.3 1.3
Net Factor Payments (F) -32.0 -31.1
GNP at Market Prices 127.0 132.1 4.0 0.9 3.1
B: Gross National Product by Origin
2011 2012 Change in 2012
€bn €bn €bn %
Agriculture 3.2 3.0 -0.3 -8.0
Non-Agriculture: Wages, etc. 67.8 68.0 0.3 0.4
Other 58.1 61.7 3.7 6.3
Adjustments: Stock Appreciation -0.6 -0.6
Statistical Discrepancy -1.0 -1.0
Net Domestic Product 127.4 131.1 3.7 2.9
Net Factor Payments -32.0 -31.1 0.8 -2.7
National Income 95.5 100.0 4.6 4.8
Depreciation 15.8 15.5 -0.3 -2.0
GNP at Factor Cost 111.3 115.5 4.2 3.8
Taxes less Subsidies 15.8 16.6 0.8 5.4
GNP at Market Prices 127.0 132.1 5.1 4.0
C: Balance of Payments on Current Account
2011 2012 Change in 2012
€bn €bn €bn
X – M 34.9 40.1 5.2
F -32.0 -31.1 0.8
Net Transfers -1.2 -1.2 0.0
Balance on Current Account 1.8 7.8 6.0
as % of GNP 1.4 5.9 4.6
National Accounts 2013
A: Expenditure on Gross National Product2012 2013 % Change in 2013
€bn €bn Value Price Volume
Private Consumer Expenditure 81.6 82.5 1.1 1.6 -0.5
Public Net Current Expenditure 25.0 25.0 0.0 1.5 -1.5
Gross Fixed Capital Formation 15.6 16.1 3.5 0.4 3.1
Exports of Goods and Services 176.9 188.0 6.2 2.3 3.9
Physical Changes in Stocks -0.1 1.0
Final Demand 299.0 312.6 4.6 1.9 2.6
less:
Imports of Goods and Services (M) 136.8 145.6 6.4 2.0 4.3
Statistical Discrepancy 1.0 1.0
GDP at Market Prices 163.2 168.1 3.0 1.6 1.3
Net Factor Payments (F) -31.1 -36.9
GNP at Market Prices 132.1 131.1 -0.7 1.3 -2.0
B: Gross National Product by Origin
2012 2013 Change in 2013
€bn €bn €bn %
Agriculture 3.0 3.2 0.2 7.5
Non-Agriculture: Wages, etc. 68.0 68.9 0.9 1.3
Other 61.7 64.9 3.1 5.1
Adjustments: Stock Appreciation -0.6 -0.6
Statistical Discrepancy -1.0 -1.0
Net Domestic Product 131.1 135.4 4.3 3.2
Net Factor Payments -31.1 -36.9 -5.8 -18.6
National Income 100.0 98.5 -1.5 -1.5
Depreciation 15.5 15.5 0.0 0.0
GNP at Factor Cost 115.5 114.0 -1.5 -1.3
Taxes less Subsidies 16.6 17.2 0.6 3.4
GNP at Market Prices 132.1 131.1 -1.0 -0.7
C: Balance of Payments on Current Account
2012 2013 Change in 2013
€bn €bn €bn
X – M 40.1 42.4 2.3
F -31.1 -36.9 -5.8
Net Transfers -1.2 -1.2 0.0
Balance on Current Account 7.8 4.3 -3.5
as % of GNP 5.9 3.3 -2.7
vi | Quarterly Economic Commentary – Winter 2012
National Accounts 2014
A: Expenditure on Gross National Product2013 2014 % Change in 2014
€bn €bn Value Price Volume
Private Consumer Expenditure 82.5 83.4 1.1 1.6 -0.5
Public Net Current Expenditure 25.0 25.0 0.0 1.5 -1.5
Gross Fixed Capital Formation 16.1 16.8 3.9 0.3 3.6
Exports of Goods and Services 188.0 203.6 8.3 3.2 4.9
Physical Changes in Stocks 1.0 2.0
Final Demand 312.6 330.8 5.8 2.5 3.2
less:
Imports of Goods and Services (M) 145.6 155.1 6.6 2.1 4.4
Statistical Discrepancy 1.0 1.1
GDP at Market Prices 168.1 176.7 5.2 2.8 2.3
Net Factor Payments (F) -36.9 -40.4
GNP at Market Prices 131.1 136.4 4.0 2.6 1.4
B: Gross National Product by Origin
2013 2014 Change in 2014
€bn €bn €bn %
Agriculture 3.2 3.5 0.3 8.5
Non-Agriculture: Wages, etc. 68.9 70.5 1.6 2.3
Other 64.9 70.1 5.2 8.0
Adjustments: Stock Appreciation -0.6 -0.6
Statistical Discrepancy -1.0 -1.1
Net Domestic Product 135.4 142.3 7.0 5.1
Net Factor Payments -36.9 -40.4 -3.4 9.3
National Income 98.5 102.0 3.5 3.6
Depreciation 15.5 16.0 0.5 3.2
GNP at Factor Cost 114.0 118.0 4.0 3.5
Taxes less Subsidies 17.2 18.4 1.2 7.2
GNP at Market Prices 131.1 136.4 5.2 4.0
C: Balance of Payments on Current Account
2013 2014 Change in 2014
€bn €bn €bn
X – M 42.4 48.4 6.1
F -36.9 -40.4 -3.4
Net Transfers -1.2 -1.2 0.0
Balance on Current Account 4.3 6.9 2.6
1
The International Economy
Since the last Commentary, expectations for global economic activity have been scaled back once more. The outcome for 2012 is likely to be slightly more muted than had been forecast, while any improvement in 2013 also looks set to be more subdued than previously thought, although there could be a slight pick-up in growth in 2014. Major issues concerning Ireland’s main trading partners relate to the pace at which decisions are being taken to alleviate policy uncertainty, the speed at which outstanding balance sheet problems are being resolved and the appropriateness of large-scale, parallel efforts to tighten fiscal policy.
US figures for the third quarter of 2012 suggested that Ireland’s second largest goods export market1 expanded at an annual rate of 3.1 per cent. The expansion
was primarily driven by rising consumer and government expenditure and a gradually recovering residential property market. Weaknesses remained evident in other major components of growth, however, with business fixed investment and exports both softening.
The debate surrounding the expiration of various fiscal measures and the very short-term solution agreed in early January continues to be a source of concern in the US and has already prompted some scale-back in growth estimates for this year. Fiscal tightening equivalent to as much as 4.1 per cent of GDP would have occurred in 2013 if political gridlock had not been avoided. In the event there were some modest changes in taxes with the removal or reduction of allowances and credits and a higher tax rate (from 35 per cent to 39.6 per cent) on incomes over $400,000. Expenditure was virtually untouched, but the authorities must return to the issue by end February. The extent to which various welfare and other expenditure measures are withdrawn or extended over future years will determine the size of this impact but the uncertainty caused by a delay in resolving these issues has constrained the recovery in private investment as well as consumer spending and will continue to do so. On a more positive note, the Federal Reserve has announced that the federal funds rate will remain in the range of 0-0.25 per cent as long as unemployment remains above 6.5 per cent, in the context of inflation remaining only marginally above the target rate. The Federal Reserve also announced that it will continue to purchase agency
1 Central Statistics Office data shows goods exports to the US were valued at €16.8 billion for the first 11 months of
2 | Quarterly Economic Commentary – Winter 2012
mortgage-backed securities at the rate of $40 billion per month, and will also purchase Treasury securities to keep long-term interest rates low. If the fiscal adjustment is muted there could be a modest pick-up in 2013 and 2014 from moderate GDP growth of around 2 per cent in 2012.
The German and French economies contracted during the fourth quarter of 2012, and economic activity across the eurozone remains stagnant. Much of this relates to the parallel efforts to tighten public finances. Improved coordination of eurozone fiscal policy would be more desirable at present as larger fiscal multipliers stemming from concurrent fiscal contractions appear to be inducing stronger negative impacts on output than would be the case where fiscal policies were more varied.2 Many economies are now attempting an economic
restructuring, whereby domestic demand is repressed, competitiveness recovered and exports expanded. The logic of this approach, when practised in unison, is highly questionable. Specifically, it is not clear whether demand will be vigorous enough in traditional eurozone markets to sustain multiple export-led recoveries if domestic demand is widely suppressed. Unlike the situation in a single country there are no internal transfers from well performing areas to poorly performing areas in the eurozone. Following an estimated contraction in 2012 of 0.5 per cent, eurozone GDP is forecast to decline by 0.1 per cent in 2013, with prospects for improvement in the second half of the year remaining fragile, before returning to growth of 1.1 per cent in 2014. This poor growth in Europe, in turn, is undermining the capacity of the Irish economy to engineer near-term growth.
Medium-term prospects for the UK economy also remain subdued, with a number of inhibiting factors restraining the emergence of a meaningful recovery. An appreciation in the nominal exchange rate (4 per cent for the year-to-date on a trade-weighted basis) is also taking its toll on export competitiveness at a time when external demand in traditional export markets, most notably the eurozone, is already highly depressed. Another over-riding factor affecting the pace of the recovery is the on-going process of balance sheet repair in the private sector following the financial crisis. UK gross household debt is currently higher than in any other G7 economy while savings rates are comparatively low. These factors combined with the simultaneous pursuit of pronounced fiscal tightening are constraining economic activity.3 If confronted with further evidence of weak
growth, the UK government may well decide to ease the pace of fiscal consolidation in the near future, though this is by no means clear at present.
2 Country simulations estimate that for an economy attempting a fiscal consolidation while the rest of the world is also
engaged in consolidation and interest rates are near zero, the negative impact on output is more than double what it would be in a scenario where the rest of the world was not engaged in such consolidation. See IMF, “Will it Hurt? Macroeconomic effects of Fiscal Consolidations,” Chapter 3 of World Economic Outlook, October 2010.
Another area that has concerned policymakers is the reduced flow of credit to businesses. The availability of cheaper funding through the Bank of England’s
Funding for Lending Scheme and the ECB announcement of outright monetary
transactions appear to have had some positive impact in terms of reducing banks’ funding costs.4 The pass-through, in terms of easing credit conditions facing
businesses as well as households, will take some time, but already signs of a significant increase in secured credit availability have emerged in the Bank’s Credit
Conditions Survey. In light of the various headwinds confronting the UK economy,
we expect that GDP will have contracted in 2012, with only a modest expansion likely in 2013.
FIGURE 1 Real GDP Growth (% change, year-on-year)
Eurozone United States United Kingdom
Sources: FocusEconomics, Eurostat, IMF, OECD, HM Treasury and Federal Reserve.
In spite of poor economic performance in all Ireland’s main markets, world trade is expected to grow more rapidly in 2013 and 2014 than in 2012. At a country level this reflects a return to very rapid growth in trade, both exports and imports, in China, India and Brazil. The recovery in these countries’ exports reflects an improvement in domestic demand in the more developed economies and the continued competitiveness of their products.
4 Outright Monetary Transactions entail the purchase by the European Central Bank (ECB) of sovereign bonds on the
primary or secondary markets and are focused on securities with a maturity of one to three years. This funding is to be provided so long as strict conditions attached to a macroeconomic adjustment programme or a precautionary programme are met. The Bank of England’s £80 billion Funding for Lending Scheme launched in July 2012 is intended to incentivise more household and business lending in the UK by providing direct central bank loans to banks or building societies below market interest rates. If these institutions subsequently decrease such lending, then the associated cost of obtaining this funding from the Bank of England is subject to an increase.
-5 -4 -3 -2 -1 0 1 2 3 4 -5 -4 -3 -2 -1 0 1 2 3 4 -5 -4 -3 -2 -1 0 1 2 3 4
4 | Quarterly Economic Commentary – Winter 2012
2
Exports of Goods and Services
Merchandise exports from Ireland have reflected the poor performance of the developed world's economies over the past two years. These exports peaked in the second quarter of 2011 and were on a downward trend to the third quarter of 2012 when there was a very modest recovery.5 Despite the recovery, it seems
that the volume of merchandise exports may have fallen by as much as 2.5 per cent in 2012. This is very much weaker than we had previously expected. Exports from indigenous companies were weak with food and drink exports particularly poor. The hope of a continued shift to exports as domestic demand was squeezed did not take place. Partly this reflected the poor international situation, but domestic supply conditions may also have been a factor. For example, milk output fell in 2012 by 2.5 per cent and cattle slaughterings were down by over 10 per cent. Production of beverages fell by 8 per cent, and while domestic demand was weak here exports did not take up the slack. The weakness in exports was somewhat surprising in that there have been substantial reductions in unit wage costs in recent years and the weakness of the euro had provided a short-term exchange rate gain. It remains very difficult to increase export sales in the face of a downturn in external demand. One consequence of the euro weakness was an increase in the deflator for exports of goods, now estimated to have increased by 5 per cent in 2012.
By contrast, exports of services in 2012 grew very rapidly. We estimate the growth at 8-9 per cent. This growth was due primarily to the expansion of recently established overseas firms in the communications and IT sectors. Within the services sector tourism receipts were weak. The recovery in the number of tourists from North America and Europe continued, but there was a decline in the number coming from Britain. Overall exports of goods and services rose by 2.7 per cent in volume in 2012.
Turning now to this year and next our forecasts are heavily influenced by the continuing weakness in the world economy. Trade in a downturn tends to weaken more than domestic demand as stock levels and world imports are driven down. Once that stock adjustment is complete then world imports tend to rise again, even though the underlying levels of demand are depressed. Thus we expect some increase in merchandise exports for this reason later this year. At the same time, significant new foreign direct investment in manufacturing took place in
5 The data for both exports and production in the pharmaceuticals sector was affected by the ending of patents in the
6 | Quarterly Economic Commentary – Winter 2012
2011/12 and the expansion of some existing companies continued apace. Finally, with regard to the traditional sector, we expect the supply situation to improve. In terms of the time profile we expect the first half of the year to remain relatively weak but thereafter exports from the indigenous sector could resume growth. If this profile proves correct then merchandise exports may increase in volume terms by close to 2 per cent this year and 2.5 per cent in 2014.
Tourism receipts in volume terms are expected to grow by about 3 per cent this year and slightly more in 2014. The numbers coming to Ireland from major markets are small relative to the size of these countries' overseas tourism. This may be one reason why numbers from North America and Europe have continued to grow. Tourists from Britain are a different matter – while the proportion of British tourists coming to Ireland is small, it is much larger than the proportion in other markets. A significant element of those from Britain is associated with visiting friends and relatives. Given the emphasis, through “The Gathering”, on attracting this part of the market (not just from Britain), we could expect an increase in numbers this year.
Other service exports are expected to continue the fast growth of recent years at about 6 per cent in volume terms. There has been an increase in the number of firms and an expansion of existing firms, so that we would expect sales to grow rapidly. While these exports now outstrip merchandise exports, there are very significant management charges associated with their operation, so that the contribution to GNP per € exported is less than for manufacturing exports from multinationals. This sector is now driving growth of approximately 4 per cent in exports of goods and services, so that it is as well to recognise that the domestic impact on the economy of a 1 per cent rise in exports is now less than a decade ago.
We expect overall exports of goods and services to grow by 3.9 per cent in volume terms in 2013 and further growth in the volume of overall exports of 4.9 per cent in 2014.
TABLE 1 Exports of Goods and Services
2011 2011 2012 2013 2014
Value Volume Change
€ billion % % % %
Merchandise 84.9 2.7 -2.5 1.8 3.5
Tourism 3.3 4.0 0.5 3.0 3.5
Other Services 78.2 7.9 8.5 6.0 6.3
Exports of Goods and Services 166.8 5.1 2.7 3.9 4.9
Note: Value of total exports of goods and services includes FISM adjustment.
3
Investment
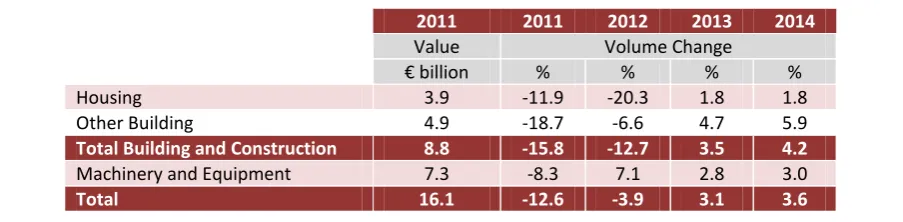
The quarterly national accounts show that the volume of investment was broadly unchanged in the first nine months of 2012, when compared with the same period in 2011, while the value of investment increased by a marginal 0.6 per cent. In part the stabilisation of investment can be explained by increased investment in aeroplanes, while other investment remains weak. Available housing statistics suggest the volume of residential construction is likely to have fallen by approximately 20 per cent in 2012, so we estimate an overall decline in building and construction of 12.7 per cent in 2012. Imports of capital goods in the first eight months of 2012 are broadly unchanged from the same period in 2011. The registration of goods vehicles was also lower in 2012, down by over 3 per cent. When this is combined with an estimated increase in investment in machinery and equipment of 7 per cent, we are expecting that total investment will have contracted by 3.9 per cent in volume terms in 2012.
FIGURE 2 Housing Market Indicators
Given the low base to which investment has declined, any small upturn is likely to see this component make a positive contribution to growth in 2013 and 2014, following five years of contraction. There are some indications that activity in the
0 10,000 20,000 30,000 40,000 50,000 60,000 70,000 80,000 90,000 100,000
2006Q1 2008Q1 2010Q1 2012Q1
Planning permissions Commencements
8 | Quarterly Economic Commentary – Winter 2012
housing market is beginning to stabilise, see Figure 2, while house prices, as measured by the CSO, recorded some growth in the second half of the year. Some increase in the volume of commercial and industrial building is also likely, on the basis of the Foreign Direct Investment announcements for 2012 and the expectation that Ireland continues to be successful in attracting such flows. As outlined in the previous Commentary, the government’s stimulus package and spending by NAMA should also contribute to an increase in activity levels. In addition, some major public sector construction projects will increase construction activity over the forecast period. Partly driven by the number of projects, but also reflecting an improvement in the economic outlook we expect that investment in machinery and equipment will continue to grow in 2013 and 2014. On the basis of the forecast for the components of investment, shown in Table 2, we are projecting that overall investment will grow by approximately 3 per cent in 2013 and by 3.6 per cent in 2014.
TABLE 2 Gross Fixed Capital Formation, % Change in Volume
2011 2011 2012 2013 2014
Value Volume Change
€ billion % % % %
Housing 3.9 -11.9 -20.3 1.8 1.8
Other Building 4.9 -18.7 -6.6 4.7 5.9
Total Building and Construction 8.8 -15.8 -12.7 3.5 4.2
Machinery and Equipment 7.3 -8.3 7.1 2.8 3.0
Total 16.1 -12.6 -3.9 3.1 3.6
[image:18.595.72.524.336.447.2]4
Incomes, Prices and Consumption
Incomes
The CSO’s advance estimate for 2012 shows income from agriculture falling by close to 9 per cent. When income in forestry and fishing is included the fall is estimated at approximately 8 per cent. Non-agricultural earnings data for the first nine months of 2012 increased marginally. However, the fall in overall employment means that we estimate aggregate non-agricultural earnings stabilised in 2012. With overall employee numbers forecast to remain unchanged in 2013 we are anticipating that aggregate non-agricultural earnings will increase by approximately 1.3 per cent. In 2014, we expect some growth in aggregate employment and average earnings to result in an increase of 2.3 per cent for non-agricultural wages. Taking account of changes in other non-non-agricultural income and current transfers, gross personal income is forecast to grow by 1 per cent this year and by a further 1.7 per cent in 2014.
When account is taken of our forecasts for personal disposable income and consumption, and data for the first nine months on personal savings from the
Quarterly Institutional Sector Accounts, it seems likely that there was a small rise
in personal savings in 2012. However, our view remains that households continue to be resource constrained and that in the current environment consumption is being maintained at the expense of savings. Thus, we expect the savings ratio to decline in 2013 to 5.3 per cent and to 5.1 per cent in 2014.
Consumer Prices
10 | Quarterly Economic Commentary – Winter 2012
TABLE 3 Inflation Measures
2011 2012 2013 2014
Annual Change
% % % %
Consumer Price Index 2.6 1.7 1.8 2.0
Personal Consumption Deflator 1.5 1.4 1.6 1.6
HICP 1.1 2.0 1.7 2.0
Source: Central Statistics Office and ESRI Forecasts.
Box 1: Behind the Headlines: Will Drug Prices Fall?
Paul K. Gorecki
Drug prices attract a lot of attention. Recent headlines vary from ‘New drug deal worth €400 million over three years,’ to ‘Bill promotes use of cheaper generic drugs by doctors’ to ‘The scandalous rise in drug costs needs to be tackled.’ Will drug prices fall to help hard pressed consumers and assist the HSE in reducing its drug budget?
Let us start by dividing drugs into two broad categories: first, new drugs, subject to patent protection; and second, old drugs that no longer have patent protection. New drugs are typically sold by the patent owner (or a licensee), while older drugs, especially if they are big sellers, are likely to also be sold by generic firms.
The ex-factory price of a new drug in Ireland is the average price charged in a basket of nine other Member States, including some higher and some lower priced countries, in which the drug is available. Since Ireland tends to be an earlier adopter and any given new drug is often only available in a limited number of higher priced Member States, the initial price for a new drug in Ireland is usually high. As the drug becomes available in lower priced Member States in the basket, such as Spain, the price in Ireland drops.
In ESRI research commissioned by the HSE6 it was suggested that new drug prices
could be lowered by setting price equal to the lowest priced Member State in the basket of nine as the benchmark rather than the average. The evidence suggested this approach would lead to a reduction of between 20 to 25 per cent in new drug prices.
Under the three year agreement between the Department of Health/HSE and the representative body for firms selling new drugs, which came into effect in November 2012, new drugs continue to be priced as the average of price across nine Member States. This suggests little change in the ex-factory price of new drugs.
6 Paul K Gorecki, Anne Nolan, Aoife Brick and Seán Lyons, 2012. Delivery of Pharmaceuticals in Ireland. Getting a Bigger
Turning now to the setting of the price of old drugs, where generic competition might be expected, the Health (Pricing and Supply of Medical Goods) Bill 2012 promises to radically reform the price setting process by:
(a) Charging the Irish Medicines Board with establishing a list of interchangeable pharmaceutical products. In other words, generic and patentee brands can be certified as interchangeable with one another. (b) Permitting the pharmacist to substitute a cheaper generic equivalent when
a more expensive product has been prescribed. At present pharmacists must dispense the brand prescribed.
(c) Establishing a single common reference price for a group of interchangeable drug products, which will be used as the reimbursement price for the HSE.
(d) Patients may pay extra for a drug product that is priced above the reference price if they wish to do so.
The critical issue in determining whether the price of old drugs with generic competition will fall is the reference price. In the ESRI research, it was suggested that for high volume old drugs where there was generic competition, a tendering process should be used to set the reference price with the winner supplying the market. Successful examples operate in New Zealand and the Canadian province of Saskatchewan.
An alternative approach to setting the reference price is to request firms to quote prices to the HSE and then select the average or the lowest to set the reference price. The basis of the quote could be the usual and customary price charged by the firm or its actual selling price net of all discounts or its best available price. However, the disadvantage with this process is that drug firms have an incentive to quote prices to the HSE that are too high and then discount off this price to the pharmacist so as to obtain market share.
The reference price could also be capped at a certain percentage of the originator’s price immediately prior to the loss of patent protection. The price cap could be based on the price decline experienced in jurisdictions with well functioning markets that are able to take advantage of generic competition. In Greece and Portugal, as part of their EU-IMF bailout packages, price caps of 40 and 50 per cent have been set. Under recent agreements with industry in Ireland price caps have been set at 50 per cent, which is likely to lead to lower priced generics.7
It is not yet clear how the reference price will be set. No details have been given in the Health (Pricing and Supply of Medical Goods) Bill 2012, the accompanying
7 This applies to the agreement between the generic manufacturers and the Department of Health and HSE, while in
12 | Quarterly Economic Commentary – Winter 2012
Explanatory Memorandum or the prior Regulatory Impact Analysis. Some of the factors to be taken into account in determining the reference price are listed in the Bill, but this does not address the issue of the reference price setting mechanism. Hence, whether prices of old drugs subject to generic competition will fall due to the enactment of the Health (Pricing and Supply of Medical Goods) Bill 2012 cannot be predicted without information on the reference price setting mechanism.
In summary, recent policy changes leave unchanged the method for determining the ex-factory price of new drugs. For old drugs where there is generic competition, while the Health (Pricing and Supply of Medical Goods) Bill 2012 is a radical move in the right direction, without knowing more about the reference price setting mechanism it is not possible to say whether prices will fall more than they otherwise would under recently negotiated agreements with industry.
TABLE 4 Personal Disposable Income
2011 2012 2013 2014
€bn €bn €bn €bn
Agriculture, etc. 3.2 3.0 3.2 3.5
Non-Agricultural Wages 67.8 68.0 68.9 70.5
Other Non-Agricultural Income 11.5 12.8 13.6 14.5
Total Income Received 82.5 83.8 85.7 88.5
Current Transfers 25.8 26.2 25.3 24.9
Gross Personal Income 108.4 110.0 111.0 113.4
Direct Personal Taxes 22.4 22.9 23.9 25.0
Personal Disposable Income 85.9 87.1 87.1 88.4
Consumption 81.3 81.6 82.5 83.4
Personal Savings 4.6 5.5 4.5 4.9
Savings Ratio 5.4 6.3 5.2 5.6
Average Personal Tax Rate 20.7 20.9 21.5 22.1
Source: Central Statistics Office and ESRI Forecasts.
Personal Consumption
The Quarterly National Accounts for the first nine months of 2012 show that the
volume of personal consumption has continued to decline, down by 1.3 per cent compared with the same period in 2011. The value of personal consumption was marginally higher, although the increase, at 0.5 per cent was modest. The personal consumption deflator grew by 1.8 per cent.
2012 improved when compared with the previous year, with particularly weak levels in December, a feature of sentiment patterns in recent years, possibly reflecting a budget impact (see Figure 3). However, the index usually shows some recovery the following month, driven in part by the January sales. These short-term indicators coupled with unemployment remaining high result in our estimate of personal consumption contracting again, although the decline will not be as great as we have seen in recent years. We now expect that, in volume terms, personal consumption will have declined by 1 per cent in 2012. Allowing for an estimated personal consumption deflator of 1.4 per cent means that growth in the value of personal consumption of 0.4 per cent is estimated for 2012.
FIGURE 3 Consumers’ Perception of Future Financial Situation and Consumer Sentiment
Source: KBC Bank/Economic and Social Research Institute.
In 2013 we continue to forecast a weak labour market, and data from the Central Bank show ongoing deleveraging households (shown in Figure 4). Data for the second quarter of 2012 show outstanding loan liabilities of €179 billion (€38,900 per capita), down from a peak of €204 billion (€45,400 per capita) in late 2008. This coupled with the impact of planned fiscal consolidation measures, means that we expect that personal consumption will contract again in 2013, although at 0.5 per cent this contraction will be much more modest than the declines of recent years. If we are correct in this expectation then personal consumption will have contracted for three consecutive years and for five out of the six years between 2008 and 2013. As is shown in the accompanying Research Note
0 20 40 60 80 100 120
Jan-01 Jan-03 Jan-05 Jan-07 Jan-09 Jan-11
Q
tr
4 1995 =
100
14 | Quarterly Economic Commentary – Winter 2012
(O’Connell et al.) the fall in per capita consumption in Ireland from peak to date has been the most severe amongst both crisis and non-crisis countries.
FIGURE 4 House Debt, Level and a Percentage of Personal Disposable Income
Source: Based on data from Central Bank of Ireland and Central Statistics Office.
With economic growth prospects strengthening, accompanied by some improvements in the labour market and a continuation in the gradual climb of consumer confidence, we would expect to see a return to annual growth in personal consumption in 2014. However, additional budget consolidation measures to be introduced in December 2013 mean we are forecasting the volume of personal consumption will contract again by 0.5 per cent in 2014.
100 120 140 160 180 200 220 240
0 20 40 60 80 100 120 140 160 180 200 220
2002 Q4
2004 Q4
2006 Q4
2008 Q4
2010 Q4
%
o
f d
isp
os
ab
le
in
co
m
e
€
billio
n
5
Public Finances
The final exchequer returns for 2012 show a healthier public finance position than at budget time, mainly due to a better than anticipated revenue performance, particularly with respect to corporation tax and income tax receipts.
For the year as a whole, overall tax revenue performed well. Despite the contraction in personal consumption, VAT revenue grew by 4.4 per cent, and although the labour market remained weak, income tax and universal social charge receipts increased by 10 per cent. Government expenditure in 2012 was broadly in line with budget targets, over-running by approximately €500 million. Over-runs in health and social protection, higher expenditure on debt servicing and a shortfall in PRSI receipts were also partially offset by under-spends in other areas.
TABLE 5 Exchequer Finances
2011 2012 2013 2014
Outcome
€bn Estimate €bn Forecast €bn Forecast €bn
Net current expenditure 48.0 49.6 50.0 49.0
Net voted expenditure 41.4 41.5 40.3 38.7
Non-voted expenditure 6.6 8.1 9.7 10.3
Current Revenue 36.8 39.4 40.5 42.2
Tax revenue 34.0 36.6 38.2 40.4
Non-Tax revenue 2.8 2.8 2.3 1.8
Current Budget Balance -11.2 -10.1 -9.4 -6.8
Capital Resources 2.5 2.3 2.0 1.6
Capital Expenditure 16.2 7.1 7.8 7.2
Capital Expenditure – Voted 4.3 3.5 3.1 2.9
Capital Expenditure - non voted 11.9 3.6 4.7 4.3
Capital Budget Balance -13.7 -4.8 -5.8 -5.6
Exchequer Balance -24.9 -14.9 -15.2 -12.4
as % of GDP -15.7 -9.1 -9.1 -7.0
General Government Balance -20.2 -12.9 -12.6 -9.1
as % of GDP -12.7 -7.9 -7.5 -5.1
16 | Quarterly Economic Commentary – Winter 2012
Budget 2013 continues the fiscal consolidation begun in 2008. The budget was less progressive than previous budgets but overall the series of austerity budgets have been progressive8.
Based on our estimate of nominal GDP for the year, the general government balance (the key indicator for the bailout programme) is estimated to be €12.9 billion, or 7.9 per cent of GDP. This is well within the target deficit of 8.6 per cent.
At this point in time it seems unlikely that this performance will be repeated in 2013. Although an improvement in economic growth and labour market stabilisation will result in higher tax revenues, our expectation is that it will continue to be difficult to reduce expenditure levels in 2013 to the extent sought by government. However, there could be sufficient momentum in changes sought in the current Croke Park negotiations to provide a significant carryover into 2014. On the other hand, the ending of the interest payment holiday on the promissory notes will add substantially to national debt interest. The proceeds of the sale of the State’s €1 billion holding of Contingent Capital Notes in Bank of Ireland will reduce the Exchequer Borrowing Requirements (EBR) but does not affect the general government balance. The underlying position, once special receipts are discounted, is difficult so that the realisation of sustainable gains depends heavily on the successful completion of the current Croke Park negotiations. If these are successful then while the position this year, when one-off and special factors are discounted, may not be ideal, the stage will be set for realising the 2014 targets.
8 “Austerity Was Toploaded In Earlier Budgets”, Tim Callan, Claire Keane, Michael Savage and John R. Walsh, The Irish
6
Population and the Labour Market
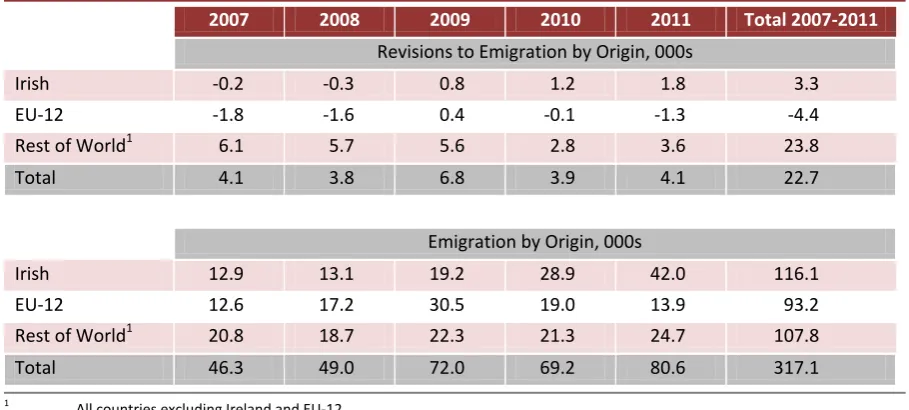
The recent Quarterly National Household Survey (QNHS) includes revisions based on the results of Census 2011 as well as containing data for the third quarter of 2012. Based on the Census results the population estimate for 2011 was revised upwards by 90,600 to 4.57 million. The new QNHS shows that the difference is concentrated in age groups more likely to migrate – the revisions are discussed in detail in the accompanying Research Note (Timoney, 2013). Table 6 shows the population aged 15 years and over in quarter 2, 2011 broken down by age group. Most of the change is concentrated in the 20-24 (+48,900) and the 35-44 (+24,400) year age groups, with an additional increase of 11,900 in the 15-19 year old age group.
TABLE 6 Working age population by age group, quarter 2, 2011, pre- and post-Census 2011
Pre-Census Census Post- Change % Change
Proportion of total
Pre-Census
Proportion of total
Post-Census
'000's '000's '000's % % %
Age, Years
15-19 269.2 281.1 11.9 4.4 7.7 7.8
20-24 249.8 298.7 48.9 19.6 7.1 8.3
25-34 752.4 756.4 4.0 0.5 21.5 21.0
35-44 668.2 692.6 24.4 3.7 19.1 19.2
45-54 576.6 578.0 1.4 0.2 16.5 16.1
55-59 243.9 243.5 -0.4 -0.2 7.0 6.8
60-64 218.4 217.2 -1.2 -0.5 6.2 6.0
65+ 524.2 531.6 7.4 1.4 15.0 14.8
All 3,502.7 3,599.1 96.4 2.8 100.0 100.0
18 | Quarterly Economic Commentary – Winter 2012
FIGURE 5 Employment Level, 000s, Pre- and Post-Census 2011 Revisions
Source: Based on CSO data.
Similarly, the overall number of persons unemployed was higher due to the higher population total. Unemployment in quarter 2, 2012 is now estimated at 323,000, having previously been estimated at 308,500.
FIGURE 6 Unemployment Level, 000s. Pre- and Post-Census 2011 Revisions
Source: Based on CSO data.
0 50 100 150 200 250 300 350
Q2 06 Q2 07 Q2 08 Q2 09 Q2 10 Q2 11 Q2 12
'0
00
s
Pre-Census 2011 Post-Census 2011 1,700
1,750 1,800 1,850 1,900 1,950 2,000 2,050 2,100 2,150 2,200
Q2 06 Q2 07 Q2 08 Q2 09 Q2 10 Q2 11 Q2 12
'0
00
s
The latest QNHS shows continued stabilisation of the labour market in 2012, with decreases in employment and the labour force considerably more moderate than those seen in the previous three years. In the third quarter, unemployment fell by 3,400 on a seasonally adjusted basis compared to the same period in 2011, which is the first such decline since the first quarter of 2005. Unlike eight years ago, however, there is no concurrent rise in employment, labour force participation and net inward migration. Employment for 2012 is expected to have fallen by 16,800, while the participation rate fell to 59.9 per cent in the second and third quarters of 2012, a low not seen since the second quarter of 2003. Net emigration, at 34,400, was 7,000 higher in the year to April 2012 than for the previous year.
Following Census 2011 revisions to population and labour market statistics, the measured unemployment rate stood at 15.0 per cent in the first quarter of 2012. Since then there have been tentative improvements, and in the third quarter there were 318,300 unemployed, corresponding to an unemployment rate of 14.8 per cent. The Live Register standardised unemployment rate has ranged between 12 and 15 per cent for the past 44 months. Data for the remaining three months of 2012 point to a decrease in unemployment for the final quarter, and we are forecasting modest improvements to 14.6 per cent in 2013 and 14.3 per cent in 2014. The falls in unemployment are not expected to reflect significant increases to employment, instead relating to on-going net outward migration. As discussed further in a Research Note in this Commentary, (Morgenroth, 2013), there is considerable variation in regional unemployment rates. The unemployment rate for all regions excluding Dublin and the South West was 16.4 per cent in the first quarter of 2012.
20 | Quarterly Economic Commentary – Winter 2012
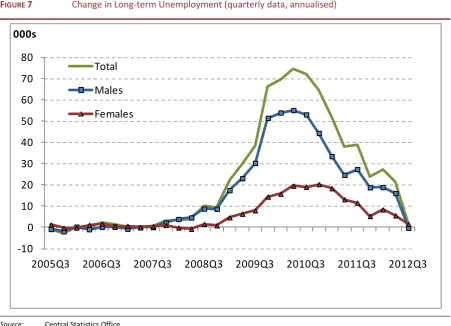
FIGURE 7 Change in Long-term Unemployment (quarterly data, annualised)
Source: Central Statistics Office.
The share of long-term unemployment in total unemployment has more than doubled since the second quarter of 2009, and currently stands at 59 per cent. Recent trends have shown signs of stabilisation for the measure, owing to high emigration and the slowdown of employment contraction that has taken place during 2012. Figure 7 shows the movement for this measure since 2005. The third quarter of 2012 saw an increase of 1,300 compared to the same period in 2011. This was the smallest annual increase in five years, while male long-term unemployment fell for the first time since the first quarter of 2007, possibly due to emigration.
Table 7 reflects revisions to labour market data post-Census 2011, with an additional 39,000 total at work in 2011 than previously estimated. The accompanying Research Note (Timoney, 2013) details the main adjustments made to the demographic profile for the inter-censal period. Following an estimated fall for 2012 of 16,800, employment is forecast to be flat for 2013, before increasing by 6,700 for 2014. In contrast the labour force is expected to continue to decline, with the labour force participation rate is expected to remain below 60 per cent. The fall in unemployment, seen in the third quarter of 2012, is forecast to continue on an annual average basis for both 2013 and 2014; annual unemployment has not decreased since 2001 (when unemployment stood at 71,600).
-10 0 10 20 30 40 50 60 70 80
2005Q3 2006Q3 2007Q3 2008Q3 2009Q3 2010Q3 2011Q3 2012Q3
000s
[image:30.595.72.524.74.400.2]TABLE 7 Employment and Unemployment
Annual Averages, 000s
2011 2012 2013 2014
Agriculture 83 84 84 84
Industry 348 334 335 340
of which: Construction 108 101 101 104
Services 1,414 1,413 1,412 1,415
Total at work 1,849 1,832 1,832 1,839
of which: non-agri. employees 1,534 1,520 1,524 1,536
self-employed 293 288 285 280
Unemployed 317 322 314 307
Labour Force 2,166 2,154 2,146 2,146
Unemployment Rate, % 14.6 14.9 14.6 14.3
Participation Rate, % 60.4 60.0 59.9 59.9
7
Imports and the Balance of Payments
Imports
Imports of goods remained flat for most of 2012. For the first nine months goods imports were running 2 per cent in volume terms below their level in the corresponding period of 2011. Preliminary figures for October and November suggest continued weakness in the fourth quarter so that the volume of goods imports could be down by 1 per cent for the year.
Services’ imports are now running at twice the level of goods imports, and are dominated by payments to parent companies arising from the very substantial service exports, primarily in the broad IT sector. Total services expenditure in volume terms increased by under 1 per cent in the first nine months of 2012 compared with the same period in 2011. The number of Irish tourists holidaying abroad was virtually unchanged between 2011 and 2012, but we expect expenditure to have declined as people sought less expensive holidays.
TABLE 8 Imports of Goods and Services, Percentage Change, Volume
2011 2011 2012 2013 2014
Value,
€bn % Volume Change % % %
Merchandise 48.3 -2.3 -1.0 3.0 4.2
Tourism 5.0 -7.2 -0.5 -2.0 -4.0
Other Services 78.2 1.4 0.6 5.5 5.0
Imports of goods and services 131.9 -0.3 0.0 4.3 4.4
Note: Value of total imports of goods and services includes FISM adjustment.
Source: Central Statistics Office and ESRI Forecasts.
24 | Quarterly Economic Commentary – Winter 2012
Other aspects of domestic demand will remain weak so that imports of consumer goods will remain subdued, although the growth we are forecasting for merchandise exports will lead to an increase in material imports. Overall goods’ imports are forecast to increase by 3 per cent in volume terms in 2013 and by 4.5 per cent in 2014.
Imports of services are expected to increase sharply in 2013 and 2014. While tourism may remain fairly flat, and well below previous peak levels, other service imports will reflect the growth in service exports. Thus, we are forecasting that overall growth in imports of goods and services will amount to 4.3 per cent in 2013 and by a similar amount in 2014.
Balance of Payments
The balance of payments surplus is now estimated at €7.8 billion in 2012. The surplus overstates the fundamental underlying situation as the data are distorted by the inflow of profits from overseas multinationals which relocated their Head Office to Ireland, but not any of their productive activities. Their worldwide profits are treated as an inflow of factor payments to Ireland but these firms pay no profit tax in Ireland as a result of double tax agreements with other countries where their productive activities are located. These foreign earnings are to varying extents not distributed to shareholders of the companies and the effect of this is to artificially raise GNP and also Gross National Income (GNI) – the measure which is used to determine Ireland’s payments to EU funds. A similar set of transactions took place in the second half of 2010, and this was mostly unwound in 2011. This time the profit inflows occurred in the second and third quarters of 2012. The reasons for these book transactions appear to be fears of additional taxes in other jurisdictions.
The effect of these transactions is to make the current account look stronger in the period when the transaction takes place and to worsen it when or if the positions are unwound. Measures of GNP are also distorted. We have argued previously that GNP is a more accurate measure of the experience of the Irish economy than GDP, but both measures must be treated with caution at present and the same types of transactions could take place in the future. The gap between GDP and GNP is widening, when allowance is made for the distortion referred to above. Transfer pricing by multinationals operating in Ireland remains an issue, making interpretation of an aggregate figure difficult.
will repatriate some of the inflows from 2012. In addition, national debt interest payments are set to rise sharply, as detailed in the section on the public finances, and to increase further in 2014.
In spite of the caveat about the data, the underlying balance of payments surplus in 2012 is substantial, reflecting the continued growth in exports from multinationals in both goods and services. Our forecasts for 2013 and 2014 see the underlying surplus remaining high, with the payments surplus amounting to 3.3 per cent of GDP by 2014. Finally, it is worth noting that while the patent cliff has led to a reduction in the value of exports (and also a reduction in the volume of output as the wholesale price of such drugs is unchanged while the value of their sales and output falls) the effect on the balance of payments is slight, as the fall in the value of sales is reflected in a reduction in profits and hence net factor payments.
TABLE 9 Balance of Payments
2011 2012 2013 2014
€bn €bn €bn €bn
Exports of goods and services 166.8 176.9 188.0 203.6
Imports of goods and services 131.9 136.8 145.6 155.1
Net factor payments -31.8 -31.1 -36.9 -40.4
Net transfers -1.2 -1.2 -1.2 -1.2
Balance on current account 1.9 7.8 4.3 6.9
As a % of GNP 1.4 5.9 3.3 5.0
8
Monetary Sector Developments
Bank Funding
Persistent stresses in the eurozone banking system moved centre stage again during the summer, with developments in Spain and Greece aggravating an already tense environment. These tensions have eased largely as a result of a timely intervention by the European Central Bank (ECB). Analysis of the domestic banking sector data, however, suggests that bank funding on the deposit side has fared better than might have been expected. While progress towards generating improved financial performance in the Irish banks has been slow to date, there have been some encouraging signs recently and moves by the European Commission to implement a single supervisory mechanism by end-2013 should also help to support access to market funding.
Deposit funding at the covered Irish banks showed some resilience during 2012, partly reflecting restored confidence in the system.9 By December 2012, customer
deposits (resident and non-resident) had risen by just over €16 billion from a trough of €140 billion in August 2011, with longer term deposits well represented.10 Indicative data suggest that roughly one-tenth of the near €9
billion increase since December 2011 has been due to exchange rate revaluations. Data from the Central Bank suggest that deposits from resident businesses, Irish and non-Irish, made up the majority of the increase in the first three quarters of the year, although households also increased savings having declined in the same period of each of the previous three years.11 Attracting deposits has proven
relatively more costly for Irish banks, although the costs associated with deposit funding have begun to improve of late (see Figure 8). Data available to November 2012 show that the weighted average interest rate reported by Irish resident banks on term deposits placed by households and Non-Financial Corporations (NFCs) fell by 32 basis points from a recent peak of 3.39 per cent in April. From January to November 2012, Irish resident banks were paying close to 66 basis points per annum more than their eurozone counterparts on household and NFC term deposits. This gap had narrowed to 51 basis points by November, but remains costly.
9 The Covered Banks include AIB Group (including EBS Building Society), Bank of Ireland Group, permanent tsb and Irish
Bank Resolution Corporation.
10 Note that these data come from the value series published by the Department of Finance. They exclude NTMA
deposits held prior to re-capitalisation and AIB’s Polish operations, while they include the acquisition of Northern Rock deposits by permanent tsb.
11 These figures adjust for changes in non-transaction related effects such as changes in reporting populations,