EUROPEAN COMMISSION
EPC Secretariat SPC Secretariat
Brussels, 31/05/2010
ARES save number(2010)221924*-Annex - REV
Annexes to the
Interim EPC-SPC Joint Report on
Table of contents
Annex 1: Main features of pension systems in the EU ... 4
Annex 2: Indexation rules and sustainability factors ... 7
Annex 3: Greater role for pre-funding of pensions... 9
Annex 4: Labour market developments 2000-2008... 11
Annex 5: Future adequacy of pensions measured by Theoretical Replacement Rates.... 14
Annex 6: Recent pension reforms in Member States... 25
Annex 7: Current pension expenditure ... 33
Annex 8: Decomposition of pension expenditure... 35
Annex 9: Detailed comparison with the 2001 and 2006 rounds of projections... 37
Annex 10: Fiscal sustainability challenges arising from ageing populations ... 42
Annex 11: Methodological issues and the Aggregate Replacement Ratio ... 50
Annex 12: European Commission spring 2010 forecast - main variables... 51
Annex 13: The potential impact of the crisis ... 55
Annex 14: Sustainability indicators in the 2009/10 SCPs ... 66
Annex 15: The total cost of ageing in the Member States ... 67
Annex 16: Pension expenditure, benefit ratio and net theoretical replacement rate... 68
Annex 17: Possible debt developments over the long-term... 76
Annex 1: Main features of pension systems in the EU
Pension arrangements are very diverse in the EU Member States, due to both different traditions on how to provide retirement income, and to different phases of the reform process of pension systems.
The large majority of pension systems in the EU 27 Member States are public pension systems. Still, several Member States have introduced occupational pension schemes and/or private mandatory and voluntary schemes. As documented by Table 1, pension arrangements are very diverse in the EU. The importance of occupational and private pension provisions varies across countries.
Regarding the type of pension benefit paid out by public earnings-related schemes, most Members States provide defined-benefit pensions, i.e. pension rights are defined in terms of earnings and service years, without a direct link to contributions. But recently, a number of Member States, including Sweden and some new Member States such as Bulgaria, Estonia, Latvia, Lithuania, Hungary, Poland and Slovakia, have switched part of their public pension schemes into private funded schemes. Typically, this provision is statutory but the insurance policy is made between the individual and the pension fund.
In most Member States, the core of the pension system is based on the statutory earnings-related old-age pension schemes. At the same time, the public pension system often provides also a minimum-guaranteed pension to those who do not qualify for the earnings-related scheme or have accrued only a small earnings-related pension. Minimum-guarantee pensions are usually means-tested and are provided either by a specific minimum pension scheme or through a general social assistance scheme. In a few Member States, notably in Denmark, the Netherlands and Ireland, the public pension system provides in the first instance a flat-rate pension, which can be supplemented by earnings-related private occupational pension schemes.
The type of benefits provided by the public pension systems differ across countries. Most pension schemes provide not only old-age pensions but also early retirement, disability and survivors’ pensions. Some countries, however, have specific schemes for some of these benefit types; in particular, some do not consider disability benefits as pensions (despite the fact that they are granted for long periods), and in some cases they are covered by the sickness insurance scheme.
The financing method of the pension systems also differ across countries. Most public pension schemes are financed on a pay-as-you-go (PAYG) basis, whereby contribution revenues are used for the payments of current pensions. In most countries, minimum guarantee pensions are covered by general taxes. Earnings-related schemes are often subsidised to varying degrees from general government funds. Some specific schemes, notably public sector employees’ pensions sometime do not constitute a well identified pension scheme but, instead, disbursements for pensions appear directly as expenditure in the government budget. On the other hand, some predominantly PAYG pension schemes have statutory requirements for partial pre-funding and, in view of the increasing pension expenditure, many governments have started to collect reserve funds for their public pension schemes.
Table 1 - Pension schemes coverage in the 2009 Ageing Report Occupatio nal pension scheme Old-age pensions Early retirement pensions Disability pensions Survivors' pensions Mandatory private scheme Voluntary Pension scheme
BE ER ER
ER (wage earner); FR (self-employed)
ER V* X V*
M young (1960) M* (prof)
CZ ER ER ER ER X X V*
DK FR & MT V FR FR* V X V
DE ER ER ER ER V* X V*
EE FR (before 1999); ER (after) X FR (before 1999); ER (after) FR (before 1999); ER (after)
X M - young
(1983) V - old*
EL ER ER ER ER X X V*
ES MT - SA*
ER – priv ; FRw -
pub.
ER – priv ; FRw -
pub.
ER - priv; FRw -
pub.
ER - priv; FRw -
pub.
V - priv; M
- pub. - V
FR ER ER ER - HC ER V - V*
IE FR MT – FR
& SA
SA: MT – FR; Contributo
ry: FR
SA: MT – FR; Contributo
ry: FR
M - pub;
V* - priv X V*
IT ER ER ER ER V* X V*
CY ER ER ER ER M - pub;
V* - priv X X
LV ER ER ER ER X
M - young (1971); V -
old
V*
LT ER ER ER FR or ER X V V*
LU FR - SA* ER ER ER ER V* X V*
HU ER ER ER ER X M - new
(1998) V*
MT ER - FR ER
Exists only to a minor extent*
X V*
NL FR - ER FR M X V*
AT ER ER ER ER M* X V*
PL ER ER ER ER V* M/V V*
PT ER ER ER ER M - prof; V
- others X V*
RO ER ER ER ER - M
-SI ER ER ER ER M * - prof;
V* - others X V
SK ER ER ER ER X M/V V*
FI ER ER ER ER V* X V*
SE ER ER ER ER V M V
UK ER X ER HC* - V* X V*
NO ER X* ER ER M* X* V*
V* ER / FR ER / FR V*
BG MT-SA ER / FR
ER (before end 2010 pensions) Public pensions Private pension scheme Minimum pension /
social allowance
MT - SA
FR FR & MT MT - SA*
FR
MT
MT
MT - FR & SA
MT & SA SA*
SA
SA
MT - SA
MT - FR*
SA* MT - SA*
MT* MT - SA
SA
FR & MT - SA FR MT*
MT - SA MT MT
Source: Commission services, EPC
Note: Cells highlighted in grey indicate the schemes not covered by the projection.
Table refers to the systems covered by the Ageing Report 2009. It should be noted that in the meantime some countries suggested major changes to their systems, e.g. Ireland.
Key:
MT … Means tested
FR … Flat rate
FRw … Flat rate by wage categories
ER … Earnings related
HC … Partly covered by health care expenditure
SA … Social allowance/assistance
X … Does not exist
V … Voluntary participation in the scheme
M … Mandatory participation in the scheme
* … Is not covered by the projection
public … Public sector employees
private … Private sector employees
new … New labour market entrants
prof … Only for selected professions
other … Other than selected professions young(X) … Only for people born in year X and after
Annex 2: Indexation rules and sustainability factors
A key determinant of pension expenditure dynamics is the indexation rule, but also automatic adjustment mechanisms introduced in some pension systems have impact on future expenditure.
Table 2 - Legal indexation rules in EU Member States
Occupational pension scheme Old-age pensions Early retirement pensions Disability pensions Survivors' pensions Mandatory private scheme Voluntary Pension scheme
BE CPI + LSA CPI + LSA CPI + LSA CPI + LSA - -
-BG 50%CPI +
50% NI 50%CPI + 50% NI (before end 2010 pensions). NR (after 2010 pensions) 50%CPI + 50% NI 50%CPI +
50% NI NR NR NR
CZ CPI + min 1/3
RI
CPI + min 1/3 RI
CPI + min 1/3 RI
CPI + min 1/3
RI - -
-DK NI NI NI NI - -
-DE NI + sust NI + sust NI + sust NI + sust - -
-EE 80% CPI +
20% NI
80% CPI + 20% NI
80% CPI + 20% NI
80% CPI +
20% NI - -
-EL NR NR NR NR - -
-ES CPI CPI CPI CPI - -
-FR CPI CPI CPI CPI - -
-IE NR NR NR NR NR - pub -
-IT CPI - size CPI - size CPI - size CPI - size - -
-CY Basic: NI;
Suppl.: CPI Basic: NI; Suppl.: CPI Basic: NI; Suppl.: CPI Basic: NI;
Suppl.: CPI NI - pub -
-LV CPI + 50% RI CPI + 50% RI CPI + 50% RI CPI + 50% RI - -
-LT NR NR NR NR - - NR
LU
CPI if CPI>2.5% &
RI re-exam(2)
CPI if CPI>2.5% &
RI re-exam(2)
CPI if CPI>2.5% &
RI re-exam(2)
CPI if CPI>2.5% &
RI re-exam(2)
- -
-HU 50% CPI +
50% NI
50% CPI + 50% NI
50% CPI + 50% NI
50% CPI +
50% NI
-At least 50%
CPI + 50% NI
-MT
COLA + NI (born before 1962); 70% NI + 30% CPI
(born after 1962)
- COLA
COLA + NI (born before 1962); 70% NI + 30% CPI
(born after 1962)
- -
-NL NI - NI NI 70% NI &
30% CPI -
-AT CPI CPI CPI CPI - -
-PL CPI + 20% RI CPI + 20% RI CPI + 20% RI CPI + 20% RI - NR NR
PT
CPI + GDP partially (size
and GDP)
CPI + GDP partially (size
and GDP)
CPI + GDP partially (size
and GDP)
CPI + GDP partially (size
and GDP)
CPI for DB 1st pillar and
re-exam(1) for the other
plans
-
-RO RI RI RI RI - NR
-SI NI and sust NI and sust NI and sust NI and sust NR NR NR
SK 50% CPI +
50% NI
50% CPI + 50% NI
50% CPI + 50% NI
50% CPI +
50% NI - NR
-FI 80% CPI +
20%NI + sust
80% CPI + 20%NI + sust
80% CPI + 20%NI + sust
80% CPI +
20%NI + sust - -
-SE NI + sust NI + sust NI + CPI NI + CPI - -
-UK CPI; NI as of
2012 - - CPI - -
-NO NI - NI NI - -
-CPI
CPI
NI
NI CPI + GDP
partially (GDP)
RI In line with
pensions
NR 2/3 COLA
NI
CPI
CPI + 20% RI CPI + 50% RI
NR CPI if CPI>2.5% &
RI re-exam(2)
-CPI NR CPI or fixed
in nominal terms NI Minimum pension / social allowance CPI + LSA
NR
LEGAL INDEXATION
Public pensions Private pension scheme
50%CPI + 50% NI
NR
NI
In line with pensions &
re-exam(5)
80% CPI + 20% NI
CPI
Key:
NR … No rule exists
RI … Real income growth
NI … Nominal income growth
GDP … GDP growth
CPI … CPI inflation
LE … Adjustment to life expectancy. LSA … Living standard adjustment COLA … Adjustmentd to cost of living
size … Adjusted by a pension size
sust … Additional adjustment due to other mechanisms such as a sustainability factor, balancing mechanism, life expectancy, value of a pension point,
maintenance of relativity between means-tested and contributory pension, etc. re-exam(X) … Reexamination of pension value every X years
min … At least
Note: Some changes have been introduced since the release of the 2009 Ageing Report as follows.
Hungary: Public pensions are indexed to CPI and, depending on GDP growth, also NI component If the real GDP growth is 3%, 100% CPI shall be applied; in case of higher GDP, the proportion of NI component gradually increases, but no more than 50% (if real GDP growth exceeds the 5%).
Romania: Public pensions are indexed to nominal income growth (100% NI).
Annex 3: Greater role for pre-funding of pensions
1Greater pre-funding, in one form or another, has been a popular policy response by Member States to the demographic challenge. The main reasons behind introduction of pre-funding have been to reduce the burden of pension expenditure for future working population and to give people the idea about the cost of pension promises at an early stage of work careers. However, it is important to note that pay-as-you-go (PAYG) is and will remain the most important element in overall pension provision for most European citizens.
As illustrated in Figure 1, privately managed funded schemes are not entirely mature in the majority of Member States where they exist. Usually a higher share of active population is covered than in the population aged 65 and more. Some pre-funding has traditionally been an important element of the overall pension system only in certain EU countries (notably in IE, NL, SE, UK and DK plus FI with its long established reserve fund).
Figure 1 - Privately managed funded pensions coverage in selected EU Member States, 2008
0 20 40 60 80 100
0 20 40 60 80 100
Current pensioners as a % of 65+
C
ov
er
age
o
f ac
tiv
e m
em
be
rs
as
a
%
o
ac
tiv
e po
pul
at
io
n
BG
FI NL*
EE CZ PL
ES
SI RO
DE
PT
UK*
BE
AT IT LU*
DK EL
Source: OECD GPS database
Note: *-2007, Maximum coverage is set at 100% for countries where more than total active population is covered
Private pension plan according to the OECD: a pension plan administered by an institution other than general government. Private pension plans may be administered directly by a private sector employer acting as the plan sponsor, a private pension fund or a private sector provider. Private pension plans may complement or substitute for public pension plans. In some countries, these may include plans for public sector workers.
1
In case of Belgium data only include autonomous pension funds.
In case of Denmark the split between active and passive members is provided only for company pension funds. Company pension plans held in insurance companies or in banks (which represent the biggest part of
occupational pension plans) and the ATP plan are not covered.
Data from Ireland come from the IAPF asset allocation survey (Irish Association of Pension Funds). This survey is based an a sample of financial institutions involved in pension fund asset management and is complemented by the largest Irish pension funds.
In the case of Germany, data only cover Pensionskassen and Pensionsfonds (German IORPs that fall under the
supervision of BaFin).
In case of Belgium, if members of both pension funds and group life insurance schemes are included, the ratio of
active members as a % of active population stands at 56.5% in 2008, while the ratio of current pensioners as a % of 65+ at 4.5%.
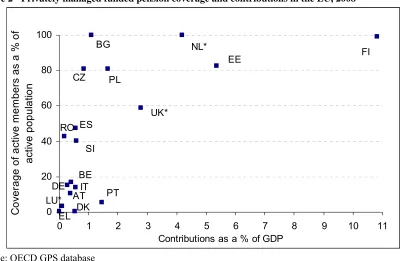
[image:10.595.94.499.259.520.2]Figure 2 demonstrates that contributions to privately managed funded pensions as a share of GDP are usually higher in countries with high coverage of active population and in countries with mature schemes. Countries with traditionally important and mature privately managed funded pensions also have higher assets as a proportion of their GDP. Nevertheless, as the schemes will mature, the share of their assets in GDP will increase and long-term projections reveal that funded pensions will play greater role in future pensioners' income than they do today in a number of Member States.
Figure 2 - Privately managed funded pension coverage and contributions in the EU, 2008
0 20 40 60 80 100
0 1 2 3 4 5 6 7 8 9 10 11
Contributions as a % of GDP
C
o
ve
rage of
ac
tiv
e
m
e
m
ber
s as
a %
o
f
ac
tiv
e
popul
at
io
n
FI EE
NL*
RO
SI ES
CZ PL
UK* BG
PT AT
BE
EL LU*
DK IT DE
Source: OECD GPS database
Note: *-2007, Maximum coverage is set at 100% for countries where more than total active population is covered
For Belgium contributions as a % of GDP represented 1.7% in 2008 if both pension funds and group life
Annex 4: Labour market developments 2000-2008
During the last decade, labour markets of the EU-27 have seen a positive development overall, in particular between 2004 and 2008. Since the beginning of the Lisbon Strategy, considerable progress had been made in EU labour markets before the crisis in financial markets deepened sharply in autumn 2008 - the overall employment rate had risen by close to 4 percentage points (pps), reaching 65.9% in 2008 (vs 62.1% in 2000), reflecting a rise in the total number of people in employment2 of around 19 million. The employment rates for women and older workers in particular showed considerable progress, reaching 59.1% and 45.6% respectively in 2008.
[image:11.595.75.492.360.648.2]Compared to 2000, by 2008 the overall employment rate in the EU-27 has risen 3.8 percentage points, the female employment rate 5.5 pps, and that for older workers 8.8 pps. As a result, the gaps relative to the Lisbon targets were respectively 4.1, 0.9 and 4.4 pps in 2008. However, one should bear in mind that the targets were originally set when the EU comprised just 15 Member States. With regard to that configuration progress towards the targets has been more substantial. The gaps in 2008 were a more limited 2.7, -0.43 and 2.6 pps respectively. As a result, the mechanical impact of the two recent enlargements has been to reduce average EU employment rates by around 1.4-1.8 percentage points, depending on the specific target.
Figure 3 – Overall, female and older workers employment rates in EU-27, 2000-2008, in %
Overall, female and older workers employment rates in EU-27 2000-2008 in %
30 35 40 45 50 55 60 65 70
2000 2001 2002 2003 2004 2005 2006 2007 2008
%
o
f r
esp
ect
ive
ag
e
p
o
p
u
la
ti
o
n
Total 15-64 Females 15-64 Total 55-64
Source: Eurostat, LFS annual data.
The greatest progress in employment has been achieved among women and older workers. Between 2000 and 2008, 39 % of the net creation of employment was contributed by women aged 25-54 and a further 38 % by 55-64 year olds (European Commission 2009a, Table 3).
2 National concept based on Eurostat LFS data.
Table 3 - Developments in overall, female and older worker's employment rates EU-27 2000-2008
EU-27 EU-25 EU-15
2000 2008 Change 2000 2008 Change 2000 2008 Change
Overall ER (%) 62.1 65.9 3.8 62.2 66.3 4.1 63.2 67.3 4.1
Female ER (%) 53.6 59.1 5.5 53.5 59.4 5.9 53.9 60.4 6.5
Older worker's ER (%) 36.8 45.6 8.8 36.4 45.7 9.3 37.5 47.4 9.9
Source: Eurostat, LFS annual data
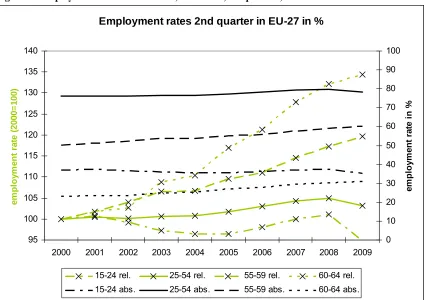
Figure 4 - Employment rates in the EU-27, 2000-2009, 2nd quarters, in %
Employment rates 2nd quarter in EU-27 in %
95 100 105 110 115 120 125 130 135 140
2000 2001 2002 2003 2004 2005 2006 2007 2008 2009
em
p
lo
y
m
e
n
t r
a
te
(2
00
0=
10
0)
0 10 20 30 40 50 60 70 80 90 100
e
m
pl
oy
m
e
n
t r
a
te
i
n
%
15-24 rel. 25-54 rel. 55-59 rel. 60-64 rel. 15-24 abs. 25-54 abs. 55-59 abs. 60-64 abs.
Source: Eurostat, LFS quarterly data on 2nd quarter
The overall impact of the crisis on labour markets still remains to be seen. While some Member States have seen much worse outcomes than others, developments since mid-2008 are marked by fallingdemand for new workers (around -30%), employment contraction
(-1.9% = 4.3 million jobs), and rising unemployment especially among groups already in a
relatively weaker labour market situation before the crisis (young people, low-skilled, migrants). Older workers have not been at particular risk of losing their job due to the crisis
so far, but they face substantial difficulties in becoming re-employed.4 While employment rates fell between the second quarters of 2008 and 2009 for younger people and especially for men, the rates further increased for older workers.
Figure 5 – Level and change in employment rate of 55-64 year old workers in Member States, 2000-2009
Level and change of employment rate of 55-64 year olds
DK DE
EE
IE
GR LV
LT LU
HU
MT
NL
AT
PL
PT
RO SK
FI
EU27 EU15
BE BG
CZ
ES
IT CY
SI
SE UK
-10 -5 0 5 10 15 20 25 30
20 30 40 50 60 70
employment rate 2000 in %
ch
a
n
g
e
20
00
- 20
09
i
n
%
p
o
in
ts
Source: Eurostat, LFS quarterly data on 2nd quarter
Figure 55 compares the level of the employment rate in 2000 with the subsequent change of the employment rate between 2000 and 2009 in percentage points. Between 2000 and 2009 on average the increase was higher in countries that had a low employment rate, thus leading to a slight convergence of rates in this period. In the second quarter of 2009, already 11 countries reached the goal of an employment rate of 50 % (SE, EE, DK, LV, UK, DE, CY, FI, NL, LT, IE, marked by a ●).
5 France is not included because of missing data for the year 2000. In the 2nd quarter of 2009, the employment
Annex 5: Future adequacy of pensions measured by
Theoretical Replacement Rates
I. Introduction
Theoretical Replacement Rates are defined as the level of pension income the first year after
retirement as a percentage of individual earnings at the moment of take-up of pensions. Theoretical replacement rates are calculated for an assumed hypothetical worker, who in the so-called "base case" has a given earnings and career profile (male, earnings of average wage constant over his fulltime 40 years career, retiring at 65, etc) and a corresponding affiliation to pension schemes (i.e. the most general schemes for private sector employees). In the so-called "variant cases" the key assumptions of the base case are changed, once at a time, (for example, variant earnings profiles or length of contributory period) in order to illustrate how the replacement rates vary for different departures from the main assumptions, and thereby to study the effects of the reforms that entail changes on the related key parameters. Replacement rates also rely on specific assumptions on the key economic and demographic parameters that are relevant for the calculation of future earnings and benefit entitlements. As opposed to other adequacy measures, such as the gross average replacement rate, theoretical
replacement rate calculations assume a constant steady state of the macroeconomic assumptions, thus isolating the effects of the pension legislations on an individual's pension. The theoretical replacement rate calculations take into consideration social security contributions to statutory and supplementary pension schemes or funds. Taxes and means-tested social benefits are included in the calculations. The gross replacement rate is defined
according to the pre-taxed income (after employer contributions, but including employee contributions). The net replacement rate is calculated as net of income taxes and employee
contributions6.
Current replacement rates for 2006 describe the situation of people who retire today, while prospective replacement rates for 2046 describe the pension income of people retiring in the
future thus also reflecting the effects of eventual pension reforms7. Results for 2006 present
the pension outcome under current legislation (enacted by 2006), including transitional rules to be implemented gradually that may be legislated in enacted reforms. This includes the currently legislated indexation rules for different benefits. The calculations do not reflect reforms that can have been decided since 2006. The calculations for 2046 typically reflect reformed pension systems in full maturity. In this way the calculations allow for an assessment of recent pension reforms on adequacy of pensions, taking into account changes that have been decided in many countries as a result of recent reforms8.
Annex 16 presents summary charts on the levels of net and gross theoretical replacement rates
of the EU Member States according to the current and prospective calculations for 2006 and
6 For more detailed information see the report "Updates of current and prospective theoretical pension
replacement rates 2006-2046",
http://ec.europa.eu/social/main.jsp?langId=en&catId=752&newsId=551&furtherNews=yes
7 While the data and information here still refers to 2006 and 2046 (the current most recent update of theoretical
replacement rates), the attempt will be to provide these figures and analysis for 2008 and 2048, once the ongoing exercise of updating and validating these figures is finalised.
8 It should be noted however, that the point at which we measure current theoretical replacement rates (currently,
2046 and a break-down into individual components of statutory and complementary provisions. However, comparability of replacement rate levels across countries is not clear-cut. In order not to misinterpret the results it is vital to consider theoretical replacement rates with information on representativeness and the assumptions, as they are calculated for a hypothetical worker. The choice of specific common assumptions about the hypothetical worker used for the calculation, such as the age of retirement and the length of the contributory period before retirement, inevitably imply that only a share of individuals are actually represented by this career scenario.
The base case, for example, is chosen in order to reflect as closely as possible current actual situations and institutional frameworks. However, given the diversity of situations across Member States, the base case may not necessarily be representative of workers in all Member States and therefore, theoretical replacement rates need to be analysed in the light of background information aimed at showing in particular how "representative" the hypothetical worker is in a specific Member State. For example, in the calculations a forty year career is typically calculated with a person entering the labour market at the age of 25 and retiring at 65. The fallback with these calculations is that the replacement rates for countries with a higher or lower legislated retirement age than that which is assumed can mean that the work incentives in the system may be over or under estimated depending on how they are legislated.
Consequently, comparability between Member States of current and projected replacement rates depends on the degree to which the commonly defined individual case is representative in different Member States. This varies considerably across Member States, impairing the direct comparability of the results based on actual replacement rate levels.
Therefore, the analysis of theoretical replacement rates in this section focus on differences in theoretical replacement rates over time or between different profiles, to assess different reforms, rather than on levels' comparison across countries. Also the interpretation of the TRR over time has to consider that it is a theoretical case, not matched by the reality of increasing average careers.
II. Changes in Theoretical Replacement Rates
First, updates of the calculations for an agreed upon average earner profile, the so-called base case are presented and analysed for the period 2006-2046. Later on, the other career and income profiles (variant cases) with a comparison to the base case are analysed.
II. 1. Base case scenario
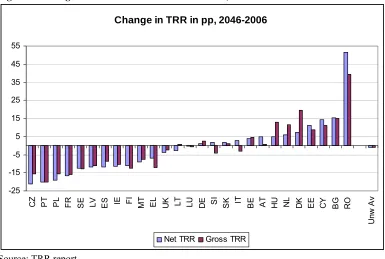
Given the assumptions described in the previous section for the calculations of theoretical replacement rates in the basecase, 11 Member States display results where reforms of statutory schemes would lead to a decrease of replacement rates between 2006 and 2046, for a worker with average earnings retiring at 65 after 40 years (see Figure 1 below, displaying the change in replacement rates from the current situation to the prospective situation). This is most probably a reflection of reforms that have lowered future benefit levels at a fixed retirement age in order to cope with increasing longevity and the expenditure it would otherwise entail. As a result many Member States have also proceeded to increase incentives to work longer.
Some of the factors that may influence the downward evolution of replacement rates for some Member States observed in Figure 1 are summarised below:
of years during the career, or as is increasingly common practice, during the entire length of the career. Several countries have extended — or are still in the process of extending — the period of an individual’s earnings history that is used for calculating the pension entitlement in the statutory pension schemes (e.g. AT, BG, CZ, ES, FR, HU, PT, FI, IT, RO). Thus, instead of using the years of highest earnings towards the end of the career for the pension benefit calculation, earnings during a much longer period or even the entire career (e.g. DE, PL, SE, RO) are taken into consideration. This change will usually lead to lower replacement rates, particularly if accrued entitlements are not fully adjusted for (nominal) wage growth.
Pension levels can also be lowered through adjustments in the pension formula used to calculate benefits. One significant development has been the introduction of a demographic adjustment factor. For countries which have introduced life expectancy adjustment factors in their statutory pension systems (e.g. DE, AT, FI, FR, IT, PL, PT, SE), this can translate into a
decrease of theoretical replacement rates. Thereby, in order to keep income replacement rate
constant, they provide incentives for people to postpone their retirement in accordance with rising life expectancy and offer opportunities for achieving adequate pension levels (see below).
Increasing the retirement age can also result in falling replacement rates where a retirement age of 65 is assumed in the calculations. For instance, in DE the rise of the legal retirement age from 65 in 2006 to 67 in 2046 gives deductions of 3.6% per year of early retirement before the age of 67, and explains some of the fall in theoretical replacement rates from the statutory pension scheme, when the retirement age is assumed at 65.
[image:16.595.73.458.450.709.2]For other group of Member States there seem to be no significant changes in their replacement rates between 2006 and 2046. And a last group of Member States may actually observe their replacement rates rise as a result of recent reforms that would be fully in place by 2046.
Figure 6 - Change in the TRR between 2006 and 2046, the "base-case" scenario9
Change in TRR in pp, 2046-2006
-25 -15 -5 5 15 25 35 45 55
CZ PT PL FR SE LV ES IE FI MT EL UK LT LU DE SI SK IT BE AT HU NL DK EE CY BG RO
Unw A
v
Net TRR Gross TRR
Source: TRR report
9 In case of HU, the changes in gross replacement rate are partially caused by a methodological change. As from
II.2. Variant cases of different earning profiles
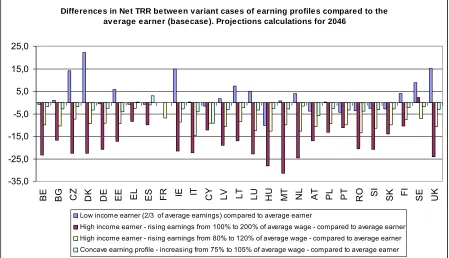
Figure 7 shows changes in prospective (2046) net theoretical replacement rates for: a) Low income earner (2/3 average wage), compared with average earner.
b) High wage earner (linear increasing earnings profile beginning at 100% of the average, ending at 200% of the average) compared with average earner.
c) High wage earner (linear increasing earnings profile beginning at 80% of the average, ending at 120% of the average) compared with average earner.
[image:17.595.73.522.258.516.2]d) Concave earning profile (increasing from 75% to 105% of average wage) compared with average earner.
Figure 7 - Differences in net TRR between variant cases of earning profiles compared to the average earner ("base-case") in 2046
Differences in Net TRR between variant cases of earning profiles compared to the average earner (basecase). Projections calculations for 2046
-35,0 -25,0 -15,0 -5,0 5,0 15,0 25,0
BE BG CZ DK DE EE EL ES FR IE IT CY LV LT LU HU MT NL AT PL PT RO SI SK FI SE UK
Low income earner (2/3 of average earnings) compared to average earner
High income earner - rising earnings from 100% to 200% of average wage - compared to average earner High income earner - rising earnings from 80% to 120% of average wage - compared to average earner Concave earning profile - increasing from 75% to 105% of average wage - compared to average earner
Source: TRR report
Figure 8 shows changes in net TRR between 2006 and 2046 for: a) Average earner retiring at age 65 after 40 years career.
b) Low income earner (2/3 average wage) retiring at age 65 after 40 years career.
b) High wage earner (linear increasing earnings profile beginning at 100% of the average, ending at 200% of the average) retiring at age 65 after 40 years career.
For workers with low earnings, mandatory schemes may tend to have a more significant role in the replacement income. Gross replacement rates are significantly higher (4 pp. or higher) for low income workers than average earners in some Member States (CZ, DK, EE, IE, LT, LU, NL, SE, UK) (Figure 2).
When studying net replacement rates, however, some Member States display a lower result for low income earner compared with average income earners (CY, HU, AT, PT, RO, SI and SK). This is because the effect of taxes and social security contributions on net replacement rates for low earners can be higher than for workers higher up the earnings scale. Low-income workers typically pay less in taxes and contributions than those on average earnings. However, in many cases, retirement incomes for those with lower earnings are at a level that does not allow them to benefit from income-tax reliefs (allowances, credits, etc). This means that in some cases low income earners may pay a larger portion of their gross pension in taxes as compared with an average earner.
Regarding the evolution replacement rates between 2006 and 2046 (Figure 3), the decline of the theoretical replacement rate between 2006 and 2046 is in many cases of a comparable magnitude (as expressed in percentage points) for a low wage earner and the average one. As replacement rates are generally higher for that type of career, this indicates that the decline in relative disposable income is projected to be lower for more modest workers.
Figure 8 - Differences in net TRR between 2006 and 2046 for different earning profiles
Differences in Net TRR between 2006 and 2046 for different earning profiles
-3
5
-1
5
5
25
45
CZ PT PL FR SE LV ES IE FI MT EL UK LT LU DE SI SK IT BE AT HU NL DK EE CY BG RO
Change in Net TRR between 2005 and 2046 for a worker with average earnings
Change in Net TRR between 2005 and 2046 for a low income earner (2/3 os average earnings)
Change in Net TRR between 2005 and 2046 for a high income earner (rising earnings from 100% to 200% of average wage)
Source: TRR report
However, for some Member States, the evolution of theoretical replacement rates appears to be very significantly less favourable for lower wages than for average wages (EE, SK, IT, EL and SE), which may reflect in some cases short transition periods associated to the introduction of a funded tier in the statutory scheme. More generally, it can be noted that a reinforcement of the link between contributions and benefits can result into a flatter profile of the evolution of replacement rates according to initial levels, which could translate into significant declines of replacement rates for more modest pensioners.
formula of pension benefits can be both progressive (lower replacement rates for higher incomes) and have redistributive elements.
In almost all Member States those with a higher earnings profile display significantly lower replacement rates compared with average earners in all Member States (Figure 2). This less favourable situation for high wage earners in Member States reflects the progressive nature of the formula of pension benefits. Furthermore, in many pension schemes the length of earnings history used in the benefit calculation is being extended, where earnings from more years are used to calculate the pension. This is often a relatively unfavourable development for those with increasing wage profiles and high departing salaries.
As compared to the base case, the evolution over time of theoretical replacement rates is in most cases lower (as expressed in percentage points) for a worker with an ascending wage profile (from 100% to 200% of the average wage) than for a flat wage profile at the level of the average wage (Figure 3). While in most Member States the evolution is not very different than in the base case (difference of about one or two percentage point), in some Members States, the evolution is less favourable of between 5 and 10 percentage points (in net terms, in DE, HU, IT, IE, LV, MT, NL, PL, PT, SI, UK).
II.3. Variant case of worker ten years after retirement
The basic definition of theoretical replacement rates reflects the income replacement at the time of retirement. But adequacy is not just about replacement levels at the time of retirement and pension take-up but also about how the value of benefits relative to prices and wages is maintained over time, especially considering that the retirement period is currently likely to last for more than 15 years for men as longevity increases.
Figure 9 – Difference in net and gross TRRs for a pensioner ten years after retirement compared to net and gross TRRs of the year of retirement ("base-case"), calculations for 2046
Difference in Net and Gross TRRs for a pensioner ten years after retirement compared to Net and Gross TRRs of the year of
retirement (basecase). Prospective calculations for 2046
-25 -20 -15 -10 -5 0 5
LU NL SI DE IE LT CY FI SE DK CZ EE BG HU LV UK BE FR PL SK IT MT ES PT AT EL RO
NET TRR GROSS TRR
Source: TRR report
and pensions in payment most often lag behind the evolution of wages. This can translate into significant declines of the level of theoretical replacement rates during the period of retirement.
Figure 9 shows, for a pensioner retiring in 2046, the difference between prospective net and gross theoretical replacement rates ten years after retirement (ie 2056) compared to those ratios at the year of retirement (2046).
According to the calculations, in all but a few Member States (e.g. LU, NL, SI) replacement rates fall significantly in all schemes ten years into retirement. This clearly reflects the wide use of less than earnings indexation in Member States, even in DC schemes once they have been converted into an annuity.
II.4. Variant cases of different retirement ages
II.4.1. A female base case worker
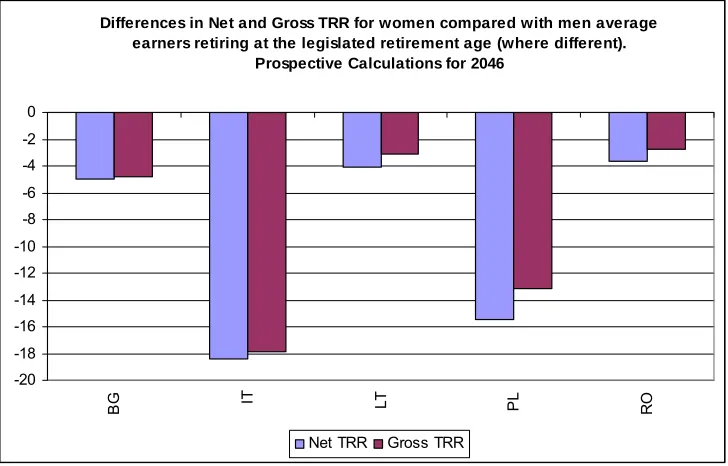
[image:20.595.74.438.450.683.2]According to current legislation the retirement age in 2046 for women will be different to that for men in some Member States. This would mean that the possible standard-career is often shorter for women due to a lower legislated retirement age (BG, IT, LT, PL, RO)10. The calculation for the variant case for a female base case worker looks at the differences in prospective replacement rates between men and women based on the lower retirement age and a consequently shorter contributory period for women in comparison to men in these countries. In these calculations retirement is assumed at the legislated retirement age for both men and women and not the assumed retirement age of 65 used in the base case calculations. The implication of this is that the length of career differs between men and women according to the statutory retirement age. Probable differences in average earnings that may exist between men and women are not considered here.
Figure 10 - Differences in net and gross TRR for women compared with men average earners retiring at the legislated retirement age (where different) in 2046
Differences in Net and Gross TRR for women compared with men average earners retiring at the legislated retirement age (where different).
Prospective Calculations for 2046
-20 -18 -16 -14 -12 -10 -8 -6 -4 -2 0
BG IT LT PL RO
Net TRR Gross TRR
Source: TRR report
10 The pension eligibility age is also different for men and women in SI, but the contributory requirements are
The gross and net replacement rate results are lower for women than for men in all Member States. The most notable gender differential in gross replacement rate is observed for IT (around 18 pp.) and PL (around 15 pp.) which both have NDC systems with actuarial reductions of the pension the earlier it is retrieved. The lower replacement rates are a result of women retiring earlier than men. In IT, for example, the calculations for women present retirement at age 60 with 35 years of work seniority as compared with retirement at 65 with 40 years seniority for men. It is however important to note that in IT women may continue to work age of 65 or beyond. The difference in the results between men and women in BG and LT are lower reflecting better protection for shorter careers for women.
II.4.2. Longer and shorter careers
In the ISG calculations a forty year career is typically calculated with a person entering the labour market at the age of 25 and retiring at 65. Results have shown a decline in future pension levels and the subsequent theoretical replacement at a given pension age. This reflects that reforms of statutory pensions aim at meeting the challenge caused by increases in life expectancy by lowering pension levels if individuals in the future still retire at the same age as today. To compensate for this decline most countries have incorporated incentives to prolong working life into their pension systems.
Figure 11 – Difference in net TRR percentage points for an average earner working until the age of 63 or 67 (ie 38 or 42 contributory years) compared with working until 65 (ie 40 years "base-case" career) in 2046
Difference in Net TRR percentage points for an average earner working until the age of 63 or 67 (ie 38 or 42 contributory years) compared with working until 65 (ie
40 years career - basecase). Prospective Calculations, 2046
-14,0 -12,0 -10,0 -8,0 -6,0 -4,0 -2,0 0,0 2,0 4,0 6,0 8,0 10,0 12,0 14,0 16,0
LU DK IE UK ES BE SI FR LT IT RO FI SE DE NL EL LV BG PL HU EE AT CZ SK PT CY MT
Difference in Net TRR after a 38 year career compared with a 40 year career Difference in Net TRR after a 42 year career compared with a 40 year career
Source: TRR report
In these variants the dynamics of work incentives can be studied by comparing a base case worker who retires at 65 with one that retires at 63 or at 67 thus decreasing and increasing the seniority of the worker. Figure below illustrates the potential economic consequences of retiring at ages 63 or 67 instead of age 65.
Calculations show that in most Member States delaying retirement results in higher theoretical replacement rates, while earlier retirement usually results in lower replacement rates. In all but a few Member States the increments in pensions for prolonged working lives are higher than the fall in replacement rates with earlier retirement.
II. 5 Variant cases with career breaks
It is an interesting development to study to what extent social protection systems not only protect the current loss of income due to care responsibilities or in the event of unemployment, but also protect future incomes in the form of pension entitlements. This is becoming increasingly important as the number of contributory years needed for a full pension is being extended in many Member States.
II.5.1. Career break for childcare years
In many Member States, absences from the labour market for childcare are typically protected to a certain extent for the first years of absence and usually the protection is equally spread over these years. In this exercise replacement rates are shown for women. Figure 12 shows the differences in prospective (2046) net theoretical replacement rates for a female average earner who makes a career break during 0, 1, 2 or 3 years for childcare compared to one with no children.
Figure 12 – Differences in net TRR for a female average earner who makes a career break during 0, 1, 2 or 3 years for childcare compared to one with no children, in 2046
Source: TRR report
In most Member States, childcare years do not give or reduce pension credits if there are no years of absence from the labour market. DE, FR, and IT have systems which provide extra pension entitlements following the birth of a child, which means that even if no actual period of childcare leave is taken, the pension will still be greater than for women with no children (in FR the increase in pensions would be greater with a third child).
up to three years (e.g. CZ, ES, LU, MT, FI) (In BE there is essentially no drop during career break of up to two years).
In all other Member States, child care years result in a drop in replacement rates compared with a woman with no children, from the first year of absence. This can be due to the features of the pension system where the link between the contributory periods and the pension where non-contributory years for child care are not taken up entirely.
II.5.2. Career break for unemployment years
Figure 8 shows the differences in prospective (2046) net theoretical replacement rates for a man who enters the labour market at 25 and leaves at the legislated retirement age for men and a man with the same profile but with career breaks of 1, 2, 3 years due to unemployment. In most Member States unemployment breaks lead to drops in replacement rates, showing bigger drops the longer the break. In most Member States, the legislated period of entitlement for unemployment breaks does not stretch out for three years, resulting in a bigger drop in replacement rates during the second or third year of unemployment. In extreme cases these become non-income and non-contributory years.
In most countries unemployment results in a loss of pension entitlements and affects the prospective replacement rate. The results show a decrease of less than 4 pp. in most Member States for three years of unemployment. This implies a considerable protection of pension entitlements in the unemployment benefit system in most Member States. In other Member States the drop in replacement rates can amount to 6 pp. or more (e.g. SK, RO, FI) bringing the adequacy of protection of pension entitlements during unemployment into question, which has to be balanced with the financial incentives for individuals to return to the labour market.
Figure 13 – Differences in net TRR for an average earner retiring at the statutory retirement age with 1, 2, or 3 years career break for unemployment at the end of career compared with no break ("base-case") in 2046
Differences in Net TRR for an average earner retiring at the statutory retirment age with 1, 2 or 3 years career break for unemployment compared with no break
(basecase). Prospective Calculations for 2046
-7 -6 -5 -4 -3 -2 -1 0 1
BE BG CZ DK DE EE EL ES FR IE IT CY LV LT LU HU MT NL AT PL PT RO SI SK FI SE UK
1 year unemployment 2 years unemployment 3 years unemployment
The analysis of variant cases is to be extended with the new cases to be simulated under the ongoing update and validation exercise for 2008-2048: higher/lower wage growth and higher/lower rate of returns.
Figure 14 - Net and gross TRR in 2006 and 2046
Net and Gross Theoretical Replacement Rates, 2006 and 2046 (sorted by ascending Net TRR in 2006)
0,0 20,0 40,0 60,0 80,0 100,0 120,0
RO EE BG CY LT DE SK SE FI BE DK UK LV PL MT CZ FR IE SI AT IT PT NL ES LU HU EL
Net TRR 2006 Net TRR 2046 Total Gross 2006 Total Gross 2046
Figure 15 – Breakdown of gross TRR: statutory and occupational pensions
Breakdown of Gross Theoretical Replacement Rates: Statutory pensions (including statutory funded schemes) and
occupational pensions
0,0 20,0 40,0 60,0 80,0 100,0 120,0
RO EE BG CY LT DE SK SE FI BE DK UK LV PL MT CZ FR IE SI AT IT PT NL ES LU HU EL
GROSS TRR Statutory pension including Statutory funded scheme 2006 GROSS TRR Statutory pension including Statutory funded scheme 2046 GROSS TRR Occupational pension 2006
Annex 6: Recent pension reforms in Member States
Recent pension reforms incorporated in the 2009 Ageing Report projections11
Belgium
The standard retirement age for women has been increased gradually from 63 in 2003 to 64 in 2006 and 65 in 2009. Retirement age remains flexible from the age of 60 for men and women, provided that a 35-year career condition is satisfied. The “older unemployment scheme”, reformed in 2002, will keep having an impact on participation rates between 50 and 58.
The law concerning the “Solidarity Pact between Generations” has come into force in 2006. It provided a series of measures to increase participation in the labour market. The statutory age for the early retirement
(“prépension”) scheme embedded in the unemployment insurance has been raised from 58 to 60 and the
eligibility conditions (career length) have been made more restrictive. Conditions for entering this scheme before
the statutory age (“prépensions” for labour market reasons) have also become tighter. Staying at work after the
age of 62 is now rewarded by a specific supplement in the pension formula (“pension bonus”). Finally, a structural mechanism for linking benefits to prosperity has been introduced.
Czech Republic
Before the pension reform in 2003, men retired at the age of 60 and women at 53-57, depending on the number of children (one year less per child). Since January 2004 with modification of the retirement age from August 2008, the age of retirement is increased constantly over time (2 months per year for men and 4 months per year for women) to reach 65 years for men and 62-65 for women (still depending on the number of children) born in 1968 and later. Bonus for later retirement is 1.5% of person’s calculation base for every additional completed 90 calendar days. Early retirements are subject to penalization, which is 0.9% of person’s calculation base for every period of 90 calendar days before the statutory retirement age up to 720 days and 1.5% from the 721st day. But resulting earnings related component must not be lower than 770 CZK (approx. 28 Euro).
Denmark
Denmark introduced in 2006 a major reform package known as the "Welfare Agreement". This reform package affects mainly younger than age 48 at the end of 2006. It reverses the 2004 decision to lower retirement age from 67 to 65. It also increases early retirement (VERB) from age 60 to age 62 between 2019 and 2022 with a minimum contribution period of 30 years instead of 25 for taking a VERB. The normal retirement age is increased from age 65 to 67 between 2024 and 2027. Finally it indexes the retirement ages to the average life expectancy of 60-years old from 2025.
Germany
Since the early nineties a series of major reforms have been passed, aiming at the financial and social sustainability of the public pension scheme. Highlighting the most important reform steps, the reform process began in the mid of the nineties with the increase of the statutory retirement age to the age of 65 years and the introduction of deductions on early retirement (3,6 % per year) accompanied with a bonus for deferred retirement (6,0 % per year). Secondly, at the beginning of this decade, a comprehensive promotion of second and third pillar pension schemes (Riester pension) by subsidising voluntary contributions was introduced. The aim of those reforms was to compensate the envisaged reduction of benefits in the statutory pension scheme by second and third pillar pensions. Thirdly, in 2005 the pension adjustment formula was augmented by a sustainability factor, which adjusts statutory pension payments to population dynamics, whereby the extent of the adjustment is determined by the change in the relation of the workforce to the number of retirees.
The most recent major reform took place in 2007. Though the transition process of increasing the retirement age to 65 years is not yet fully completed, a further increase of the statutory retirement age to the age of 67 was legislated (the age of retirement will be increased one month each year from 2012 on to 2024, then 2 months each year until the age of 67 years will be reached by 2029). The first aim of this reform was postponing the retirement age and thus decreasing the future financial burden. Secondly, the reform will partially compensate the expected decline of the workforce due to population ageing. Therefore, the increase of the retirement age is accompanied by the so-called "Initiative 50 plus" which aims to increase participation rates of older workers by a large range of different measures such as the extension of vocational training and the reduction of employment
11 The information was provided by the Members of the EPC and AWG. Detailed information on the national
barriers for older workers.
Estonia
Changes in the PAYG system include raising the retirement age for females to 63 by 2016 and revising the benefit formula. Legislation passed in mid-September 2001 set up mandatory individual accounts in the second tier (starting operations in mid-2002), while voluntary accounts became the new third tier.
Spain
The latest reform of the pension system in 2002 (Law 35/2002) abolished mandatory retirement age (65) in the private sector. Workers remaining active after 65 will increase their pension benefit by 2% per year, and both employers and employees’ are exempted from paying most social security contributions. For workers age at least 60, social contributions are reduced by 50%, and this amount is increased by 10% to reach 100% for those aged 65. Early retirement is possible from 61 year old, with at least 30 years of paid contributions and registered as unemployed for at least 6 months, but with a high penalty, from 6% to 8% per year (8% for those with only 30 years of contribution, 6% for those with at least 40 years of contribution). Pensions became compatible with part-time work (but the pension benefit was reduced according to the length of the working day).
A new law on Social Security measures was enacted in 2007. This package of reforms contains as main measures: increase in the effective contribution period to be eligible for a retirement pension; partial retirement from age 61 instead of 60 for people entering the system after 1967 (and a minimum of 30 years of contribution instead of 15); incentives for people working after age 65; more restrictive rules to get an invalidity pension.
France
The standard retirement age remains 60. Since 2004, gradual alignment of public sector with private sector by increasing the number of contribution years for entitlement to a full pension (from 37.5 to 40 years between 2004 and 2008). Since 2009, the numbers of contribution years will increase following the increase in life expectancy through a rule keeping constant the ratio of the number of contribution years and the number of years in pension to the level of 1.79 as in 2003. The number of contribution years will be increased to 41 in 2012 and 41.50 in 2020 due to the expected gains in life expectancy (by 1.5 years each 10 years). Introduction of a bonus (3% per year) in case of postponement of retirement. The penalty for early-retirement (before 40 years of contributions) will be changed. Since 2006, the amount of the penalty (la décote) will decrease gradually from 10% to 5% of pension per year of anticipation in 2015 for the private sector and will increase from 0.5% to 5% for civil servants).
Italy
Since 2006, the major changes to pension legislation concern the implementation of the 23rd July Agreement on
welfare state between government and social partners (Law 127/2007 and Law 247/2007) and Law 133/2008) improving the possibility of accumulating pension and labour income.
A. Law 127/2007:increase of lower amount pensions through an additional lump sum of 420 euro per year from
2008 (327 euro in 2007) acknowledged to pensioners of 64 and over with an income lower than 1.5 times the minimum pension (8.504,73 euro per year in 2007). Such an increase is reduced or augmented by 20% for contribution careers inferior to 15 years or superior to 25, respectively (18 and 28, for the self-employed). Additional increases are also foreseen for social assistance pensions, starting from 2008, by way of the so-called ‘social assistance additional lump sums’ (‘maggiorazioni sociali’).
B. Law 247/2007 foresees the following:
• a slowdown of the process of elevating the minimum requirements for early retirement, keeping unchanged
the phased-in values foreseen by Law 243/2004. In particular, in 2008 the age requirement, with 35 years of contribution, is 58 for the employees and 59 for the self-employed instead of 60 and 61. Starting from 2013 (it was 2014, according to Law 243/2004) the age requirement, with 35 years of contribution, is 62 for the employees and 63 for the self-employed. In addition, starting from July 2009, workers may access early retirement at an age lower by 1 year, provided that they possess at least 36 years of contributions. The age requirement may be reduced by at most 3 years (but never below the age of 57) for specific categories of
workers involved in hard and stressful jobs (‘lavori usuranti’), within a given amount of resources assigned
to a specific fund;
• the application in 2010 of the transformation coefficients, revised on the basis of the procedure foreseen by
Law 335/95. The subsequent revisions will be made every three years, instead of every ten years, through a simplified procedure falling entirely under the administrative sphere of competence;
• an increase of the contribution rate of the atypical workers by 3 percentage points (up to 26% in 2010) in
C. Law 133/2008 states that old age and seniority pensions may be fully cumulated with labour income. The new legislation improves upon the previous one which foresaw some restrictions in the possibility of cumulating, especially in the case of employees.
Latvia
Under the new three-pillar system with a defined contribution PAYG based on notional accounts, set up in 1996, the standard age requirement for women will increase by 6 months each year to reach 62 by 2008. Those for men reached 62 in 2003.
Lithuania
The standard minimum retirement age for women (55 years and 4 months in 1995, 58.5 years in 2003) will increase by 6 months each year to reach 60 years in 2006. The retirement age for men was gradually increased (2 months per year) from 60 years and 2 months (in 1995) up to 62.5 in 2003.
Hungary
The 1997 pension reform:
(1) aimed to raise gradually (by one year in every two years) the statutory pension age for men from 60 to 62 and for women from 55 to 62 by 2009;
(2) started to build up a new framework of mandatory pension system by splitting on two part, dominantly PAYG pension pillar and partly the funded pension pillar;
(3) the new mixed system (appr. 3/4 payg-1/4 funded pillar) is obliged to step in for the new entrants, for the others the choice was optional.
In 2006-2007, the Hungarian Parliament adopted (by two regulations) a package of reforms which specifies that the early retirement is allowed only 2 years before normal retirement instead of 3 before. Thus from 2013 the early retirement is possible from age 60 both for women and men. From 2013 all early pensions will be subject to a reduction. The rate of reduction, depending on the time remaining until retirement age, would be 0.3% per month for the 61-62 age-group and 0.4% per month below the age of 61. It introduces also changes in the calculation of the benefits, a minimum contribution from 40-41 for early retirement and some favourable retirement conditions for those working in potentially health-damaging occupations.
Malta
In December 2006, the Maltese Government completed the legislative process associated with the enactment of the pensions reform bill. Among the most important elements of the reform there is a staggered rise in pension age from 60 years for females and 61 years for males to 65 years for both by 2026 and the gradual lengthening of the contribution period for full entitlement to the two-thirds pension from 30 years to 40 years. Meanwhile, the calculation of pensionable income will reflect the yearly average income during the best 10 calendar years within the last forty years, as opposed to the previous regime which consisted of the best 3 years of the last ten years for employed persons and the average of the best ten years for self-employed persons. In addition, prior to the reform, the maximum pensionable income was fixed by the law though in recent years it was revised in line with the cost of living adjustment. Following the reform, maximum pensionable income will evolve in a more dynamic fashion and will be increased annually by 70 per cent of the national average wage and 30 per cent of the inflation rate as from 1 January 2014 for persons born after 1 January 1962.
Austria
The minimum retirement age for men will increase from 61.5 years to 65 years; for women the age will rise from 56.5 to 60 years. The increase will be phased in gradually beginning in July 2004 and by 2017 early retirement will be eliminated. Meanwhile, larger penalties are imposed on early retirement (4.2% of reduction per year instead of the former 3.75%, up to a maximum of 15%), within the age of 62-65. The statutory retirement age for women will be increased gradually between 2019 and 2034 to reach the retirement age for men at 65. A bonus for later retirement up to the age of 68 years (4.2% per year, up to a maximum of 10 %) is introduced. From January 2005, harmonised guaranteed pension accounts is established (Act on the harmonisation of pension system, approved in November 2004). In the new system of individual, transparent pension accounts (with a clear reporting of benefits accrued from contributions paid in and other credits acquired, such as from active child and elderly care) the key rule will be : 45-65-80 (45 contribution years, retirement age of 65 and a gross replacement rate of 80% of average life earnings). Pension benefits will be adjusted to consumer price index, starting in 2006.
Poland
for female. There will be no early pension for those born after 1948 and retiring after 2008, with the exception of miners. Since 2007, disability pension insurance contributions were reduced.
Portugal
Portugal introduced in 2007 a "Sustainability factor" linking initial benefits to average life expectancy when the worker retires (at 65, which is the legal retirement age). Individuals have the option of postponing retirement beyond legal retirement age to compensate (at least partially) the financial penalty given by the sustainability factor. They introduced also a "national strategy for the promotion of active ageing" which is a package of measures that encourages older workers to remain in the labour force (trainings, improvement of older workers employment, higher penalty in case of early retirement and benefits granted in case of long contributive careers).
Slovenia
Under the new Pension and Disability Insurance Act entered into force on 1 January 2000 (a three-pillar modernised defined benefit PAYG system plus compulsory and voluntary supplementary funded schemes), the standard retirement age has been increased. It is now possible to retire between 58 and 63 for men and 61 for women (the minimum retirement age was 53 for women and 58 for men before the reform). Women that worked before the age of 18 can retire earlier (but not before the age of 55). Special regulations reduce the age of retirement to 55 in certain cases (before the reform it was possible even below 50). The minimum retirement age is raised from 53 to 58 for women (the same level for men). The accrual rate was reduced by 2% to 1.5% since 2000. Later retirement has been encouraged: a person who fulfils the requirement for pension but continues to work beyond the age 63/61 will receive an additional pension increase (3.6% the first additional year, 2.4% the second year and 1.2% in the third, plus the normal rate of accrual, 1.5% per year).
Slovakia
Under the reformed (from 2004) three–pillar pension system, the standard retirement age has increased from 60 to 62 for men (9 month per year) by 2006 and from the former 57 (gradually reduced down to age of 53 for women who brought 5 children or more) to 62 for women by 2014. A worker can still retire earlier if the combined benefit from the first and the newly introduced second pillar equal at least 60% of the minimum living standard determined by the government. In this case, the pension is reduced by 6% per year, while a bonus of 6% is introduced for those postponing their retirement. It is also possible to get pension benefit while working.
Finland
Since 2005, flexible old-age retirement (63 to 68 years) with an increase of the accrual rate to 4.5% for those continuing to work beyond the age of 63. The ceiling on the maximum pension is abolished. A new early retirement scheme is introduced with a minimum age of 62 and an actuarial reduction of 0.6% per month prior to 63. Those borne after 1949 are not eligible for the unemployment pension scheme, which is replaced by an extended period of unemployment benefit (the so-called “unemployment pipeline to retirement (currently 57-65).
Sweden
The pension reform was approved by Parliament in 1999. Under the new notional defined contribution system is possible to retire from age 61 onwards, with an actuarially fair compensation for those who stay on in the labour force. Every year of contributions is important for the pension benefit. A person with an average wage will increase his yearly pension benefit by nearly 60 per cent if he postpones his retirement decision till age 67 compared to leaving at age 61. Yearly “statement of account” informs the individual of costs and benefits of retirement. The new system is phased in gradually for generations born between 1938 and 1953, and will affect generations born after 1953 fully.
The United Kingdom
Reforms enacted after July 2008
The projections in the 2009 Ageing Report were carried out on the basis of legislation and policies in place by July 2008. In some countries, reforms have been implemented after that date and are thus not incorporated in the projections. A brief description of recent reforms in some Member States is provided here.
Bulgaria*
Since October 1, 2008 all old-age pensions, assigned before December 31, 2007, were recalculated, using a different base which is now the 2007 average insurance income (EUR 203.6). The recalculation was made to unify pension-determining parameters (individual coefficient and length of service), and to overcome their different size.
As of 1 January 2009 the insurance contribution rate to the State Social Insurance Pensions Fund was reduced from 22% to 18%. The contribution rate of the employers was set at 10% and that of the employees - at 8%. In addition to the employers and employees, the state entered as a third party providing 12% of the overall amount of the annual contributions to the State Social Insurance Pensions Fund.
Following the change in the insurance contribution rate the total social security burden was reduced by 2.4pps for employers, while for employees it remained at the same level. Not taking into account the health insurance contribution, the social security burden dropped by 3.6pps for employers and by 0.8pps for employees.
As of January 1, 2009 the minimum pensions were increased by 10.0%.
The old-age pensions were raised as of April 1, 2009 by increasing the weight of each insurance year in the pension formula from 1 to 1.1. In addition starting from 1 April, the maximum pension amount (excluding bonuses thereto) was increased to EUR 357.9, from EUR 250.5.
As of July 1, 2009 pensions were updated by 9.0% following the so called Swiss rule.
* Changes have been incorporated in the Law on the Budget of the State Social Security for 2009 (SG N 109/23.12.2008) and the amendments in the Code of social insurance (SG.N 42/05.06.2009).
Italy
According to the Law no. 102/2009 (conversion in law, with amendments and integrations, of the Decree Law no. 78/2009) the statutory retirement age of women in the public sector (currently 60) is foreseen to increase by one year every two, starting from 2010, in order to equalise the statutory retirement age of men (currently 65) by 2018. Such intervention has been adopted to implement the sentence of the European Court of Justice imposing the elimination of any gender difference in the retirement age in the public sector. Besides, law no. 102/2009 lays down a five-year indexation mechanism linking the age retirement prerequisites to changes in life expectancy ascertained over the preceding five-year period. Such a mechanism is foreseen to be applied starting from 2015, once the increasing process of contribution and age requirements to retire, already stated by the current legislation, is fully phased in. As regards the first application of the mechanism, the increase of the statutory retirement age, related to changes in life expectancy over the preceding five-year period, cannot exceed three months. The normative dispositions concerning the technical definition and the enforcement of such an indexation mechanism will have to be enacted by 31st December, 2014.
Cyprus