1
Evaluation of the UK D.A.R.E. Primary Programme
Emily Evans
and Andromachi Tseloni
Dr Emily Evans - Corresponding author
School of Medicine and Health Sciences,
University of Nottingham,
Wollaton Road,
Nottingham, NG8 1BB, UK.
Tel: +44 (0)780 3252765
E-mail: [email protected]
ORCiD ID: 0000-0001-6673-4953
Twitter: @CJ_researcher
LinkedIn: https://uk.linkedin.com/in/emily-evans-2b37b812
Dr Andromachi Tseloni
Professor of Quantitative Criminology
Department of Sociology,
Nottingham Trent University
50 Shakespeare Street,
Nottingham NG1 4FQ, UK,
Tel. +44 (0)115 8484704
E-mail: [email protected]
2
Evaluation of the UK D.A.R.E. Primary Programme
Abstract
Aims: Results from the first evaluation of the UK Drug Abuse Resistance Education
(D.A.R.E.) Primary programme, designed and undertaken by the (independent academic)
authors on data collected in late 2015 / early 2016 by the UK providers of the programme are
presented. The evaluation assessed the programme against its learning outcomes (covering
topics including pupils’ ability to communicate and listen, handle relationships and stress,
make safe choices, get help from others) as well as their knowledge and use of substances.
Methods: Pre- and post- intervention online surveys of pupils aged 9-11 years from a
randomly assigned group of state primary schools in the English East Midlands, split between
trial and control samples. Responses from 1,496 pupils from 51 schools were analysed and
modelled via a set of ordinary least squares regression analyses, controlling for pupils’ and
schools’ characteristics.
Findings: An overall positive change between the pre- and post- survey was found, with
significant differences in the extent of change between trial and control samples regarding
four of the programme’s nine learning outcomes (getting help from others, improving
communication and listening skills, knowledge about alcohol and drugs, and making safe
choices).
Conclusions: This evaluation shows this version of D.A.R.E. to be effective regarding four of
the programme’s learning outcomes. Further research is needed to measure the programme’s
medium and long term effects and the potential benefits of D.A.R.E. officers and teachers
delivering the programme together, identified in this study.
3
Word count: 8,330 (article text including abstract, excludes required info, references,
tables/figs).
Evaluation of the UK D.A.R.E. Primary Programme
Introduction
Drug Abuse Resistance Education or D.A.R.E. was developed in 1983 in Los Angeles,
California by the County School District and Police Department before being rolled out
nationally. It spread rapidly; by the mid-1990s it had been implemented by around half of
school districts and today covers three quarters of American school districts (Caputi and
McLellan, 2017) and a number of countries across South America, Europe as well as New
Zealand, Canada and the Caribbean (Ennett et al., 1994, p. 113; Griffiths, 1999, p. 95).
D.A.R.E. has been used in the UK since 1994. Having begun in 15 schools in
Nottinghamshire, in the English East Midlands it was expanded to all interested primary
schools in the county in 1996 (Griffiths, 1999, p. 96). Since 2011 D.A.R.E. has been provided
by Life Skills Community Interest Company (C.I.C.) to those schools which chose to use the
programme. The organisation holds a franchise agreement with D.A.R.E. International and is
the sole provider of and rights holder for the programme in the UK, funding the programme
through direct payments from schools. The organisation works closely with D.A.R.E.
International using the same delivery methods and techniques as the American programme,
but with content tailored to the UK context (current curriculum being in place since 2013).
This adaptation was done alongside Professor Michael Hecht, one of the developers of the
4
The UK D.A.R.E. Primary programme has nine learning outcomes which are: to enable
pupils to improve their communication and listening skills; deal with bullying and peer
pressure regarding substance use; manage personal stress; get help from others, including the
police; assess the risks and consequences of their behaviour; and make safe and responsible
choices. In addition, developing knowledge about substances, both legal and illegal, to
achieve the above is an implicit learning outcome (Life Skills Education C.I.C., 2014, p. 1).
Content aimed at meeting these objectives is delivered in 10 one hour weekly sessions at
schools including information provision, class exercises and discussions.
The current study presents the first evaluation of the UK D.A.R.E. Primary programme. The
purpose of the evaluation was to assess the extent to which the current UK D.A.R.E. Primary
programme achieves its learning outcomes. Personal experience of substance use was also
examined but is not an explicit learning outcome of the programme. This evaluation involved
randomly selected samples of trial and control state primary schools in the English East
Midlands and employed an online questionnaire with pupils in Years 5 and 6 (aged 9-11
years) before and after the programme’s delivery in the trial schools. We therefore compared
the knowledge, attitudes and behaviours of the pupils in the trial schools on measures of these
nine outcomes with those in the control schools.
D.A.R.E. can be provided in four different models that offer different combinations of
D.A.R.E. officer and teacher input:
100% D.A.R.E. officer delivery: a trained D.A.R.E. officer delivers the full course and
attends the graduation ceremony. The teacher is required to be present at all times but has
5
50/50 delivery: The D.A.R.E. officer delivers every other session and attends the
graduation, with the teacher delivering the other half of the sessions. Teachers are able to
attend specific training events on delivering D.A.R.E. and drug and life skills education
provision in general.
Teacher-led plus delivery: The D.A.R.E. officer delivers the first lesson and attends the
graduation, the teacher delivers the rest of the course.
Teacher-led delivery: The teacher delivers the whole course there is no D.A.R.E. officer
involvement.
The effect of these delivery models on the programme’s learning outcomes was also
considered in this evaluation, although the trial schools sample was not originally designed to
do so.
Previous D.A.R.E. Evaluations
Current evidence concerning D.A.R.E. comes from the USA where it has been most widely
used and studied. Overall, the findings from the previous evaluations of the primary or
elementary programme have shown a lack of impact. These studies have used a similar
methodological approach to this evaluation, comparing trial groups of pupils who have
experienced the programme and control groups who have not, in randomly selected samples
of schools. These evaluations have concerned the original elementary D.A.R.E. programme
as well as the newer keepin’ it R.E.A.L (KiR) programme and have primarily assessed
whether the programmes affected aspects of substance use by participants. A meta-review of
the original D.A.R.E elementary programme by West and O’Neal (2004) considered only
whether the programme had prevented substance use among school pupils. It found that of
the 11 D.A.R.E. elementary programme evaluations conducted in the USA between 1991 and
6
outcomes than the control group, and in the remaining six studies D.A.R.E. participants had
marginally better outcomes than those in control groups. However, even in these latter studies
there was a lack of statistically significant results or effects persisting into adolescence when
substance use peaks. Indeed, the fact that substance use amongst primary or elementary age
pupils is very low will tend to contribute to the finding of no effect. A long term study of the
elementary programme considered the same sample of pupils at 5 and 10 years post
intervention, and found no significant differences between trial and control groups regarding
use of substances over the long term (Clayton et al., 1996; Lynam et al., 1999).
Given the lack of demonstrable effect by the original D.A.R.E. elementary programme on
substance use, the authors of the current study recognised the need to consider intermediate
variables when evaluating the UK Primary programme. Three studies of the original
programme considered such intermediate variables. Ennett et al. (1994) did find some
significant results regarding self-esteem, although only at the first post-test immediately
following the intervention. The study found no effect regarding pupil’s assertiveness and
peer-resistance skills. Clayton et al. (1996) and Lynam et al. (1999) both found short term
significant effects amongst the trial group regarding peer pressure resistance, but over the full
evaluation period the results were similar to the control group and neither study demonstrated
effects regarding pupils’ attitudes towards drugs or their assessment of substance use by their
peers, both of which are aspects of the D.A.R.E. curriculum.
The D.A.R.E. curriculum has undergone changes since its development (West and O’Neal,
2004; Griffiths, 1999; Caputi and McLellan, 2017), yet studies of updated versions of the
programme (Vincus et al., 2010) including the ‘Take Charge of Your Life’ (TCYL)
7
regarding substance misuse. Sloboda et al. (2009) also considered a number of mediating
factors. Whilst the study found that these were predictive of intentions to use substances, the
effect sizes were small (consistent statistically significant effects regarding normative beliefs
only), suggesting that additional mediators were necessary to explain use amongst those
not-using at baseline.
This version of the D.A.R.E. programme has now been replaced by the KiR curriculum,
created separately at Pennsylvania State University by a team including Professor Hecht in
the late 1980s for middle school pupils (Caputi and McLellan, 2017). The programme
consisted of 10 lessons promoting anti-drug norms and teaching resistance using four
strategies of Refuse, Explain, Avoid and Leave, hence REAL. This work was adopted and
used by D.A.R.E. to create their curriculum for both middle and elementary pupils.
A recent review of the KiR approach found no published studies of this D.A.R.E. version but
11 studies of the general approach, where the effectiveness of the curriculum on substance
use specifically was tested (Caputi and McLellan, 2017). The analysis found mixed results;
those studies which considered elementary versions of the KiR curriculum did not report
effectiveness regarding substance use. Studies where the curriculum was used with middle
school pupils, the original target group for the approach, were more likely to show an effect,
leading the authors to raise concerns regarding the appropriateness of using the KiR
programme in elementary schools.
There has been debate about the use of any drug prevention or resistance programmes in
elementary or primary schools due to the risk of normalising the use of substances to those
8
programmes involve modelling of behaviour, role playing or representations of use in videos
(Ringwalt, Hecht and Hopfer, 2010). It has also been shown however that leaving such
interventions until beyond primary school can risk pupils beginning substance use or
developing positive attitudes to it, and so becoming immune to the messages of such
programmes. Studies which have considered intermediate outcomes regarding understanding
of the curriculum have found that programmes can have positive effects with primary school
pupils. For example, a review of elementary programmes, beyond KiR (Hopfer et al., 2010),
supports their introduction and shows that it is possible to affect precursors of substance use,
such as strengthening resistance and altering norms.
Regarding KiR specifically, Chapman University (2014) conducted a short-term evaluation
of the KiR elementary programme with which it was involved in developing. It did not report
findings on pupil substance use and was not peer-reviewed and so did not appear in Caputi
and McLellan’s (2017) review. The study did consider intermediate outcomes and found that
pupils in the trial group had significantly increased their knowledge of aspects of the
curriculum, including evaluating decisions, confident communication, defining resistance and
empathy, as well as in their decision making, knowledge, and application in basic
communication skills. A lesser impact was found regarding self-management and confidence
in applying the principles of the programme, but no effect was found regarding emotional
regulation, described as a key target of the programme’s curriculum. It was also the only
study to consider attitudes of pupils towards the police, as does this current study. It found
that significantly more pupils in the trial group reported that they thought the police would
help people in need than in the control group. However, no significant results were found
with regard to the other aspects of this issue, including the friendliness of officers, whether
9
To summarise, much of the previous research on the D.A.R.E. programme concerns the
original curriculum which has not been found to be a particularly effective approach,
especially when only considering its effect on use of substances. The more recent research
has also raised concerns over effectiveness and comes exclusively from programmes in the
USA, although it does show intermediate effects. This study is the first evaluation of the UK
D.A.R.E. Primary programme which has a curriculum focused upon a broad based skill set
delivered using a participatory style, which in turn should support participants in avoiding
substance misuse or other risky behaviours. This includes providing skills in acquiring and
applying knowledge, understanding and managing emotions, setting and achieving goals,
feeling and showing empathy for others, establishing and maintaining relationships and
making responsible decisions (Chapman University, 2014, p. 3).
Methodology
Survey design
This evaluation used an online questionnaire of pupils in Years 5 and 6 (aged 9-11 years)
hosted by Smart Survey which covered the programme’s learning outcomes. The survey
questionnaire was developed by the researchers in consultation with Life Skills Education
C.I.C. The evaluation used a pre- and post- intervention comparison design with a trial and
control group of state primary schools in the English East Midlands which were randomly
selected to each group (Shadish et al., 2002). Responses from the two surveys were matched
on an individual pupil basis.
In total 213 state primary schools in the English East Midlands region run the UK D.A.R.E.
10
since its introduction to the UK. Those outside Nottinghamshire started running the
programme within the last 4 years.i A pilot survey was undertaken in three schools (7 classes,
166 pupils) and alterations were made following this. From the remaining schools, 30 schools
were picked at random from the trial (offering D.A.R.E. in the autumn term) and control
(offering D.A.R.E. in the spring or summer terms) schools, giving 60 in total. The selection
used an alphabetical list of schools in each group (trial or control) and a random number
generator. The selection probabilities were 1 over 3 for the trial schools and 1 over 4 for the
control ones. These schools were approached to take part in the evaluation, with 54 schools
providing responses in the pre-intervention survey (27 control and 27 trial schools), and 51 in
the post-intervention survey (25 control and 26 trial). The results presented below are based
on analysis of pre- and post- responses for the same individual and are based on results from
this latter group of 51 schools.
Survey procedure
The survey was run for the first time in September 2015, at the start of the school year, and
again in December 2015 once those in the trial schools had received the D.A.R.E.
programme. As a project undertaken by independent consultants the project was not
submitted to a University ethics committee. Working with Life Skills C.I.C. the research
made use of the agreements in place to work in schools for the delivery of the D.A.R.E
programme. In particular, every school involved (trial and control) agreed to take part in the
evaluation; parents/carers were provided with a consent letter to allow them to opt out of the
survey; a member of school staff and an independent invigilator were present each time the
survey was completed; the invigilators were recruited externally by Life Skills Education
C.I.C. using the pool of exam invigilators in two local schools; invigilators were provided
11
and that they answered pupil queries without affecting their responses to questionsii; finally the survey data were provided anonymously and confidentially, and parents/carers and pupils
were advised of this in appropriate language.
In total the sample consisted of 1,496 pupils who completed both the pre- and post- survey
(648 pupils from control schools, 848 pupils from trial schools). Most schools only had one
class take part in the survey, but a small number had more.iii Twelve pupils had to be
removed from the sample because the data collected to identify pupils (their initials, date of
birth, school and class codes), were the same.
It was not possible to ensure that the pupils in either group received no other relevant
intervention during the period of the evaluation. For example, most primary schools in
Nottinghamshire follow the Social and Emotional Aspects of Learning (SEAL) curriculumiv which includes work on making friends, falling out, and bullying. In addition, the county
council offers input to schools around online safety and prejudice-related bullying including
Transphobic bullying.
The sections below describe firstly the characteristics of the sample of schools and their
pupils, that the independent and control variables drew on in part, and secondly the study’s
instruments which refer to the learning outcomes and are the base of the dependent variables
12
Sample Characteristics – Independent and Control Variables
Schools
The UK D.A.R.E. Primary programme is delivered in four different models as outlined in the
Introduction. The majority of the schools in the trial sample delivered D.A.R.E. using 100%
D.A.R.E. officers (57.7%). The next most common delivery model was a 50/50 model with
teachers and D.A.R.E. officers delivering the programme together (34.6%). Just two schools
employed the other delivery models, one using teacher-led (covering 27 pupils in the sample)
and another teacher-led plus delivery (covering 48 pupils in the sample), in total accounting
for 8.8% of the pupils in the trial schools. The first three columns of Table 1 below present
this information. The delivery model of D.A.R.E. was, as mentioned, outside the researchers’
control and so not included in the design of the sample of trial schools. Future research
should randomly allocate trial schools to delivery format to assess fully the relative
effectiveness across D.A.R.E. delivery formats. However, whether different D.A.R.E.
delivery models produce varying effectiveness of the programme is an interesting question
and this study explores any differential effect of delivery model. Therefore, as mentioned
earlier, the independent variables here are whether pupils had received the UK D.A.R.E.
Primary programme and by which model, while schools and pupils’ characteristics are
control variables.
Data on the participating schools, given in Tables 1 and 2 were gathered respectively from
the government Department for Education (DfE) and the national Office for Standards in
Education, Children's Services and Skills (Ofsted) which inspects and regulates providers of
education and skills, to provide context on the sample. The first half of Table 1 compares
control and trial schools with respect to DfE data on the average proportion of pupils with
13
samples did not differ significantly with respect to any of the DfE indicators examined here
as seen in the results of respective ANOVA tests reported in the first half of Table 1. In Table
2 the data from the school’s latest Ofsted reports (where available, depending on the timings
of the inspections) showed that the majority of the schools in both samples were rated ‘Good’
on all five domains.v The two samples were found to differ marginally only on the pupil achievement domain (last row of Table 2) with more trial than control schools rated as
outstanding.
<Tables 1 and 2 about here>
Pupils
The characteristics of the pupils taking the survey are drawn from the demographic
information captured in the survey itself regarding pupil sex, age, ethnicity, religion and
family composition. These data are presented in Table 3 below.
<Table 3 about here>
The pupils responding were spilt fairly evenly between boys and girls and were most
commonly of White British ethnicity (including English / Welsh / Scottish / Northern Irish /
British backgrounds). Over half of pupils in both samples reported having no religion, whilst
over one third reported being Christian. A majority of pupils in both samples reported living
with their mother and father, in the same house. Chi-squared tests of these characteristics
found no statistically significant differences between the trial and control samples as shown
in Table 3. The only such difference found related to the year group of the pupils, with pupils
from the trial sample significantly more likely to be in Year 6 (94.6% in the trial sample as
14
programme to Year 6 pupils preferring to run it in the autumn term away from the summer
term exam period.
Instruments - Learning Outcomes Measurements and Dependent Variables
Survey questions concerned with the same learning outcome were used to create nine
measurements, reflecting the respective learning outcomes of the UK D.A.R.E. Primary
programme as listed below:
1. Improving communication and listening skills;
2. Dealing with bullying;
3. Dealing with peer pressure;
4. Managing personal stress;
5. Getting help from others;
6. Getting help from the police and trust;
7. Assessing risks and consequences of behaviour;
8. Making safe and responsible choices; and
9. Drugs, alcohol and substance abuse knowledge.
This list does not include pupil’s use of substances as this is not a direct learning outcome of
the UK D.A.R.E. Primary programme. However, questions in the survey did ask about this
topic and the relevant findings are presented in the Results section. The questions concerned
with the same learning outcome are described here together with an indication of their
internal validity (Cronbach’s alpha) estimated from all pupils’ answers in the pre-intervention
15
1. Improving communication and listening skills
The survey questions which relate to this learning outcome include questions on defining
communication; how confident pupils felt when speaking in front of groups of people;
defining confident communication; and pupil’s behaviour in the last 30 days, with regard to:
trying to keep good eye contact when talking, watching the other person's body language to
understand what they were trying to say, and when listening to someone, trying to understand
the other person’s point of view before responding. The construct of improving
communication and listening skills was therefore made out of answers to these six questions
(Cronbach’s alpha: 0.611).
2. Dealing with bullying
The survey asked pupils about defining bullying; how regularly they had taken part in
behaviour which could be described as bullying in the past 30 days (kicked, hit or punched
someone else to hurt them, said bad things about someone, sent a nasty message, teased
someone else to be mean); and how confident they would be to do something, e.g. telling a
teacher in a situation where a friend of theirs is being bullied at school.
An overall index of dealing with bullying, via recognising and avoiding engaging in bullying,
was constructed from answers to the above six questions (Cronbach’s alpha: 0.502).
3. Dealing with peer pressure
Dealing with peer pressure was constructed from answers to how confident pupils would be
to refuse substances such as alcohol, tobacco and cannabis, if they were offered them at a
friend’s house. The relevant measurement included answers to these three questions
16
4. Managing personal stress
Managing personal stress refers to pupils’ behaviours in stressful situations. Pupils were
asked how they would approach situations in which they felt worried, upset or embarrassed
and how often in the past 30 days they had been involved in various relevant behaviours
(saying something nasty to a person who made them angry; arguing with friends; whether
they tried something new, even though it made them nervous; whether someone had made
them angry; and whether pupils had had a disagreement with someone).vii The overall index
was constructed from answers to these eight questions (Cronbach’s alpha: 0.620).
5. Getting help from others
Getting help from others was constructed from questions regarding how confident pupils
would be asking someone for help in a stressful situation; whether they had tried to help
others in the past 30 days; whether there was someone in their life who was really interested
in what they did and encouraged them to do their best; and whether there was an adult they
could talk to about important things. The results section presents the relevant index based on
answers to these four questions (Cronbach’s alpha: 0.318).
6. Getting help from the police and trust
Pupils were asked whether they would be comfortable asking officers for help if they were in
trouble; whether they would cross the street to avoid the police; whether they thought that
officers were always friendly; whether they thought that officers would do their best to help
someone in need; and whether they could trust the police. Getting help from the police and
police trust was gauged via an index consisting of answers to these five questions
17
7. Assessing the risks and consequences of behaviour
Assessing risks and consequences of behaviour was measured from answers to questions
asking pupils to define a risky situation; to define a consequence; and how frequently in the
last 30 days pupils had done things without thinking of the consequences. An overall index of
risk aversion, defined as avoiding taking risks after having acquired an understanding of risk
and consequences, was constructed from answers to these three questions (Cronbach’s alpha:
0.136).
8. Making safe and responsible choices
The questions which relate to the learning outcome of making safe and responsible choices
asked pupils to define being responsible; which sources of information they thought would be
helpful when making an important decision; how confident they would feel ignoring advice
from a friend which they felt to be wrong; and what would be the responsible thing to do in a
scenario where their 16 year old cousin is looking after them for the evening and invites some
of her friends to visit when she does not have permission. Answers to these four questions
made up the index of making safe and responsible choices (Cronbach’s alpha: 0.405).
9. Drugs, alcohol and substance abuse knowledge
The UK D.A.R.E. Primary programme also aims to improve young people’s knowledge
about substances both legal and illegal. Pupils were asked to define a drug, a medicine and
addiction to a drug; to identify drugs amongst six substances (caffeinated drinks, medicine,
alcohol, tobacco, cannabis and gases, glues and aerosols); and about their knowledge of the
usage of substances amongst their age group nationally and the legality of substance use by
young people and adults. Knowledge around drugs and alcohol issues was gauged via
18
In addition to the nine learning outcomes, the survey asked about personal experience of
substance use covering alcohol, tobacco, cannabis, gases, glues or aerosols, substances which
are most likely to be used by school age children (Fuller, 2015, p. 11). Two drug, alcohol and
substance abuse measurements, ‘lifetime experience’ (Cronbach’s alpha: 0.238) and ‘past 30
days experience’ (Cronbach’s alpha: 0.244) were constructed from pupils’ answers to these
questions.
Statistical analysis
Pupils’ knowledge, attitudes and behaviour with regard to the above learning outcomes were
measured and the difference between the two measurements (before and after the
intervention) was modelled via a set of ordinary least squares (OLS) regression analyses over
the intervention, controlling for pupils’ and schools’ characteristics, as outlined in the earlier
discussion on Sample Characteristics – Independent and Control Variables and related Tables
1 to 3.viii The independent variables are sample type, a dummy variable indicating pupils from trial schools (by contrast to control schools) and a categorical variable of D.A.R.E. delivery
model (contrasting 100% D.A.R.E. officer delivery to each of the others listed previously).
First, the pre- and post- intervention difference in each learning outcome was regressed over
sample type, to give the overall effect of the programme on each learning outcome across all
schools and pupils; this forms the baseline model. Second, the programme’s delivery format
(with 100% undertaken by D.A.R.E. officers as the base) was added to gauge whether the
programme’s effectiveness varies across delivery models. This second set of regressions,
indicated as the final model, also controlled for pupils’ sex (male versus female) and year
group (year 6 versus year 5). Therefore, the baseline model gives the average effect size of
19
model effect and overcomes any omitted variables problem by including control variables (of
partial statistical significance across learning outcomes, as seen later).
In preliminary analyses (not detailed here) additional pupil characteristics, such as non-White
British ethnicity, religion (contrasting no religion to Christian, Muslim and Other) and
whether the child was living with both birth parents as well as school characteristics were
controlled for. Pupils’ ethnicity, religion and household composition and school
characteristics were generally not significant predictors of the pre- and post- intervention
difference in learning outcomes. Furthermore their inclusion did not essentially affect the
result of the evaluation and its delivery model. Therefore the more extended analyses are
briefly reported but not presented in the results section for economy and are available upon
request.
Results
This section presents the results of the evaluation, considering firstly the results for each of
the nine curriculum learning outcomes defined above, as well as findings regarding pupils’
use of substances.
Learning Outcomes
Table 4 presents the range of values, mean, and standard deviation of the dependent variables
of this analysis, including the pre- and post- intervention statistics.
<Table 4 about here>
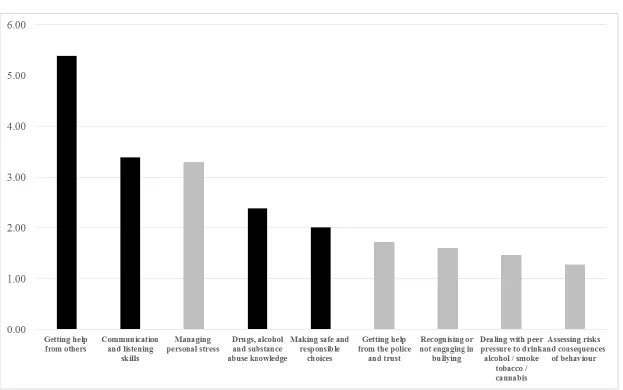
Figure 1 shows the estimated (multiplicative) effect of the programme across the nine
20
sex and school year). The heights of the bars reflect how much more pupils in the trial sample
improved with regard to the respective learning outcome compared to pupils in the control
schools between the two surveys. The learning outcomes are ordered here from highest to
lowest effect. However, only the dark coloured bars, to which we will refer in the remaining
paragraphs of this section, indicate statistically significant effects with p-values lower than
0.05.
<Figure 1 about here>
Table 5 displays the effect of the UK D.A.R.E. Primary programme across learning outcomes
in the baseline and final model. The estimated parameters of the baseline model are given in
the top part of Table 5. The results of the second set of regressions which estimate the effect
of the UK D.A.R.E. Primary programme individually and across delivery models controlling
for pupils’ sex and school year are displayed in the last section of Table 5. The covariates’
effects (with respective p-values given in parentheses) for each of the nine learning outcomes
are given in columns 2-10 of Table 5.
Together the results from Figure 1 and Table 5 show that the UK D.A.R.E. Primary
programme had an overall statistically significant effect on four of the nine learning
outcomes. Taking these in order, the programme positively affected pupils’ ability to define
communication and listening skills which increased to 3.4 times that of the control sample
after the intervention. This has been calculated as ((1.86 + 0.78) over 0.78) whereby 0.78 is
the improvement in communication and listening skills of pupils in control schools between
the two waves and 1.863 is the additional improvement of pupils in trial schools. Both values
are taken from the first column and first two rows (Part I: Baseline model) of figures in Table
21
skills of pupils in trial schools which compared to that of pupils in control schools (0.78) is
3.4 times higher (see Figure 1).
Considering the delivery model (Part II of Table 5) within the trial sample, the programme
had the highest effect when delivered via the teacher-led model with nearly 6 times higher
improvement than the control sample. This has been calculated as ((1.78 + 3.03 + 1.00) over
1.00) which equals 5.81. Similarly to the earlier calculation 1.00 is the improvement in
communication and listening skills of pupils in control schools between the two waves; 1.78
is the additional improvement of the same outcome for pupils in trial schools; and 3.03 is the
furtheradditional improvement of pupils in trial schools who received the programme via
teacher-led delivery. Due to the specification of categorical variables in regression models the
effect of 100% D.A.R.E. officer delivery model which is chosen as the base delivery category
is subsumed within that of trial schools (Johnston, 1984). Therefore the overall improvement
in communication and listening skills of pupils in trial schools with teacher-led delivery is the
sum of 1.78, 3.03 and 1.00 which is 5.81 times that of pupils in control schools. These values
can be found in the first column and second set of rows (Part II: Final model) of figures in
Table 5. The other effects can be calculated in a similar manner. Teacher-led plus delivery
gave nearly four (3.91) times increased ability, whilst D.A.R.E. 50/50 and 100% D.A.R.E.
officer delivery were equally effective at nearly three times improvement in the trial schools
pupils compared to those in the control sample (2.85 and 2.78, respectively). Pupils’ sex and
year group does not affect their ability to define communication and listening skills although
there is an indication of lower ability amongst the older pupils as indicated by the negative
but not statistically significant (at the standard p-value < 0.05 level) coefficient in Part II of
22
By contrast, the UK D.A.R.E. Primary programme did not show any significant effect on
recognising or not engaging in bullying, nor in improving dealing with peer pressure
regarding substance use or the pupils’ ability to manage personal stress overall. Having said
that, the D.A.R.E. 50/50 delivery model produced some positive but not statistically
significant results regarding peer pressure and managing personal stress (respective p-values
of 0.11 and 0.07) ix, which as such are best interpreted as confined to this study’s sample and cannot be generalised.
The highest significant effect of the programme was with respect to getting help from others.
For pupils in the trial sample this was 5.4 times higher than that of pupils in the control
sample (see Figure 1). In addition this positive effect of the programme was not conditional
on delivery model since all other coefficients in Part II of Table 5 lack statistical significance.
However, their inclusion (in Part II of Table 5) reduces the overall effect size from 5.4 to 3.1.
Getting help from the police and trusting officers was on average unaffected by the UK
D.A.R.E. Primary programme. There were however some different results in schools using
the teacher-led and teacher-led plus models, where pupils in these trial schools had more
positive attitudes towards the police, but not to a significant degree.x Preliminary bivariate analysis showed that pupils in the trial schools were significantly more likely to believe that
police officers do their best to help others, but there were no other significant differences in
the individual components of this learning outcome. In addition older, Year 6 pupils seem to
be less trusting than those in Year 5.
Assessing the risks and consequences of behaviour was another learning outcome not
23
the teacher-led plus model improved their ability to assess risks and consequences of
behaviour 2.5 times more compared to the control sample. In general, boys are significantly
less able to assess risks and consequences of behaviour compared to girls.
The UK D.A.R.E. Primary programme had significant effects on the last two learning
outcomes, making safe choices and knowledge about substances and their abuse. Pupils in the
trial schools on average doubled their ability to make safe choices compared to the control
sample (see Figure 1). In particular, trial schools pupils’ ability was improved by 2.2 times
when delivered 100% by D.A.R.E. officers (see Part II, Table 5). Furthermore, those who
received the programme via the teacher-led plus model had over a fourfold (4.4, calculated
from the estimates in Part II, Table 5) improvement. The effect of the other two delivery
models did not significantly differ from the baseline. All pupils in the trial sample improved
their drugs, alcohol and substance abuse knowledge by at least double (2.4, see also Figure 1,
and 2.3 calculated from the estimates in Parts I and II of Table 5 respectively) that of the
control sample, with no discernible variation across delivery model. Interestingly Year 6
pupils showed significantly less drugs, alcohol and substance abuse knowledge than the
younger children independently of receiving the intervention.xi
<Table 5 about here>
As noted above pupils and school characteristics (Tables 1-4) did not essentially alter the
results of the evaluation nor substantially increase the overall explanatory power of the
estimated models. However, some pupil characteristics were significantly associated with
three out of the nine learning outcomes and marginally with a further two. In particular,
Non-White British pupils were less able to recognise or avoid engaging in bulling (estimated
coefficient of -0.33 with a p-value of 0.07, hence this result is limited within the current
24
British origin. Pupils from other religions were less knowledgeable about drugs, alcohol and
substance abuse (-1.02, p-value of 0.05), and Christian pupils were less able to assess risks
and consequences of behaviour (-0.20, p-value of 0.01) than children without religion. Pupils
who live with both birth parents are more able to get help from others (0.25, p-value of 0.02).
These findings are independent of whether pupils received the programme. By contrast,
Muslim pupils, while in general being significantly less able to get help from others (-1.10,
p-value 0.00), after receiving the UK D.A.R.E. Primary programme scored 15 times higher than
pupils of other religions in the control sample (interaction coefficient between Muslim
religion and UK D.A.R.E. programme of 1.30, p-value of 0.02). These additional regressions’
results are available in detail from the second author.
Drug, alcohol and substance use
The majority of pupils in both samples reported that they had not used any of the substances
asked about. Roughly 16 percent of pupils reported having drunk alcohol before and fewer in
the last 30 days (3.1%). The vast majority of pupils in both samples reported never having
been drunk or not having been drunk in the past 30 days (fewer than 10 pupils in either
sample or survey reported the opposite). Similar low levels of usage were reported for
tobacco and gases, glues or aerosols (fewer than 2% of either sample reported having ever
used these substances) or cannabis (fewer than 1% reported ever having used cannabis).
‘Lifetime experience’ and ‘last 30 days experience’ of drinking alcohol, smoking and using
cannabis or gases, glues or aerosols as a drug were captured in respective binary variables
indicating that at least one activity had been undertaken ‘ever’ and ‘in the last 30 days’
respectively. Logistic regression analysis did not show any significant effect of the UK
25
were found to engage in this behaviour more often, regardless of age and other
characteristics.xii
Limitations
The methodology for this study has some limitations which are outlined in this section.
Firstly, the internal validity of the survey questions for each learning outcome, as measured
by Cronbach’s alphas, was in some cases quite low and indeed below the recommended level
of 0.7 in all bar one of the nine learning outcomes (dealing with peer pressure).
Secondly, the overall explanatory power of the estimated models in Table 5 is rather low with
the best results given for substance abuse knowledge and communication and listening skills.
This may be an indication that the learning outcomes depend more on pupils’ family
environment, cultural background and individual characteristics than simply the content of
the Programme; this point is further elaborated in the Discussion section.
Thirdly, the study used a very short evaluation period with the two surveys administered
three months apart. There would need to be a longitudinal follow up of pupils at appropriate
intervals, such as the first and last years of secondary school, sixth form and young adulthood
(between 19-21 years) for firmer conclusions to be drawn about the findings of this
evaluation.
Fourthly, the sample design and analysis methods used were non-hierarchical (see also
endnote viii) and the sampling design did not include the delivery model for the D.A.R.E.
programme, so that the final sample only included 75 pupils from two schools who
26
schools were analysed to see if they differed from the rest of the trial sample. These schools
had the highest percentage of pupils eligible for free school meals and lowest academic
achievement among all trial sample schools (see second half of Table 1). However, these
differences were not found to be statistically significant when tested using an ANOVA test
(final row of Table 1). In the above results the teacher-led plus delivery model was found to
be more effective with regard to a number of the learning outcomes, but, as this is based on
only one school, further investigation is required to assess the theoretical importance of this
finding.
Finally, use has been made of two external data sources, from the DfE and from Ofsted. In
both cases small amounts of data were missing for the schools in the sample, up to 17 schools
on the persistent absence variable in the DfE data. In addition, the Ofsted data are gathered
during school inspections which take place at different intervals for different schools and so
do not capture the state of schools at the same point in time.
Discussion
This evaluation has shown change between the pre- and post- intervention periods and
significant differences in the extent of change between trial and control samples with regard
to the learning outcomes of: communication and listening skills; getting help from others;
making safe choices; and knowledge about drugs, alcohol and substance abuse.
Non-significant results conditional to delivery model were found in relation to assessing risks and
consequences of behaviour, getting help from the police and trust, and managing personal
stress. By contrast, there was no improvement in dealing with bullying, peer pressure
regarding substance use, and personal experiences with drugs, alcohol and substance abuse
27
number of bullying – related initiatives in the schools which could not be controlled for or
documented during the current evaluation. As previous evaluations have found, substance
abuse is very marginal for pupils at this age and in this study usage was only measured
immediately prior to and following the delivery of the programme. Overall, the current
evaluation evidenced that the UK D.A.R.E. Primary programme has an uncontested positive
effect on four of the nine learning outcomes.
Pupil and school characteristics (Tables 1-4) did not essentially alter the results of the
evaluation nor substantially increase the overall explanatory power of the estimated models.
However, some pupil characteristics were significantly associated with three out of the nine
learning outcomes. In particular, non-white British pupils were significantly more able to
make safe choices than pupils from White British origin. Pupils from other religions were
less knowledgeable about drugs, alcohol and substance abuse, and Christian pupils were
significantly less able to assess risks and consequences of behaviour than children without
religion. Pupils who live with both birth parents are more able to get help from others. These
findings are independent of whether pupils received the programme. By contrast Muslim
pupils, while in general being significantly less able to get help from others, after receiving
the UK D.A.R.E. Primary programme scored 15 times higher than pupils in the control
sample. As noted in the above Limitations section, the results of this study perhaps indicate
that the effects of the programme will depend upon pupils’ family environment, cultural
background and individual characteristics. This mirrors findings from previous studies which
have highlighted both the importance of the home environment to the success of programmes
such as D.A.R.E (Hopfer et al., 2010) and the need for such programmes to be culturally or
28
could be used to tailor the current UK primary programme to include family components and
to make it relevant to specific groups of pupils.
As this is the first evaluation of the current UK D.A.R.E. Primary curriculum it cannot be
compared to any other studies in this country. Like previous studies of the newer curriculums,
this study evidences that normative beliefs (Sloboda et al, 2009) and knowledge about
substances, decision making and confident communication (Chapman University, 2014) are
significantly improved by the programme. Whereas, self-management and emotional
regulation, or in this study managing personal stress and recognising and not engaging in
bullying (Chapman University, 2014), and peer pressure resistance skills (Ennett et al 1994;
Clayton et al., 1996; Lynam et al., 1999) are not significantly affected. The approach of the
current D.A.R.E UK primary programme mirrors the most promising prevention approaches
for pre-adolescents found in studies to date, considering programmes beyond D.A.R.E and
KiR; it includes substance use resistance skills and norm setting in combination with general
personal and social skills (Hopfer et al., 2010).
Improvements to the curriculum regarding the learning outcomes reflecting self-management
and emotional regulation are necessary wherever it is delivered. One way of doing this is by
adjusting the delivery model; with the exception of bulling and peer pressure resistance, this
study has evidenced that when the programme is delivered in collaboration with teachers
there are positive effects on the overall unaffected learning outcomes. This runs contrary to
findings from recent D.A.R.E evaluations which find officers provide the curriculum with
greater fidelity and have greater credibility (Ringwalt, Hecht and Hopfer, 2010). However, it
reflects the findings of a review of external contributors to drugs prevention programmes
29
specialist knowledge and novelty, which can lead to good levels of involvement and
enjoyment for the pupils (White et al, 2004).
Conclusions
Drawing upon previous evaluations of D.A.R.E. programmes, this study sought to evaluate
the UK D.A.R.E. Primary programme curriculum. This evaluation employed a pre- and post-
comparison design with a trial and control group of pupils selected randomly at the school
level to examine changes across the curriculum’s learning outcomes and also considered
personal experience of drugs, alcohol and substances.
The current evaluation assessed the effects of the programme in the short term and did not
include a design of random allocation of delivery models across trial schools. Future work
could examine any medium or long term effects of the UK D.A.R.E. Primary programme and
could assess the effectiveness of the UK D.A.R.E. Secondary programme. In addition, further
research is required to discern the qualified effects of the delivery model and identify the
most effective delivery across schools and pupils of varying characteristics.
Geolocation information
Both Dr Evans and Professor Tseloni are based in Nottingham, UK. Dr Evans is based at the
University of Nottingham, and Professor Tseloni at Nottingham Trent University.
Acknowledgements
This work was commissioned by Life Skills Education C.I.C. In-kind contributions were
30
collection, and Nottinghamshire Police which supported the business case for the evaluation.
Any errors or omissions are the authors’ responsibility.
Funding details
The authors were paid as independent consultants for this work by Life Skills C.I.C., who
were supported by the College of Policing.
Disclosure of Interest Statement
The authors report that they were paid as independent consultants to undertake the evaluation
on which this article is based.
Biographical note
Dr Emily Evans is an experienced social researcher in the fields of criminal justice and
community safety. She has worked in a variety of research roles and on a large number of
research projects ranging from nation-wide evaluations for central government departments,
to smaller scale reviews of numerous community safety projects around the country and in
the Republic of Ireland. Her PhD research was a realistic evaluation of Integrated Offender
Management, a multi-agency approach to managing prolific offenders. The research was
commissioned by local criminal justice agencies and made recommendations to them. She is
currently a Research Fellow at the University of Nottingham. Details of her work and
publications can be found at: https://www.nottingham.ac.uk/medicine/people/emily.evans.
Dr Andromachi Tseloni is Professor of Quantitative Criminology with expertise in
victimisation theory and applied social statistics and leads the Quantitative and Spatial
Criminology Research Group at Nottingham Trent University. Her work revolves around five
31
capital and cross-national comparisons. In particular, her research on criminal victimisation
inequalities and falling crime rates has influenced the way victimisation is conceptualised,
measured and analysed and it informs successful crime reduction / prevention policies. She
joined the School of Social Sciences at Nottingham Trent University in September 2015,
having previously taught at a number of institutions in the UK and internationally. She is
currently Treasurer of the British Society of Criminology and member of the Nottingham
Crime and Drugs Partnership Executive Committee. Details of her professional work and
research outputs can be found at:
32
References
Caputi, T.L. and McLellan, T. (2017) ‘Truth and D.A.R.E.: Is D.A.R.E.’s new Keepin’ it
REAL curriculum suitable for American nationwide implementation?’ Drugs: Education,
Prevention and Policy 24(1) pp. 49-57.
Chapman University. (2014) ‘Report to REAL Prevention and D.A.R.E.: Pilot Evaluation and
Short-Term Efficacy Study of the D.A.R.E. Elementary kiR Curriculum’ Orange, California:
The Earl Babbie Research Centre, Chapman University.
Clayton, R. R., Cattarello, A. M. and Johnstone, B. M. (1996) ‘The Effectiveness of Drug
Abuse Resistance Education (Project D.A.R.E.): 5-Year Follow-Up Results’ Preventive
Medicine 25(3)pp.307–318.
Ennett, S., Rosenbaum, D. P., Flewelling, R. L., Bieler, G. S., Ringwalt, C. L. and Bailey, S.
L. (1994) ‘Long-Term Evaluation of Drug Abuse Resistance Education’ Addictive Behaviors
19(2) pp. 113-125.
Fuller, E. (ed.) (2015) Smoking, drinking and drug use among young people in England in
2014 Leeds: Health and Social Care Information Centre.
Gosin, M., Marsiglia, F.F., & Hecht, M.L. (2003) ‘Keepin’ it R.E.A.L.: A drug resistance
curriculum tailored to the strengths and needs of preadolescents of the southwest’ Journal of
Drug Education 33(2) pp. 119–142.
Griffiths, J. S. (1999) ‘D.A.R.E.‐ing to be Different? A Drug Prevention and Life Skills
Education Programme for Primary Schools’ Early Child Development and Care 158(1) pp.
95-105.
Hopfer, S., Davis, D., Kam, J. A., Shin, Y., Elek, E. and Hecht, M. L. (2010) ‘A review of
elementary school-based substance use prevention programs: identifying program attributes’
Journal of Drug Education 40(1) pp. 11–36.
33
Life Skills Education C.I.C. (2014) Primary Drug Abuse Resistance Education Workbook
Mansfield, Nottinghamshire: Life Skills Education C.I.C.
Lynam, D. R., Milich, R., Zimmerman, R., Novak, S. P., Logan, T. K., Martin, C., Leukefeld,
C. and Clayton, R. (1999) ‘Project D.A.R.E.: No effects at 10-year follow-up’ Journal of
Consulting and Clinical Psychology 67(4) pp. 590-593.
Ringwalt, C., Hecht, M. and Hopfer, S. (2010) ‘Drug prevention in elementary schools: an
introduction to the special issue’ Journal of Drug Education 40(1) pp. 1-9.
Shadish, W. R., Cook, T. D., Campbell, D. T. (2002) Experimental and Quasi-Experimental
Designs for Generalized Causal Inference. Boston: Houghton Mifflin.
Sloboda, Z., Stephens, R. C., Stephens, P. C., Grey, S. F., Teasdale, B., Hawthorne, R. D.,
Williams, J., Marquette, J. F. (2009) ‘The Adolescent Substance Abuse Prevention Study: A
randomized field trial of a universal substance abuse prevention program’ Drug and Alcohol
Dependence 102(1-3) pp. 1-10.
Vincus, A. A., Rigwalt, C., Harris, M. S. and Shamblen, S. R. (2010) ‘A short-term,
quasi-experimental evaluation of D.A.R.E.’s revised elementary school curriculum’ Journal of
Drug Education 40(1) pp. 37-49.
West, S. L. and O’Neal, K. K. (2004) ‘Project D.A.R.E. Outcome Effectiveness Revisited’
American Journal of Public Health 94(6) pp. 1027-1029.
White, D., Buckley, E. and Hassan, J. (2004) Literature Review on the Role of External
Contributors in School Drug, Alcohol and Tobacco Education Nottingham: Department for
34
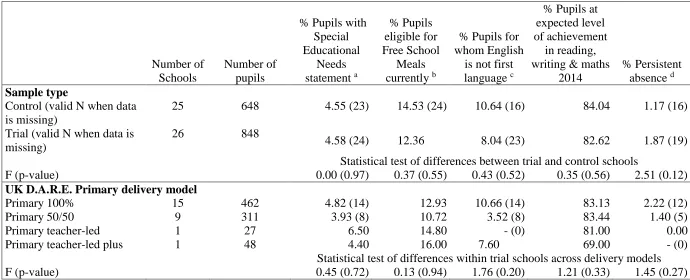
Table 1: Department for Education (DfE) schools’ performance data, for control and trial schools, for UK D.A.R.E. Primary programme delivery
model and F tests for any respective statistically significant difference between trial and control schools, and across delivery models within trial
schools
Number of Schools
Number of pupils
% Pupils with Special Educational
Needs statement a
% Pupils eligible for Free School
Meals currently b
% Pupils for whom English
is not first language c
% Pupils at expected level of achievement
in reading, writing & maths
2014
% Persistent absence d Sample type
Control (valid N when data is missing)
25 648 4.55 (23) 14.53 (24) 10.64 (16) 84.04 1.17 (16)
Trial (valid N when data is missing)
26 848
4.58 (24) 12.36 8.04 (23) 82.62 1.87 (19)
Statistical test of differences between trial and control schools
F (p-value) 0.00 (0.97) 0.37 (0.55) 0.43 (0.52) 0.35 (0.56) 2.51 (0.12)
UK D.A.R.E. Primary delivery model
Primary 100% 15 462 4.82 (14) 12.93 10.66 (14) 83.13 2.22 (12)
Primary 50/50 9 311 3.93 (8) 10.72 3.52 (8) 83.44 1.40 (5)
Primary teacher-led 1 27 6.50 14.80 - (0) 81.00 0.00
Primary teacher-led plus 1 48 4.40 16.00 7.60 69.00 - (0)
Statistical test of differences within trial schools across delivery models
F (p-value) 0.45 (0.72) 0.13 (0.94) 1.76 (0.20) 1.21 (0.33) 1.45 (0.27)
Note: All statistical tests reported here excluded schools with respective missing DfE data. a Missing DfE data from 4 schools (2 trial, 2 control).
b Missing DfE data from 1 control school.
35
Table 2: Ofsted inspection results for trial and control schools according to school performance criteria in the UK and Chi-square tests for any
respective statistically significant difference between trial and control schools
Inspection
Domain Overall effectiveness
Leadership / Management
Behaviour / Safety
of pupils Teaching Quality Pupil Achievement
Trial Control Trial Control Trial Control Trial Control Trial Control
Inspection Outcome No. (%) No. (%) No. (%) No. (%) No. (%) No. (%) No. (%) No. (%) No. (%) No. (%) Outstanding 5 (19.2) 2 (8.0) 4 (15.4) 2 (8.0) 6 (23.1) 4 (16.0) 4 (15.4) 1 (4.0) 5 (19.2) 1 (4.0) Good 19 (73.1) 19 (76.0) 20 (76.9) 18 (72.0) 18 (69.2) 17 (68.0) 20 (76.9) 19 (76.0) 19 (73.1) 19 (76.0) Requires
Improvement 0 4 (16.0) 0 4 (16.0) 0 3 (12.0) 0 4 (16.0) 0 4 (16.0)
Inadequate 1 (3.8) 0 1 (3.8) 0 1 (3.8) 0 1 (3.8) 0 1 (3.8) 0
Missing data 1 (3.8) 0 1 (3.8) 1 (4.0) 1 (3.8) 1 (4.0) 1 (3.8) 1 (4.0) 1 (3.8) 1 (4.0)
Total 26 25 26 25 26 25 26 25 26 25
Statistical significance test results
χ2 = 6.29, df = 3,
p-value = 0.10
χ2 = 5.75, df = 3,
p-value = 0.12
χ2 =4.41, df = 3,
p-value = 0.22
χ2 = 6.81, df = 3,
p-value = 0.08
χ2 = 7.65, df = 3,
p-value =0.05
36
Table 3: Pupils’ socio-demographic characteristics and Chi-square tests for any respective
statistically significant difference between trial and control schools’ survey respondents
Characteristic
Percentage of pupils in
Statistical significance test results Trial schools (N=848) Control schools (N=648)
Sex Male 48.94 47.53 χ2 =0.29, df = 1,
p-value = 0.59
Female 51.06 52.47
Ethnicity (combined categories)a
White British 79.72 79.32 χ2=0.04, df = 1,
p-value = 0.85
Non-White British 20.28 20.68
Religion (combined categories)a
No religion 54.72 54.48 χ2=3.44, df = 3,
p-value = 0.33
Christian 39.50 38.27
Muslim 1.89 3.40
Other religion 3.89 3.86
Family Compositiona
Living with mother and father, together in same house
76.89 76.85 χ2=0.00, df = 1, p-value = 0.99
Other family composition
23.11 23.15
School Year Year 5 5.42 29.94 χ2=163.88, df = 1,
p-value = 0.00
Year 6 94.58 70.06
37
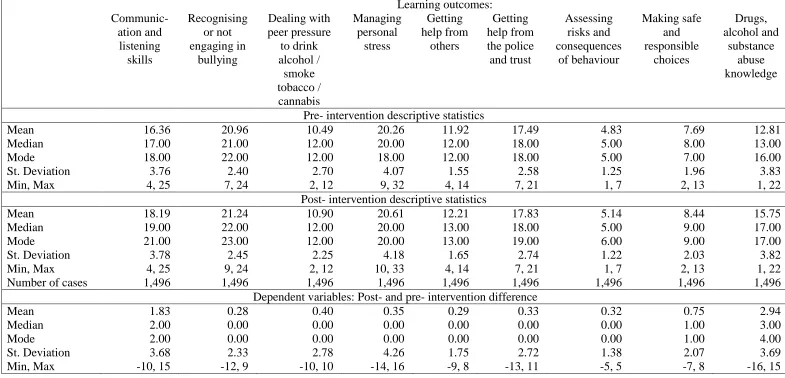
Table 4: Summary statistics across learning outcomes, pre- and post- intervention and their difference, the study’s dependent variables
Learning outcomes: Communic-ation and listening skills Recognising or not engaging in bullying Dealing with peer pressure to drink alcohol / smoke tobacco / cannabis Managing personal stress Getting help from others Getting help from the police and trust Assessing risks and consequences of behaviour Making safe and responsible choices Drugs, alcohol and substance abuse knowledge
Pre- intervention descriptive statistics
Mean 16.36 20.96 10.49 20.26 11.92 17.49 4.83 7.69 12.81
Median 17.00 21.00 12.00 20.00 12.00 18.00 5.00 8.00 13.00
Mode 18.00 22.00 12.00 18.00 12.00 18.00 5.00 7.00 16.00
St. Deviation 3.76 2.40 2.70 4.07 1.55 2.58 1.25 1.96 3.83
Min, Max 4, 25 7, 24 2, 12 9, 32 4, 14 7, 21 1, 7 2, 13 1, 22
Post- intervention descriptive statistics
Mean 18.19 21.24 10.90 20.61 12.21 17.83 5.14 8.44 15.75
Median 19.00 22.00 12.00 20.00 13.00 18.00 5.00 9.00 17.00
Mode 21.00 23.00 12.00 20.00 13.00 19.00 6.00 9.00 17.00
St. Deviation 3.78 2.45 2.25 4.18 1.65 2.74 1.22 2.03 3.82
Min, Max 4, 25 9, 24 2, 12 10, 33 4, 14 7, 21 1, 7 2, 13 1, 22
Number of cases 1,496 1,496 1,496 1,496 1,496 1,496 1,496 1,496 1,496
Dependent variables: Post- and pre- intervention difference
Mean 1.83 0.28 0.40 0.35 0.29 0.33 0.32 0.75 2.94
Median 2.00 0.00 0.00 0.00 0.00 0.00 0.00 1.00 3.00
Mode 2.00 0.00 0.00 0.00 0.00 0.00 0.00 1.00 4.00
St. Deviation 3.68 2.33 2.78 4.26 1.75 2.72 1.38 2.07 3.69
38
Table 5: The effects of the UK D.A.R.E. Primary programme across learning outcomes based on OLS regression analysis controlling for
delivery model and pupils’ gender and school year
Dependent variables: Post- pre- intervention difference in the learning outcomes of:
Communi-cation and listening
skills
Recognis-ing or not
engaging in bullying Dealing with peer pressure to drink alcohol / smoke tobacco / cannabis Managing personal stress Getting help from others Getting help from the police and trust Assessing risks and con-sequences of behaviour Making safe and respons-ible choices Drugs, alcohol and subs-tance abuse know-ledge
Covariates Coefficient (p-value)
Part I Baseline model (N=1,496)
Intercept 0.78 (0.00) 0.21 (0.02) 0.32 (0.00) 0.15 (0.36) 0.08 (0.22) 0.24 (0.03) 0.27 (0.00) 0.47 (0.00) 1.65 (0.00) D.A.R.E. intervention 1.86 (0.00) 0.13 (0.30) 0.15 (0.31) 0.35 (0.11) 0.37 (0.00) 0.17 (0.23) 0.08 (0.29) 0.48 (0.00) 2.27 (0.00)
R2 0.06 0.00 0.00 0.00 0.01 0.00 0.00 0.01 0.09
Part II Final model (N=1,496)
Intercept 1.00 (0.00) 0.22 (0.17) 0.35 (0.07) 0.17 (0.56) 0.18 (0.13) 0.46 (0.01) 0.32 (0.00) 0.41 (0.00) 2.10 (0.00)
D.A.R.E. 1.78 (0.00) 0.07 (0.65) 0.06 (0.74) 0.15 (0.59) 0.38 (0.00) 0.13 (0.45) 0.09 (0.28) 0.51 (0.00) 2.36 (0.00)
UK D.A.R.E. Primary delivery model (base: Trial 100% DARE officers)
Trial 50/50 0.07 (0.78) 0.17 (0.31) 0.32 (0.11) 0.56 (0.07) -0.02(0.88) 0.17 (0.41) -0.14(0.18) -0.22(0.14) 0.08 (0.75) Trial teacher-led 3.03 (0.00) 0.36 (0.43) -0.38(0.49) -0.09(0.91) 0.00 (0.99) 0.86 (0.11) -0.02(0.95) 0.25 (0.53) 0.45 (0.52) Trial teacher-led plus 1.13 (0.04) 0.30 (0.40) 0.18 (0.68) 0.79 (0.22) 0.23 (0.39) 0.79 (0.06) 0.39 (0.06) 0.90 (0.00) 0.12 (0.82)
Demographic characteristics
Boys (base Girls) 0.21 (0.26) 0.20 (0.10) 0.09 (0.52) 0.23 (0.30) -0.09(0.30) 0.08 (0.56) -0.15(0.03) 0.17 (0.11) -0.15 (0.41) Year 6 (base Year 5) -0.46(0.08) -0.15(0.40) -0.11(0.59) -0.18(0.57) -0.08(0.56) -0.37(0.06) 0.05 (0.66) -0.02(0.89) -0.54 (0.04)
39
Figure 1: Overall effects of UK D.A.R.E. Primary programme across learning outcomes based on OLS regression analysis (baseline model)
40
Figure Captions:
Figure 1: Overall effects of UK D.A.R.E. Primary programme across learning outcomes
41
i Personal communication with Stuart Longcroft, Business Manager, Life Skills Education C.I.C. ii The briefing and information sheet issued to invigilators is available upon request.
iii Two classes participated from 3 control and 10 trial schools and three classes participated from 2 control and 1 trial school.
iv More information available from: http://www.sealcommunity.org/node/356. (Accessed 3 October 2016) v The Ofsted domains are: overall effectiveness (an overall judgement of the school from the other domains), leadership and management (including ambitions for and performance of the school and collaboration between all levels of management, governors and employees) behaviour and safety of pupils (including assessing whether pupils develop personal and social skills and are safeguarded and able to report concerns), teaching quality and pupil achievement (meaning that pupils of all abilities are supported to achieve goals by appropriately trained staff).
vi The individual variables which make up each measurement were first recoded for internal consistency. In particular, all individual components were checked and, if necessary recoded in order to show similar direction of desirable outcome.
vii Follow up behaviour questions to the last two of these questions - on whether pupils had controlled their anger in some way and whether they had felt comfortable sticking up for themselves in an argument - were answered only in cases of positive answers to the preceding questions. In order to include the answers to the follow-up questions in the index an additional point was given for these answers. Analysis was performed using the index with and without these two questions; the results did not essentially differ, and the findings presented here refer to the more encompassing index based on all the above questions.
viii The statistical analysis and modelling was undertaken using the SPSS package software. All the control and independent variables which entered the models were retained in order for researchers and readers to make their own judgement of p-values acceptable for statistical significance. In addition non-significant estimates may equally offer interesting findings. The sample consists of pupils nested within classes nested within schools. However the sampling was not hierarchical: Classes were not randomly selected from each school and pupils were not randomly selected from each class. As discussed in the beginning of the Methodology section, all pupils in classes assigned to receive D.A.R.E. education in the school year 2015/16 of the sample schools participated in the survey and the majority were pupils from only one class per school (see earlier endnote). Therefore there is no theoretical basis to analyse the data via hierarchical statistical modelling. This was also evidenced in practice: As it will be seen in the following paragraph of the current section, preliminary analyses showed no significant school effects (even at a generous p-value <0.11), therefore it was not considered necessary to conduct hierarchical modelling statistical analysis.
ix Pupils in the test schools of this study who received the programme via this delivery model were roughly twice as able to deal with peer pressure regarding substance use and improved managing personal stress 5.2 times more than those in the control sample. These effects however are not statistically significant and cannot be generalised beyond this study.
x The respective p-values equal 0.11 and 0.06 and indicate not statistically significant coefficients at the standard level of p-value < 0.05.
xi An interaction effect between Year 6 group and intervention was non – statistically significant and it is not shown here.