sensors
ISSN 1424-8220 © 2008 by MDPI www.mdpi.org/sensorsCommunication
An Open Distributed Architecture for Sensor Networks for Risk
Management
John Douglas 1,*, Thomas Usländer 2, Gerald Schimak 3, J. Fernando Esteban 4 and Ralf Denzer 5
1
BRGM – ARN/RIS, 3 avenue C. Guillemin, BP 36009, 45060 ORLEANS Cedex 2, France. 2
Information Management, Fraunhofer IITB, Fraunhoferstraße 1, 76131 Karlsruhe, Germany; E-mail: [email protected]
3
Information Management, Austrian Research Centers GmbH - ARC, A-2444 Seibersdorf, Austria; E-mail: [email protected]
4
Atos Origin, Albarracin 25, 28037 Madrid, Spain; E-mail: [email protected] 5
Environmental Informatics Group, Goebenstraße 40, 66117 Saarbrücken, Germany; E-mail: [email protected]
* Author to whom correspondence should be addressed; E-mail: [email protected]
Received: 10 December 2007 / Accepted: 12 March 2008 / Published: 13 March 2008
between dissemination and acquisition systems. Thirdly, the transfer and processing of information from sensors is limited, again by incompatibilities between systems. Therefore, the current situation leads to a lack of efficiency and limited use of the available data that has an important role to play in risk mitigation. In view of this situation, the European Commission (EC) is funding a number of Integrated Projects within the Sixth Framework Programme concerned with improving the accessibility of data and services for risk management. Two of these projects: ‘Open Architecture and Spatial Data Infrastructure for Risk Management’ (ORCHESTRA, http://www.eu-orchestra.org/) and ‘Sensors Anywhere’ (SANY, http://sany-ip.eu/) are discussed in this article. These projects have developed an open distributed information technology architecture and have implemented web services for the accessing and using data emanating, for example, from sensor networks. These developments are based on existing data and service standards proposed by international organizations. The projects seek to develop the ideals of the EC directive INSPIRE (http://inspire.jrc.it), which was launched in 2001 and whose implementation began this year (2007), into the risk management domain. Thanks to the open nature of the architecture and services being developed within these projects, they can be implemented by any interested party and can be accessed by all potential users. The architecture is based around a service-oriented approach that makes use of Internet-based applications (web services) whose inputs and outputs conform to standards. The benefit of this philosophy is that it is expected to favor the emergence of an operational market for risk management services in Europe, it eliminates the need to replace or radically alter the hundreds of already operational IT systems in Europe (drastically lowering costs for users), and it allows users and stakeholders to achieve interoperability while using the system most adequate to their needs, budgets, culture etc. (i.e. it has flexibility).
Keywords: Sensor networks, risk management, web services, open distributed architecture, ORCHESTRA, SANY
1. Introduction
In today’s rapidly changing world the correct management of risk from natural and hazards with a human origin is becoming more and more important. Increasing urbanization and the undertaking of high-value projects means that, in some areas, risk is increasing. In addition, due to climate change there is some evidence that the hazard level due to weather-related perils is becoming larger. As in all aspects of modern life, information technology (IT) is playing an increasing role in risk management since it allows the undertaking of certain tasks and makes others easier to perform.
across risk domains, e.g. IT systems concerned with industrial risk cannot often communicate with those concerned with earthquake risk, limiting the ability to undertake true multi-risk analysis. Multi-risk analysis is being increasingly recognized as an important tool because it gives a better overall picture of the level of and the interactions between risks in a region [e.g. 3]. In order to overcome these problems, users often must spend valuable time reformatting files, for example, to the detriment of undertaking more fundamental risk management tasks. In addition, this effort is, in some sense, wasted since, in all probability it will need to be repeated when data is sourced from another organization or when a new IT system is developed. These interoperability problems limit the work that can be achieved since it is difficult to access and use existing data; data which cost much time and effort to collect.
In Europe, these problems arise not only across different types of risk, but also across regional and national borders. In addition to interoperability difficulties, language differences also become an issue. It is often important to undertake risk management across borders because impacts of events are not limited by human borders and actions undertaken to mitigate risk are also not contained by political boundaries.
In order to address these difficulties on a large scale considering the whole range of geographical data, an EC directive called INSPIRE (http://inspire.jrc.it) was launched in 2001. It is planned that this directive will be fully implemented by 2013 (implementation began in 2007). The directive is concerned with the setting up of a European Spatial Data Infrastructure, to implement metadata rules for data and services, to implement rules for harmonized spatial data specifications (exchange and update, ID systems, thesauri, key attributes, etc.) and to implement rules for network services (upload, discovery, view, download, transformation, etc.).
To develop these ideas into the field of sensors and risk management, a Framework Programme 6 Integrated Project (FP6 IP) called Open Architecture and Spatial Data Infrastructure for Risk Management (ORCHESTRA, http://www.eu-orchestra.org) was launched in September 2004 and a FP6 IP called Sensors Anywhere (SANY, http://sany-ip.eu/) was launched in September 2006.
This article begins with a summary of the use of sensors within all stages of risk management, with a focus on earthquake, industrial, flooding, forest fire and coastal risks (particularly studied during the ORCHESTRA project). Sections 3 and 4 then introduce the two European projects ORCHESTRA and SANY and the problems that they are trying to overcome. The main purpose of this article is the presentation of the developed architecture for sensor networks, which is discussed in Section 5. The article ends with some conclusions.
2. The use of sensors in risk management
in risk management today; however, this section does not seek to provide a comprehensive review of sensor networks for risk management.
Within the period before a potentially damaging event an important role for responsible agencies, such as governmental agencies, (re)insurance companies and operators of large concerns, is risk mitigation and planning for the occurrence of possible events, in order to be prepared if and when they arrive. Most natural hazardous events do not reoccur frequently at the same location, for example the return period of damaging earthquakes along the same fault is generally many hundreds or thousands of years, therefore these planning and mitigation activities are generally based on extrapolated information coming from models. The input to such models is usually provided by sensors operating in the vicinity but also in other analogous locations, in order to increase the quantity of data available.
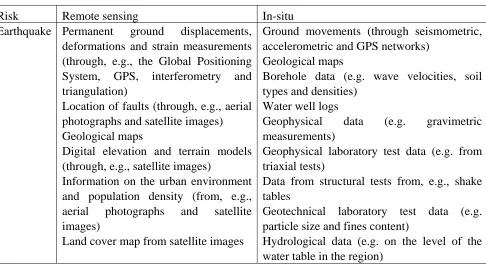
[image:4.595.53.539.519.787.2]Since risk is composed of the combination of hazard (coming from the peril itself) and the vulnerability of exposed elements (such as residential buildings, hospitals and lifelines) to the hazard, both these aspects need to be monitored by sensor networks. Table 1 briefly summarizes the types of sensors and information that are vital in the preparation phase for the five considered risks (earthquake, industrial, flood, forest fire and coastal). Much of the data coming from sensors needs to be processed and combined with additional information from elsewhere in order to be usable for risk management purposes therefore the interoperability of the processing and combination steps should be considered as important as the data collection stage. Currently some of the data used in different stages of the risk management procedure is collected in a visual and non-routine way through field surveys, which are not considered here. However, due to the rapid developments in the capabilities of sensor networks and significant reductions in their costs it is likely that in the near future sensors will be used to undertake at least part of these surveys. For example, there are fast reconnaissance methods for the assessment of building damage following an earthquake using airborne laser-scanning data [8]. However, currently the assessment of building damage is normally performed by teams on the ground.
Table 1. Summary of data from sensor networks useful for risk management purposes.
Risk Remote sensing In-situ
Earthquake Permanent ground displacements, deformations and strain measurements (through, e.g., the Global Positioning System, GPS, interferometry and triangulation)
Location of faults (through, e.g., aerial photographs and satellite images) Geological maps
Digital elevation and terrain models (through, e.g., satellite images)
Information on the urban environment and population density (from, e.g., aerial photographs and satellite images)
Land cover map from satellite images
Ground movements (through seismometric, accelerometric and GPS networks)
Geological maps
Borehole data (e.g. wave velocities, soil types and densities)
Water well logs
Geophysical data (e.g. gravimetric measurements)
Geophysical laboratory test data (e.g. from triaxial tests)
Data from structural tests from, e.g., shake tables
Geotechnical laboratory test data (e.g. particle size and fines content)
Table 1. Cont.
Table 1 shows that a number of data sources are common to many risks, e.g. the use of remote sensing data to produce digital elevation models, and also that there are also information coming from sensor networks that a specific to a particular risk, e.g. data from seismometer networks to assess earthquake hazard.
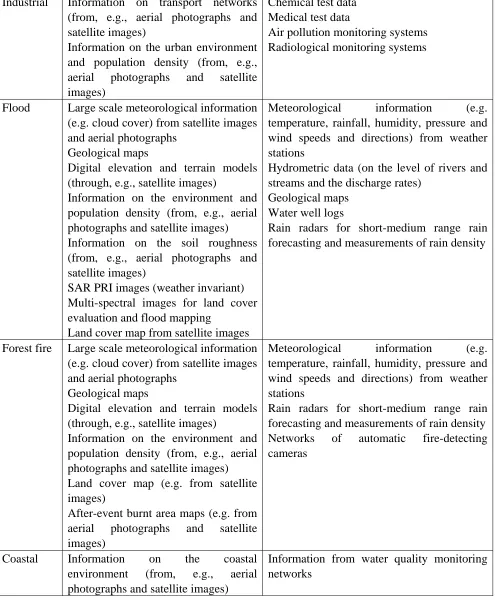
Industrial Information on transport networks (from, e.g., aerial photographs and satellite images)
Information on the urban environment and population density (from, e.g., aerial photographs and satellite images)
Chemical test data Medical test data
Air pollution monitoring systems Radiological monitoring systems
Flood Large scale meteorological information (e.g. cloud cover) from satellite images and aerial photographs
Geological maps
Digital elevation and terrain models (through, e.g., satellite images)
Information on the environment and population density (from, e.g., aerial photographs and satellite images)
Information on the soil roughness (from, e.g., aerial photographs and satellite images)
SAR PRI images (weather invariant) Multi-spectral images for land cover evaluation and flood mapping
Land cover map from satellite images
Meteorological information (e.g. temperature, rainfall, humidity, pressure and wind speeds and directions) from weather stations
Hydrometric data (on the level of rivers and streams and the discharge rates)
Geological maps Water well logs
Rain radars for short-medium range rain forecasting and measurements of rain density
Forest fire Large scale meteorological information (e.g. cloud cover) from satellite images and aerial photographs
Geological maps
Digital elevation and terrain models (through, e.g., satellite images)
Information on the environment and population density (from, e.g., aerial photographs and satellite images) Land cover map (e.g. from satellite images)
After-event burnt area maps (e.g. from aerial photographs and satellite images)
Meteorological information (e.g. temperature, rainfall, humidity, pressure and wind speeds and directions) from weather stations
Rain radars for short-medium range rain forecasting and measurements of rain density Networks of automatic fire-detecting cameras
Coastal Information on the coastal environment (from, e.g., aerial photographs and satellite images)
[image:5.595.53.548.107.707.2]3. ORCHESTRA
ORCHESTRA involves 15 partners both from the risk management domain and from the IT industry. The purpose of the project is to design a platform-independent open service-oriented architecture (SOA) for risk management purposes, and implement it for Internet-based applications (web services) that can be called via the web to provide a given functionality. They could be seen as subroutines located on the web to be used when needed by any user. In this context, ‘open’ refers to the fact that the specifications of these services are being made publicly available free of charge so that they can be implemented by any interested party and can be accessed by all potential users. The actual procedure followed by the web service to perform the required task is not considered and is not specified; however, the inputs and outputs to the service and the actions it must undertake are specified. The philosophy behind this approach is that if the specifications are followed then risk management systems using these web services will be fully interoperable without all needing to be created by a common entity. This philosophy has key advantages with respect to other approaches. For example, it is expected to favor the emergence of an operational market for risk management services in Europe, it eliminates the need to replace or radically alter the hundreds of already operational IT systems in Europe (drastically lowering costs for users), and it allows users and stakeholders to achieve interoperability while using the system most adequate to their needs, budgets, culture etc. (i.e. it has flexibility).
Interoperability of IT systems is a subject of much research and development in many countries. For example, the Open Geospatial Consortium (OGC, http://www.opengeospatial.org/) is an organization that seeks to develop software standards in the field of systems concerned with geographical information. In addition, there are existing and under-development ISO and CEN standards. ORCHESTRA bases its architecture on these standards and seeks to influence their development in order to make them applicable to risk management applications.
One advantage of the SOA approach in the risk management domain is that it allows applications to be updated with minimal effect on the services that call them. Procedures involved in risk management change often as experience is gained through disasters. Consequently it is important that the systems developed are agile allowing developments to be rapidly implemented in practice.
In the second half of the ORCHESTRA project four pilot projects concerned with different aspects of risk management in various European regions were completed. The aim of these pilot projects is to validate the services and architecture developed during the course of the project and to demonstrate the results of the project to potential end users. The four pilot projects undertaken were:
• Pan-European assessment of natural hazards.
• Forest fire and flash flood risk assessment in the Tordera basin (Catalonia, Spain).
• Assessment of the effects of road network disruptions due to multiple risks in the French-Italian border region.
• a process model compliant with the ISO Reference Model for Open Distributed Processing [4] that has been interpreted for the design and engineering of geospatial service-oriented architectures;
• a reference model for the design of geospatial service-oriented architectures [9];
• an open abstract architecture containing design rules for information and service models;
• specifications, on both the abstract level and specific to the W3C Web services platform, of the most important generic architecture services derived from but not restricted to the needs of environmental risk management applications;
• software engineering components for the development of service networks including:
• a Java-based software framework that comprise APIs for common service functionality (e.g. the service capabilities, access control and source system integration), including indispensable architecture services upon which higher-level services may be built;
• adapters to industry standard services (e.g. the ORCHESTRA Catalogue service [12] with adapters to both the ebRIM and the ISO Application Profile);
• design support for the mapping of service and information models from the abstract level (UML) to the Web services platform;
• utility applications (e.g. for user management, service monitoring, catalogue navigation); and
• specification and implementation of risk management services based on clear end-user requirements and validated in real-world pilot applications.
4. SANY
What was mentioned about interoperability and standardisation in the introduction is also valid for the SANY (Sensors Anywhere) project. Due to the uncountable number and types of sensors monitoring our environment and regarding the vision of the EC for a “Single Information Space for the Environment in Europe” it is specifically necessary to rigorously base the development of sensor networks on standardized open architectures that are of an utmost generic design and provide serious added value for end users. This is the starting place of the SANY project.
Sensors Anywhere (SANY) is an FP6 IST-5 Integrated Project dealing with sensor networks research for environmental applications. It aims to contribute to the joint European Commission (EC) and European Space Agency (ESA) “Global Monitoring for Environment and Security” (GMES) initiative by improving the interoperability of in-situ sensors and sensor networks, and allowing quick and cost-efficient reuse of data and services from currently incompatible sources in future environmental risk management applications.
networks, virtual sensors, roving sensors and airborne sensors, and to ensure interoperability between ground sensors and in-orbit sensors; (2) developing and validating re-usable data fusion and decision support service building blocks and a reference implementation of the architecture; (3) closely working with end users and international organisation to assure that the outcome of SANY contributes to future standards applicable to GMES.
A general goal is that all SANY architecture specifications shall be publicly available, validated by experts through OGC and compatible with EU and ESA infrastructure initiatives, such as INSPIRE.
4.1 Structure / Pilots
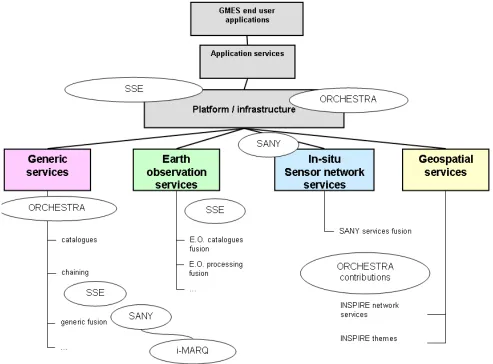
The setup of the SANY project is twofold. Firstly, there are numerous projects developing IT architectures (such as ORCHESTRA) which are taken into account in the design phase in order to build on this work. Figure 1 shows some of the inheritance of the SANY project. Secondly, the SANY sensor service architecture (described in the next section) is being developed. Through the concepts of data fusion and decision support the outputs of this architecture and services are studied within the project. Finally, the project’s results are validated in three independent domains: air pollution, marine risks and geological hazards (geohazards), which also provide valuable information on user requirements for sensor networks.
4.2 Air pollution risk validation exercise
In this validation exercise, an application that combines different types of air pollution sensor networks from different vendors with air pollution models and meteorological data using development results (services) of the architecture and data fusion group is built. With SANY-enabled sensor network and fusion capabilities, this application will produce a detailed, integrated 3D picture of air pollution; allow integrated, online dispersion modelling; make it possible to better quantify background pollution; support cross-border information exchange and alert functionality; try to become vendor independent and validate plug-and-measure capabilities.
4.3 Marine risk validation exercise
For this exercise, an application for use in a coastal water management is built. Existing sensor networks and observation facilities are used together with access to meteorological services. In addition, a virtual sensor network will be created through which what-if scenarios can be evaluated. This will allow users to define potential crisis scenarios and explore how these would propagate, and which intervention responses might be appropriate.
capability for dedicated campaign; availability of historic data (e.g. for up to five years) for the principle measurements; river current and urban treatment works data measured online (where available); and central station with dedicated tools (such as data processing, alerts management, information broadcasting).
4.4 Geohazards validation exercise
[image:9.595.48.541.349.713.2]Here an operational application for the use of a geo-hazard monitoring service in a complex urban context is created. This application will take the opportunity of existing classic monitoring systems in European cities, with a final demonstration in the Barcelona area, where large urban works are impacting the environment.
5. Architecture for Sensor Service Networks 5.1 Reference model
The architectural design for sensor service networks follows one of the core results (see section 3) of the ORCHESTRA project: It applies the Reference Model for the ORCHESTRA Architecture (RM-OA) [9] and extends it to geospatial service networks. The RM-OA is is built upon two main pillars: a process model and a conceptual model [11].
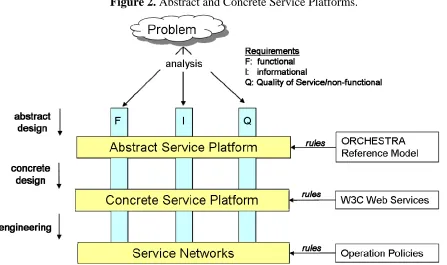
The ORCHESTRA process model applies an incremental, iterative approach for the analysis and design phases. Usually, a multi-step breakdown process across several abstraction layers is necessary to analyze user requirements and map them to the capabilities of a service platform. ORCHESTRA distinguishes between an abstract service platform that is specified independently of a given middleware technology and a concrete service platform (see Figure 2).
• The abstract design phase leads to platform-neutral specifications following the rules of the abstract service platform provided by the ORCHESTRA Reference Model. They represent the functional, informational and non-functional requirements of the problem domain.
• The concrete design phase maps the abstract specifications to a chosen concrete service platform. In the current ORCHESTRA project this is the ORCHESTRA Web Services platform consisting of the rules of the W3C Web services and a profile of the Geography Mark-up Language (GML) as the current mainstream service platform technologies for geospatial applications.
[image:10.595.71.518.510.775.2]• In the engineering phase the platform-specific components are organised into service networks taking into account the qualitative requirements and translating them into operational policies.
In practice, these individual phases are often interlinked and repeated in an iterative fashion. Sometimes the abstract design phase is not required. Furthermore, existing service and OGC service standards for Web services make a pure top-down approach impractical. Thus, in practice, a middle-out design approach is often the appropriate method.
However, what is required is a clear structure for the documentation of the ideas and the results of the design phases. ORCHESTRA has adopted ISO/IEC 10746 ‘Reference Model for Open Distributed Processing’ (RM-ODP) [4] for this task and has interpreted it for the design of geospatial service architectures [9].
5.2 Sensor model
When planning an architecture that permits to access information provided by sensors of various types (from water monitoring stations up to cameras mounted on satellites) it quickly becomes obvious that it has to abstract from the physical characteristics of the individual sensors and their communication networks. However, the style of this abstraction is dependent on the purpose of the application that requires access to the sensors. If the purpose is to select the best-suited sensor device in terms of cost, accuracy and availability in order to fulfill a particular environmental observation task, there is a need to search for and compare descriptions of sensors. In short, access to sensor meta-information is required. If the purpose is to obtain a reading for an environmental parameter at a certain place and time, one may not be interested in the sensor as a device itself but in the information it provides. Finally, if the purpose is to influence the behavior of a given sensor device, e.g. to move it to a certain area (for mobile sensors), the externally accessible functionality of the sensor is important.
The SANY approach to solve this problem is to define a Sensor Model by looking at sensors from the RM-ODP viewpoints [10]:
• The enterprise viewpoint analyses the business context, the system and user requirements for environmental monitoring in terms of functionality, information demand and quality. It identifies the environmental phenomena that have to be observed with their temporal and spatial resolution and reflects this need with the types of sensors and models that are available. This activity may encompass a cost-benefit analysis if there are several options and offers from service providers. Furthermore, from the set of requirements basic patterns of sensor topologies have to be abstracted. For instance, it is necessary to distinguished between sensors that are spatially fixed, i.e. fixed at a given location, and mobile sensors such as cameras on aircraft or in satellites.
addition, information about the observation procedure, spatial-temporal context, and organizational characteristics has to be provided.
• The computational viewpoint (in ORCHESTRA and SANY referred to as the service viewpoint) is concerned with the functional decomposition of the system into a set of services that interact over interfaces. The external perspective represents the view of a software developer or a designer who aims at integrating a sensor into a network of services. From this perspective, a sensor may be seen as a component in a service network with two major interfaces:
o one interface to access the data representing the property observed by the sensor (see the information viewpoint above), and;
o a management interface that allows one to configure and monitor the internal behavior of the sensor (see the internal perspective).
• The engineering viewpoint links the sensors to a communication network. The network might be the Internet or any other open communication network.
• From a technology viewpoint, we consider a sensor to be a device that responds to a (physical) stimulus in a distinctive manner, e.g. by producing a signal. This means that a sensor device converts the stimulus into an analogue or digital representation, the latter being of more interest within the IT domain. SANY distinguishes between different forms of such a sensor. The simple form of a sensor provides information a single observed property (e.g. a temperature). A complex form of sensor combines several simple sensors and provides information on multiple observed properties. A sensor system (e.g. a satellite), allows the management of the system holding the sensors in addition to the management of each individual sensor separately.
In summary, the SANY approach to access to sensors and sensor information is to define a SOA, the SANY Sensor Service Architecture [9].
5.3 SANY sensor service architecture
The major architectural heritage of the SANY Sensor Service Architecture is the ORCHESTRA Architecture specified in [8] as an “open architecture that comprises the combined generic and platform-neutral specification of the information and service viewpoint as part of the ORCHESTRA Reference Model”. Consequently, the SANY Sensor Service Architecture builds upon the components of the ORCHESTRA Architecture which comprise:
• Rules and guidance on specifying information and service models in the context of international standards.
• Basic re-usable specification units for information models (e.g. pre-defined feature types) and service models (e.g. re-usable interfaces).
It is the objective of the project SANY to re-use and apply these components in the context of the SANY Sensor Service Architecture to the extent that they fulfill the requirements to build service networks based on sensor information and higher-level sensor information processing.
5.4 Functional domains
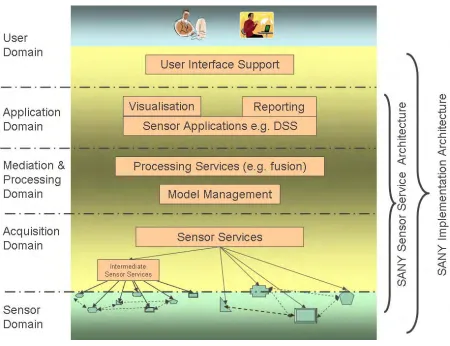
SANY services are designed to serve the needs of applications and users. Although there is no prescribed hierarchy of services, the SANY services may be grouped into functional domains matching their design purposes. The SANY Sensor Service Architecture distinguishes between the following functional domains for SANY services (see Figure 3).
Sensor Domain: SANY services in the sensor domain cope with the configuration and the management of individual sensor devices and their organization into sensor networks. Examples are services that support the interaction among the sensors themselves, e.g. a take-over service in case of an impending sensor battery failure. Services in this domain are abstractions from the proprietary mechanisms and protocols of sensor networks.
Acquisition Domain: SANY services in the acquisition domain deal with access to observations gathered by sensors. This includes other components in a SANY Sensor Network (e.g. a database or a model) that may offer their information in the same way (as observations) as sensors do. They explicitly deal with the gathering and management of information coming from the source system of type “sensor”. The information acquisition process may be organized in a hierarchical fashion by means of intermediate sensor service instances (e.g. using data loggers).
Mediation and Processing Domain: SANY services in the mediation and processing domain are not specific to the sensor service architecture. They are specified independently of the fact that the information may stem from the source system of type “sensor”. They mediate access from the application domain (see below) to the underlying information sources. They provide generic or thematic processing capabilities such as fusion of information (from sensors and other information sources), the management of models and the access to model results. In addition, service support for the discovery of sensors, data and services, naming resolution or service chaining are grouped in the mediation and processing domain.
Application Domain: Based on services of the acquisition and processing domain, SANY services in the application domain support the rendering of information in the form of maps, diagrams and reports such that they may be presented to the user in the user domain.
Figure 3. Functional Domains of SANY Services.
5.5 Service overview
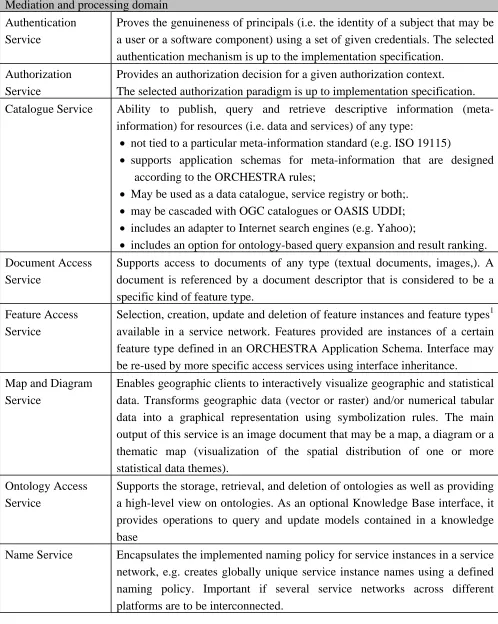
In Table 2 an overview of the combined set of services from ORCHESTRA and SANY is given as it currently stands. For the basic interfaces and the services in the mediation and processing domain, their abstract [6] and their implementation specifications [7] are available. The services in the acquisition domain are selected from the OGC Sensor Web Enablement (SWE) initiative.
Table 2. Architecture Service usable in a SANY Service Network Service and
interface type
Overview
Basic interfaces Interface types enabling a common architectural approach for all ORCHESTRA Services:
• self-description of service instances (capabilities)
• synchronous and asynchronous interactions
• transactional support
[image:14.595.43.543.604.750.2]Table 2. Cont. Mediation and processing domain
Authentication Service
Proves the genuineness of principals (i.e. the identity of a subject that may be a user or a software component) using a set of given credentials. The selected authentication mechanism is up to the implementation specification.
Authorization Service
Provides an authorization decision for a given authorization context. The selected authorization paradigm is up to implementation specification.
Catalogue Service Ability to publish, query and retrieve descriptive information (meta-information) for resources (i.e. data and services) of any type:
• not tied to a particular meta-information standard (e.g. ISO 19115)
• supports application schemas for meta-information that are designed according to the ORCHESTRA rules;
• May be used as a data catalogue, service registry or both;.
• may be cascaded with OGC catalogues or OASIS UDDI;
• includes an adapter to Internet search engines (e.g. Yahoo);
• includes an option for ontology-based query expansion and result ranking. Document Access
Service
Supports access to documents of any type (textual documents, images,). A document is referenced by a document descriptor that is considered to be a specific kind of feature type.
Feature Access Service
Selection, creation, update and deletion of feature instances and feature types1 available in a service network. Features provided are instances of a certain feature type defined in an ORCHESTRA Application Schema. Interface may be re-used by more specific access services using interface inheritance.
Map and Diagram Service
Enables geographic clients to interactively visualize geographic and statistical data. Transforms geographic data (vector or raster) and/or numerical tabular data into a graphical representation using symbolization rules. The main output of this service is an image document that may be a map, a diagram or a thematic map (visualization of the spatial distribution of one or more statistical data themes).
Ontology Access Service
Supports the storage, retrieval, and deletion of ontologies as well as providing a high-level view on ontologies. As an optional Knowledge Base interface, it provides operations to query and update models contained in a knowledge base
Table 2. Cont. Service Monitoring
Service
Provides an overview about service instances currently registered within a service network, e.g.:
• Actual status (e.g. running, stopped, offline)
• Statistical information (e.g. average availability, response times) User Management
Service
Creates and maintains subjects (users or software components) including groups (of principals) as a special kind of subjects.
Acquisition Domain Sensor Observation Service
Provides access to observations from sensors and sensor systems in a standard way that is consistent for all sensor systems including remote, in-situ, fixed and mobile sensors. An SOS organizes collections of related sensor system observations into Observation Offerings.
Sensor Alert Service Provides a means to register for and to receive sensor alert messages. The service supports both pre-defined and custom alerts and covers the process of alert publication, subscription and notification.
Sensor Planning Service
Provides a standard interface to task any kind of sensor to retrieve collection assets. It is a service by which a client can determine collection feasibility for a desired set of collection requests for one or more sensors/platforms, or a client may submit collection requests directly to these sensors/platforms. Web Notification
Service
Service by which a client may conduct asynchronous dialogues (message interchanges) with one or more other services. This service is useful when many collaborating services are required to satisfy a client request and/or when significant delays are involved in satisfying the request.
1
As in (RM-OA, 2007), SANY adopts the ISO 19101 definition of a feature as being an
“abstraction of a real world phenomenon” but explicitly subsumes hypothetical worlds under the term “real world”, too. Thus, for instance, a “model” may also be understood to be a feature type.
5.6 Outlook
and configuration and, in case of ad hoc sensor networks and resource discovery, including sensors and observation offerings [10].
6. Conclusions
Citizens and the environment are exposed to an increasing number of risks and critical situations originating from natural and man-made hazards. The number of crises, as well as their associated human and economic losses, seems to follow at a world-wide scale an increasing trend. This fact has been acknowledged by experts and authorities, and appropriate measures are being sought to improve the risk and crisis management cycle at the different administrative levels. Special attention is being paid to the basic requirement that stakeholders need to collaborate and interoperate in order to improve their own performance (by sharing experience and information) and improve joint efficiency and efficacy when confronting multi-risk or cross-border situations. All fields of activity, including risk management, are in turn increasingly dependent on ICT systems, which may act as enablers or inhibitors, so special attention must be paid to the underlying technology. Unfortunately, in general, existing IT systems have not been designed to interoperate (that is, to efficiently exchange information without external intervention).
Sensors, and especially sensor networks, play a critical role in risk management and their use will probably increase in the future. They allow vast amounts of relevant information to be collected in (nearly) real-time in locations that are remote, inaccessible, or lack the necessary resources to acquire such information in a different manner. Current research in the field of sensors focuses, at the sensor level, on important aspects such as size, cost, disposability or power efficiency. Complementary efforts are being carried out at the sensor network level, in order to tackle issues such as sensor data fusion and interoperability among networks and between these and their connections to ICT systems.
Service-oriented architectures (SOAs) are currently the choice for enterprise applications. These can be built by orchestrating different existing, distributed and loosely-coupled services according to new business requirements. The ORCHESTRA project has designed a service-oriented architecture that is open, free of charge and based on existing standards (ISO, OGC and W3C) in order to enable interoperability in risk management. The ORCHESTRA architecture has been defined first at an abstract (technology- and policy-independent) level, and later specified for the case of W3C web services. The rationale behind this two-level approach is to ensure that architectural principles providing, among others, interoperability are durable, allowing the same architecture to be defined for future technologies of choice. SANY builds on the results of ORCHESTRA and focuses on the development of sensor networks based on standardized open architectures.
integration efforts. In addition, they offer an increased possibility for specialized and enhanced service provision, thus favoring the emergence of a risk management application and service market in which big and small players are able to co-exist.
Acknowledgements
This work was co-funded by the European Commission's IST Programme, under Unit G5 “ICT for the Environment”, through the Integrated Projects FP6-IST 511678 ORCHESTRA (see http://www.eu-orchestra.org) and FP6-IST 0033564 SANY (see http://sany-ip.eu/). We thank the partners of Subproject 2 of ORCHESTRA for their input to the deliverables of WP2.1, which were used as a basis for Table 1. Finally, we thank an anonymous reviewer for their detailed comments on this article.
References and Notes
1. Bügel, U.; Hilbring, D. Application of Semantic Services in ORCHESTRA. In International Symposium on Environmental Software Systems ISSES 2007; Prague, Czech Republic, May 22-25, 2007.
2. Cox, S. Observation & Measurements - Part 1: Observation Schema. OGC Document 07-022r1, OpenGIS® standard; http://www.opengeospatial.org/standards/o%2526m 2007.
3. Douglas, J. Physical vulnerability modelling in natural hazards risk assessment. Nat. Haz. Earth Syst. Sci. 2007, 7, 283-288.
4. ISO/IEC 10746 Reference Model for Open Distributed Processing, 1996 and 1998.
5. OASIS. Semantic Execution Environment TC. Reference Model for Semantic Service Oriented Architecture. Working Draft 0.1, 2006
6. ORCH-AbstrServ. WP3.4 OA Service Abstract Specifications. Deliverables D3.4.x Integrated Project 511678 ORCHESTRA. Editor: Environmental Informatics Group (EIG). http://www.eu-orchestra.org/publications.shtml#OAspecs, February 2008
7. ORCH-ImplServ. WP3.6 OA Service Implementation Specifications. Deliverables D3.6.x. Integrated Project 511678 ORCHESTRA. Editor: Environmental Informatics Group (EIG). http://www.eu-orchestra.org/publications.shtml#OAspecs, February 2008.
8. Schweier, C.; Markus, M.; Steinle, E. Simulation of earthquake caused building damages for the development of fast reconnaissance techniques. Nat. Haz. Earth Syst. Sci. 2004, 4, 285-293. 9. Usländer, T. (Ed.). Reference Model for the ORCHESTRA Architecture Version 2 (Rev. 2.1). OGC
Best Practices Document 07-097. http://portal.opengeospatial.org/files/?artifact_id=23286, October 2007.
10. Usländer, T. (Ed.). Specification of the Sensor Service Architecture V0 (Document Version 1.0). Deliverable D2.3.1 of the FP-6 IST Integrated Project 033564 SANY (Sensors Anywhere), http://sany-ip.eu, November 2007.
12. Hilbring, D.; Usländer, T. Catalogue Services Enabling Syntactical and Semantic Interoperability in Environmental Risk Management Architectures. Proceedings of the 20th International Conference on Informatics for Environmental Protection (EnviroInfo 2006), September 6-8, 2006; Graz, Austria, 2006; pp. 39-46.