Solubility Determination from Clear Points upon
Solvent Addition
Marloes A. Reus*†, Antoine E.D.M. van der Heijden†‡, Joop H. ter Horst§
† Delft University of Technology, Process & Energy Department, Intensified Reaction &
Separation Systems, Leeghwaterstraat 39, 2628 CB, Delft, The Netherlands. (*email:
‡ TNO Defence, Security and Safety, Dept. Energetic Materials, P.O. Box 45, 2280 AA,
Rijswijk, The Netherlands
§ University of Strathclyde, EPSRC Centre for Innovative Manufacturing in Continuous
KEYWORDS: Phase diagram, Solubility, Solubility measurement, Saturation concentration, Solvent mixtures.
ABSTRACT: A method is described for determining the solubility of multicomponent crystalline compounds from clear points upon sample dilution at a constant temperature. Clear points are established by continuously adding solvent mixture to a suspension of known composition until a clear solution appears. For validation, this solvent addition method is compared to the traditional equilibrium concentration method at constant temperature and the more recent temperature variation method with which clear point temperatures are determined upon increasing the sample temperature. Solubility data of binary systems (1 solute, 1 solvent) measured using the solvent addition method are obtained relatively quickly compared to the equilibrium concentration method. These solubility data are consistent with those of the temperature variation and the equilibrium concentration method. For the temperature variation method the results are dependent on the heating rate. Likewise, for the solvent addition method they are dependent on the addition rate. Additionally, for ternary systems involving anti-solvent or co-crystals, solubilities are determined at a constant temperature using the solvent addition method. The use of the solvent addition method is especially valuable in the case of solvent mixtures and other complex multi-component systems, in which the temperature variation method cannot be applied easily.
Introduction
diagram indicates the most stable phases at specific compositional and temperature conditions1,
4-6, determines the achievable yield7 and enables the monitoring of the supersaturation during the
crystallization process7, 8.
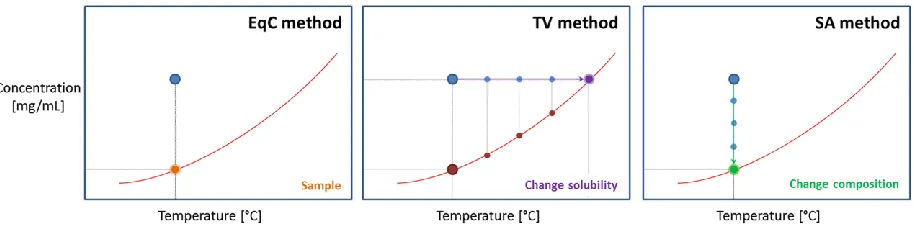
Figure 1. Different principles for solubility measurements using a certain overall composition (Blue dot). Left: EqC method. The equilibrium concentration (orange dot) is determined by analysing the concentration in an equilibrated suspension. Centre: The purple arrow represents the TV method, where the solubility of the system is changed until it corresponds to the overall concentration. Right: The green arrow represents the Solvent Addition (SA) method, where the concentration in the system is continuously decreased until it corresponds to the solubility at constant temperature.
[image:5.612.80.537.73.186.2]measurements for ease of operation. Additionally, this method can be automated similar to the TV method. We therefore aim to make the method more accessible and more widely applicable.
This method seems particularly useful for determining phase diagrams of complex multicomponent mixtures at constant temperature, since the concentration of each component can be tracked. Here we report the validation of the Solvent Addition method through a study of the solubility of p-Hydroxybenzoic acid (p-HBA) in acetic acid. Additionally, the influence of the solvent addition rate on the accuracy of the SA measurements is determined. Finally the SA method is applied to two multi-component systems; DL-asparagine (DL-Asn) in water-ethanol mixtures, and the carbamazepine - isonicotinamide (CBZ-INA) co-crystal in the solvent ethanol.
Experimental section
Materials
p-HBA (≥ 99%), INA (≥ 99%), CBZ (99%), glacial acetic acid, ethanol (100%) and DL-Asn (≥ 99%) were supplied by Sigma Aldrich and used without further purification. Demi water was taken from a Millipore MilliQ system and had a resistivity of approximately 18 MΩ·cm.
Equilibrium concentration method
For the TV method the same protocol was used as by Vellema et al.10, using the Crystal16 multiple reactor setup (Avantium Technologies). The samples were agitated using magnetic stirrer bars with a stirring rate of 700 rpm. For the p-HBA phase diagram, the temperature was varied between 0 – 90°C. For determining the influence of the heating rate on the clear point measurements, concentrations of 136.2 and 161.4 mg/mL of p-HBA in acetic acid were used in a temperature range of 0 – 60°C.
Solvent addition method
For the solvent addition experiments a Crystalline Multiple Reactor setup (Avantium Technologies) was used to provide a constant temperature and stirring rate (300 rpm), and to monitor the dissolution process by video. The starting volume was 2 mL of suspension. The solution was allowed to equilibrate for approximately 30 minutes prior to the solvent addition.
suspension was chosen as a starting point for the SA measurement , at which the amount of solid added to the solvent was 1.3 to 3 times higher than the rough estimate.
Solvent was added using an Aitecs 2016 syringe infusion pump (volumetric accuracy of ± 2%). Clear points were determined by visual analysis of the suspension pictures taken every 30 seconds. This method was preferred over the turbidity measurements in the same device, because of the better detection limit.
For larger scale solvent addition measurements a 100 mL Easymax reactor (Mettler Toledo) was used with overhead stirring (250 rpm), combined with an SP-50 dosing unit. Clear points in the Easymax were determined by FTIR measurements using the ReactIR system (Mettler Toledo) equipped with an AgX probe with diamond tip and an LN2 MCT detector. Peaks at
1168 cm-1 and at 1612 cm-1 were used to monitor the concentration changes of the compound in solution. The concentration remained constant until all crystalline material was dissolved. The start of a concentration decrease marked the clear point, which was determined by the intersection of the horizontal line (constant concentration) and the sloped line (decreasing concentration).
Characterization
Results
p-HBA is a white crystalline solid and is mostly known for its esters, which are used as preservatives. The SA method was used to determine its solubility in acetic acid. In a small volume (Vstart = 2 mL), the SA method was applied at 3 different temperatures while using a
solvent addition rate of Ra = 0.5 mL/h. While adding acetic acid, the suspension was monitored
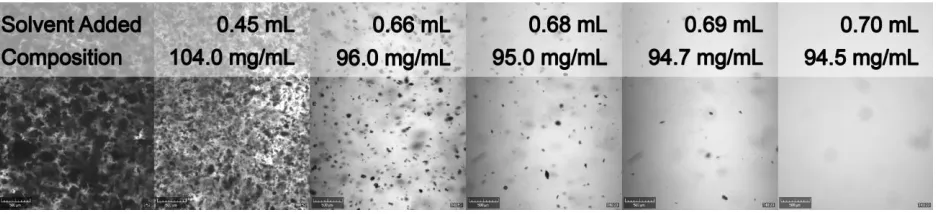
by video images. From figure 2 the decreasing suspension density upon solvent addition and the clear point after addition of 0.70 mL of acetic acid are evident. More pictures were recorded during the experiment for accurate determination of the clear point, but are left out of figure 2 for clarity. The clear point lies between 0.696 and 0.706 mL of added acetic acid, resulting in a solubility of 94.5 ± 0.2 mg/mL.
Figure 2. Visualization of the suspension density decrease of 255.2 mg/mL p-HBA in 2 mL acetic acid upon acetic acid addition. After addition of 0.70 mL of acetic acid a clear solution was obtained.
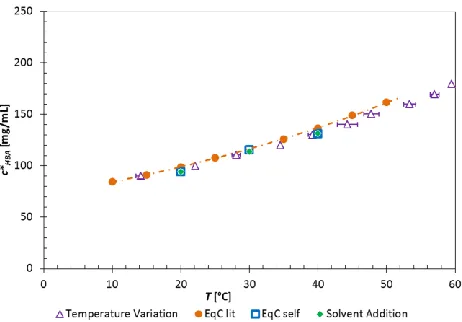
[image:9.612.73.541.352.459.2]Figure 3. Phase diagram of p-HBA in acetic acid measured by the EqC method (● = literature data17, □ = own EqC measurements), TV method (∆) and SA method (♦). For the TV and SA methods, heating and addition rates of 0.3°C/min and 0.3 mL/h were used, respectively.
Comparison with other solubility measurement methods
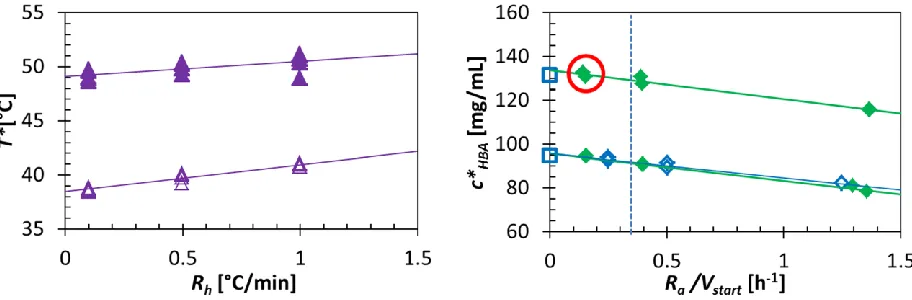
Figure 4. Left: Influence of heating rate (Rh) on clear point temperatures (T*) of p-HBA in acetic
acid during TV measurements using 2 different concentrations (cHBA = 136.2 mg/mL (Δ) and
161.4 mg/mL (▲)). Right: Influence of addition rate (Ra) on clear point concentration of p-HBA
(c*HBA) in acetic acid during SA measurements at 2 different temperatures (T = 20°C and 40°C)
and at small (Vstart = 2 mL) (♦) and large scale (Vstart = 40 mL)(◊). In the right graph our EqC
measurements (□) are provided for comparison. For the measurements in the circle an addition rate of 0.3 mL/h was used, the dashed vertical line represents the addition rate of Ra = 0.75 mL/h
for a starting volume of 2 mL.
Heating rate in the TV method. For any solubility measurement using the dynamic techniques (TV and SA), it is mainly important that the rates of change are small enough for the dissolution to keep up with the change. Therefore, with both methods a sensitivity analysis is performed for the p-HBA in acetic acid system, where the rates of change are plotted versus the recorded clear points.
Clear point temperatures were measured for p-HBA in acetic acid using the TV method. Figure 4 (l) shows the measured clear point as a function of the heating rate (Rh). For a concentration of
temperatures, thus lower apparent solubilities. This is mainly related to the interplay between the overall crystal dissolution rate and the applied heating rate, because the rate of change in the solubility depends on the heating rate. If the heating rate is too high, the dissolution of the crystals is not fast enough to keep up with the increasing solubility, the crystals will ultimately dissolve at a higher temperature. In those cases, a clear point temperature will be measured that is higher than the actual saturation temperature.
Upon decreasing Rh, the clear point would approach the saturation temperature, as seen in
figure 4 (l). If the heating rate is sufficiently low the crystals have sufficient time to dissolve and the solution approaches thermodynamic equilibrium at each temperature. Ideally a heating rate close to Rh = 0°C/min would lead to clear point temperatures that are equal to the saturation
temperature. A linear extrapolation for the sample with an overall concentration of 136.2 mg/mL leads to a saturation temperature of T* = 38.5 ± 0.4°C (figure 4 (l)). Using a heating rate of Rh = 0.5°C/min the measured clear point is Tc = 39.9°C ± 0.3°C, 1.4°C higher than the
extrapolated saturation temperature. For a sample with an overall concentration of 161.4 mg/mL a saturation temperature of T* = 49.1 ± 0.7°C is extrapolated. Using a Rh of 0.5°C/min the
measured clear point is Tc = 49.9 ± 0.4°C, 0.8°C higher than the extrapolated saturation temperature. Based on both measurements, we assumed a Rh = 0.3°C/min to provide us with
Addition rate in the SA method. Using the SA method clear point concentrations of the same system (p-HBA in acetic acid) were measured. The SA method was applied at 2 different temperatures while using solvent addition rates varying from 0.3 to 5.5 mL/h. Figure 4 (r) shows the relation between the addition rate (Ra) and the measured clear point concentrations. The clear
point concentrations are plotted against the addition rate (Ra) divided by the initial volume (Vstart)
to enable the comparison of measurements at different scales. It shows that lower addition rates lead to higher clear point concentrations. Analogous to the trend in the clear point temperature variation with the heating rate, the clear point concentration is determined by a balance between the dissolution rate and the concentration dilution rate, the latter of which depends on the Ra. In
the solvent addition method the Addition Rate (Ra) is to some extent the equivalent of the heating
rate in the TV method. If the Ra is too high, the dissolution of the crystals is not fast enough to
keep up with the decreasing concentration.
A linear extrapolation for the samples at T = 20 and 40°C lead to a saturation concentration of c*HBA = 95.8 ± 0.6 mg/mL and 133.8 ± 0.9 mg/mL (figure 4 (r)). For the equipment, chemicals
and 2 mL starting volume, clear point data within 5% of the saturation concentration are obtained at addition rates around Ra = 0.75 mL/h or lower. A typical single clear point measurement using
solvent addition, starting with 2 mL to which 4 mL is added, would then take around 2 to 3 hours.
example of such a measurement is shown in figure 5. Upon addition of acetic acid, in this case with an addition rate of Ra = 10 mL/h, the concentration of p-HBA in solution remained constant
(saturated), because the dilution was compensated with the dissolution of crystals. After a certain amount was added, the concentration decreased, because all crystals in the suspension were dissolved, which marked the clear point. The precise clear point was determined by the intersection of the slopes. The clear point for this particular measurement was found after addition of 12.5 mL of acetic acid. The concentration of p-HBA in the crystallizer is plotted in the same figure and found on the second y-axis as cHBA* = 0.94 g/mL.
Figure 5. Trends of IR spectrum peak heights at 1168 cm-1 (blue) and 1612 cm-1 (red) taken during a SA experiment with p-HBA in acetic acid at 20°C with an acetic acid addition rate of 10 mL/h over a starting volume of 40 mL. The green dashed data represents the concentration of p-HBA in the crystallizer. The clear point in this experiment was determined as cHBA* = 0.940 g/mL ± 0.005 g/mL, after addition of 12.5 mL ± 0.3 mL of acetic acid.
[image:14.612.78.307.295.452.2]using different detection techniques with the SA method as long as the same Ra /Vstart is used.
The method therefore can be used at any scale, as long as the addition rate is chosen accordingly.
Comparing heating and addition rate. In order to allow the comparison between the TV and SA data in figure 3, the rates of change used in both methods should be equivalent at the clear point. For both methods the rate of change can be expressed as the relative dilution rate, d(ci/ci*)/dt and is assessable at the clear point, i.e. where (ci/ci*) = 1.
In TV measurements, by changing the temperature, the solubility of the compound (ci*) is
increased in order to completely dissolve the crystals while the overall composition (ci) remains
unchanged. The solubility can be described as an exponential function of the temperature:
*
( ) exp( )
i
c T a bT (1)
When the composition in the crystallizer does not change, the supersaturation ratio can then be expressed as: exp ( ) i i i c c bT a
c T (2)
In eq. 1, a and b are fitting parameters. The temperature T(t) in degrees Celsius is changed over time according to:
0 h
T T R t (3)
Combining equations 1 and 2 and taking the derivative over time yields the rate of change for TV measurements as a function of the heating rate Rh:
( )
( ) i i
h i i
d c c T
bR c c T dt
(4)
From our experimental data, the fitting parameters were a = 70.5 mg/mL and b = 0.0157/°C. Starting at T0 = 20°C with a concentration ci = 131 mg/mL, the clear point should
be reached at 40°C. Using a heating rate of Rh = 0.30°C/min gives a relative dilution rate of
d(ci/ci*)/dt = -4.7·10-3/min.
In the performed SA measurements, by addition of solvent, the overall concentration of the compound in the vessel (ci) is decreased in order to dissolve the crystals while the solubility
remains unchanged. In case of complex multicomponent mixtures where solvent mixtures are added, however, the solubility may change. For the performed SA measurements the supersaturation ratio is expressed via the change in concentration ci(t) over time due to the
changing volume V(t) of solvent:
,0 0 * * ( ) i i i i c c V
c c V t (5)
in which ci,0 is the initial concentration of compound in the vial and V0 is the initial volume of
solvent. The volume of solvent in the vial is expressed as:
0
( ) a
V t V R t (6)
Substituting eq. 5 into 4 and taking the derivative over time yields the rate of change for SA measurements:
,0
* * 0
2 0
i
a
i i i
a
c
V R
d c c c
dt V R t
(7)
of -2.0·10-3/min is calculated at the clear point. This falls in the same order of magnitude as the rate of change in solubility for the TV measurements, which means that the data can fairly be compared. Since the rate of change in the SA measurements is smaller than in the TV measurements, it is not surprising that the accuracy of the SA data is higher. In this system at 40°C, a similar change in supersaturation ratio can be obtained to that of the TV measurement if an addition rate of Ra = 0.75 mL/h (dashed blue line in figure 4 (r)) is used. The rate of change in
supersaturation ratio in that case is d(ci/ci*)/dt = -5.0·10-3/min at the clear point concentration.
The SA method in more complex mixtures
The TV method is the fastest method for obtaining solubility data of pure components in single solvents. However, when multicomponent mixtures are investigated and a phase diagram at a single, fixed temperature is required, the TV method loses its advantages over the SA method. We measured the solubility of crystalline compounds in multicomponent mixtures containing multiple solvents (anti-solvent crystallization) and multiple solutes (co-crystallization).
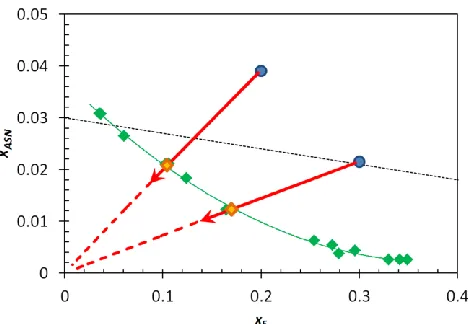
Figure 6. Solubility of anhydrous DL-Asn in the solvent – anti-solvent system water – ethanol. The measured mass fraction xASN of DL-Asn at 20°C is plotted versus the mass fraction xE of
ethanol on solute free basis. The red arrows indicate the overall composition during the measurement of the clear points (orange diamonds) starting at an overall composition in the blue points. The black dashed line represents the addition of pure ethanol to a solution of DL-Asn in water during an anti-solvent crystallization experiment.
then follows the red line towards the origin of the graph. The orange diamond at the point (0.12; 18.6) corresponds to the clear point. The larger spread in data points around an ethanol mass fraction of 0.3 is most likely because in some points the starting suspension was chosen rather close to the solubility line, which slightly decreases the accuracy since interval between the suspension pictures was not decreased.
Additionally, an example is given of the dilution path during an anti-solvent crystallization process that starts with an initial solution with a DL-Asn mass fraction of 0.30 in water, to which pure ethanol is added (black dashed line in figure 6). This phase diagram allows for the tracking of supersaturation during anti-solvent crystallization processes and is a valuable tool in determining the optimal amount of ethanol to add to a starting solution in order to achieve a high yield while keeping the added anti-solvent at a minimum. Since DL-Asn forms a monohydrate in water and crystallizes in anhydrous form from ethanol, the crystals in suspensions at 20°C were analysed by XRPD. Already at ethanol fractions as low as xE = 0.03 the anhydrous form was the
predominant crystal form.
Extrapolation of the data to T = 20°C leads to a solubility product (xaxb) = 37.1·10-6 (the point
∆ in figure 7), which in the ideal case is constant at constant temperature (purple dashed curve).
[image:20.612.82.531.327.651.2]extrapolation from the TV measurements. The green markers represent SA measurements at T = 20°C. The blue dots are starting points in the SA methodology, the red arrows depict
examples of the dilution path in a number of clear point measurements (orange diamonds) measured by the SA method.
The co-crystal phase diagram was also determined using the SA method. The red arrows in the figure show the measuring protocol used for obtaining the data in the co-crystal region. The method starts by creating a suspension of the co-crystals in solvent by making a starting sample composition of both compounds at their pure component solubility (at 20°C xINA* = 0.028 and
xCBZ* = 0.0045, blue point 1) in 2 mL solvent. The pure crystalline forms dissolved, while
co-crystallization occurred from this solution, since this composition is located in the co-crystal region and is supersaturated there18. With this suspension, solvent addition using pure solvent was started with an addition rate of 0.5 mL/h. However, the suspension was rather dense which resulted in a required added volume for complete dissolution that exceeded the volume of the crystallizer. A new starting mixture of 2 mL was created (blue point 2) having the same composition as the final composition of the previous experiment. This point 2 was the starting point for other clear point measurements, by adding not pure solvent but an undersaturated solution of one of the pure compounds. In this way, such phase diagrams can be constructed without prior knowledge about their shape.
In figure 7, it can be seen that the TV data and the SA data agree well in the co-crystal region. The results from the methods do deviate significantly in the pure component regions. While the solubility of CBZ is only slightly affected by the presence of INA in the solution, the solubility of INA decreases significantly in the presence of relatively small concentrations of CBZ. To account for these influences with the TV method many measurements are required.10 The SA method is thus suitable for investigating non-ideal behaviour in multi-component systems.
Discussion
Next to the already accepted methods for determining solubility lines, our SA method proves to be a potential technique. Although our SA method needs as many experiments as the EqC method and is therefore not as efficient as the TV method, the measurements are less laborious and time consuming than the EqC method, with the additional advantage that they can be automated. A crucial point for both the TV and the SA method is the determination of the clear point. In this paper the determination of the clear points was done by turbidity measurements, video images and FTIR concentration measurements for 1 mL, 6 mL and 100 mL samples, respectively. The detection limit for each technique is different and can therefore significantly influence the accuracy of the measurements. For example, turbidity measurements are less accurate at larger sample volumes, making other detection techniques preferable.
The strongest point of the SA method lies in its application in (complex) multi-component mixtures, in which the composition at any 2-phase to 1-phase transition point at a constant temperature can be determined. Additionally, if the solubility is slightly impacted by temperature changes, for instance in salt or protein systems, the SA method can be preferred as well.
The SA method, similar to the TV method, results in an equilibrium composition at a certain temperature. However, in the case of polymorphs, co-crystals or other systems, it is unclear which equilibrium is measured without the use of an additional analysis tool. Especially in the neighborhood of a triphasic domain, the equilibrium composition related to a metastable rather than the stable phase could be determined, for instance due to a smaller dissolution rate of the metastable phase. In the case of Asn, there is a region in the phase diagram where the hydrate is the stable form and a region where the hydrate and anhydrous form coexist. Care was taken that only the solubility of the anhydrous Asn was measured. This was confirmed by taking XRPD measurements of crystals crystallized under conditions similar (same temperature, same solvent composition, slightly higher solid content) to those during the SA measurements .
Conclusion
We found that the solvent addition method produces reliable solubility results for the organic compound p-hydroxybenzoic acid in the solvent acetic acid. The effect of changing the addition rate in solvent addition measurements follows a similar trend to the effect of changing the heating rate in the temperature variation method. Using low enough heating and addition rates, solubility data have been obtained that agree well with the more laborious suspension equilibrium method. The use of the SA method seems especially valuable in the case of solvent mixtures and other multi-component systems, e.g. with multiple solvents or solutes, in which the TV method cannot be applied easily. It was shown that the SA method works well for determining a co-crystal phase diagram as well as a solvent mixture phase diagram for anti-solvent crystallization. The SA measurements for the co-crystal system showed that the pure component solubilities are strongly influenced by the presence of the other component while that of the co-crystal is not. The SA method is therefore a suitable technique to investigate non-idealities in certain multi-component systems.
ASSOCIATED CONTENT
Supporting Information. N/A
AUTHOR INFORMATION Corresponding Author
Author Contributions
The manuscript was written through contributions of all authors. All authors have given approval to the final version of the manuscript.
Notes
The authors declare no competing financial interest.
ACKNOWLEDGMENT
M. Hassan is acknowledged for his work on the INA-CBZ system, M. Stam and G. Scheuer are acknowledged for their experimental work on the DL-Asn system.
ABBREVIATIONS
EqC, Equilibrium Concentration; TV, Temperature Variation; SA, Solvent Addition; HBA, p-hydroxybenzoic acid; DL-Asn, DL-asparagine; CBZ, carbamazepine; INA, isonicotinamide.
REFERENCES
1. Mullin, J. W., Crystallization. 3 ed.; Butterworth-Heinemann Ltd.: Oxford, 1993. 2. Dufour, F.; Stichel, B.; Grayson, J. I., Org. Process Res. Dev. 2013, 17, 568-577. 3. Haas, C.; Drenth, J., J. Cryst. Growth 1999, 196, 388-394.
4. Chiarella, R. A.; Davey, R. J.; Peterson, M. L., Cryst. Growth Des. 2007, 7, 1223-1226. 5. Crocker, L. S.; Ge, Z.; Abrahim, A.; Hartman, R.; Xu, J., Org. Process Res. Dev. 2003, 7, 958-961.
6. Veesler, S.; Revalor, E.; Bottini, O.; Hoff, C., Org. Process Res. Dev. 2006, 10, 841-845. 7. Myerson, A., Handbook of Industrial Crystallization. Butterworth Heinemann2001. 8. Koutsoukos, P. G.; Kofina, A. N.; Kenellopoulou, D. G., Pure Appl. Chem. 2007, 79, 825-850.
9. Hermanto, M. W.; He, G.; Tjahjono, M.; Chow, P. S.; Tan, R. B. H.; Garland, M., Chem. Eng. Res. Des. 2011, 89, 2613-2619.
10. Vellema, J.; Hunfeld, N. G. M.; Van den Akker, H. E. A.; ter Horst, J. H., Eur. J. Pharm. Sci. 2011, 44, 621-626.
11. Srisanga, S.; ter Horst, J. H., Cryst. Growth Des. 2010, 10, 1808-1812. 12. Mullin, J. W.; Sipek, M., J. Chem. Eng. Data 1981, 26, 164-165.
14. Marchand, P.; Lefèbvre, L. c.; Querniard, F.; Cardinaël, P.; Perez, G.; Counioux, J.-J.; Coquerel, G., Tetrahedron: Asymmetry 2004, 15, 2455-2465.
15. Labarthe, E.; Bougrine, A. J.; Delalu, H.; Berthet, J.; Counioux, J. J., J. Therm. Anal. Calorim. 2009, 95, 135-139.
16. Berthet, J.; Tenu, R.; Counioux, J. J., Thermochim. Acta 1983, 68, 145-154. 17. Nordström, F. L.; Rasmuson, Å. C., J. Pharm. Sci. 2006, 95, 748-760.
18. ter Horst, J. H.; Deij, M. A.; Cains, P. W., Cryst. Growth Des. 2009, 9, 1531-1537. 19. Muller, F. L.; Fielding, M.; Black, S., Org. Process Res. Dev. 2009, 13, 1315-1321. 20. Good, D. J.; Rodríguez-Hornedo, N., Cryst. Growth Des. 2009, 9, 2252-2264. 21. Horst, J. H. t.; Cains, P. W., Cryst. Growth Des. 2008, 8, 2537-2542.
22. Hao, H.; Barrett, M.; Hu, Y.; Su, W.; Ferguson, S.; Wood, B.; Glennon, B., Org. Process Res. Dev. 2012, 16, 35-41.