Experimental Study and Modelling
of a Low Pressure
RF Generated Magnetoplasma
by
Chunshi Cui
May 1992
A thesis submitted for the degree of
Doctor of Philosophy
This thesis is entirely my own work,
except where explicitly indicated.
Chunshi Cui
Plasma Research Laboratory
Research School of Physical Sciences and Engineering
The Australian National University
Acknowledgements
It is my pleasure to thank my supervisors, Dr. Rod Boswell and Professor Sydney Hambergen Without their understanding and encouragement, this work would have never been finished. Dr. Boswell stimulated my interest in many of the problems addressed in this thesis and I have benefited greatly from his sparkling ideas, en thusiasm and intution as an experimental physicist. Professor Hamberger has given me many valuable comments and suggestions for this thesis and I have gained much from his wide-ranging experience in plasma physics. With great affection and respect I acknowledge the tremendous support I, and other overseas students, received from Professor Hamberger. His concerns were not limited to our problems at work and his help in many other aspects is really appreciated. Further, without his consistent efforts in improving my written English, this thesis would have ended up full of “Chinese-English”.
I wish particularly to thank Dr. Robert Porteous and Dr. Harold Persing for their many hours spent on proof reading the thesis. Over the years, Robert, a pioneer on WOMBAT, has been of great assistance in this work through patient explanations and stimulating discussions. I am particularly grateful for his generosity in allowing me to use some of his unpublished results (as indicated in Chapter 5). Since Harold joined this laboratory, his interest in the work and the thesis has been very encouraging and I have benefited greatly from the discussions with him on many topics involved in this thesis. My special thanks go to Dr. Andrew Perry from whom I have acquired many experimental skills, and especially for his help in establishing the probe data acquisition system on WOMBAT and the use of his probe analysis program. I am very grateful to Dr. Boyd Blackwell, a versatile researcher who has been very helpful, particularly in discussions of plasma physics, eliminating rf noise and clearing the jammed communication lines for the data acquisition system. I also wish to thank Dr. Ian Donnelly (of Sydney University and ANSTO) for informative discussions and suggestions.
topic might have concerned “atmospheric” plasmas; and also Allen Campbell for his technical support. I also owe a great debt to Peter Lloyd, Steve Hyde and Eddie Wedhom not only for their technical assistance in my work, but also for their kindness in many other aspects (eg. free service of an old car of my own age by Peter and Steve, and a free Christmas holiday in Eddie’s beautiful farm home). In addition, Peter and his wife, Judy, have been very special friends who have been always there whenever I needed help, especially during the most difficult times.
I wish to thank my fellow students of PRL, particularly Helen Smith, Peter Loewenhardt, Beichao Zhang, Bert Ellingboe and Mark Jamyk for proof reading the thesis. My office-mates, Darryn Schneider et al, deserve my special thanks for being very tolerant and understanding towards my priority use of the computer terminal (and often the telephone as well). I also wish to thank Helen Hawes, Gina James and Gaelle Giroult-Matlakowski for their friendliness and help. There are some others who have given me much by way of encouragement and friendship: Amstein Prytz, David Vender, Irene Wyld, Xuehua Shi, Dingfa Zhou, Peiyuan Zhu, Henry Gardner and Ian Morey. I am particularly grateful to Amstein for free use of his beautifully written FPLOT plotting software which has produced most of the graphs in this thesis.
Among the many friendly and helpful people in this school, I am particularly indebted to the school Secretary, Mr. Richard Hickman, for his kind patience and as well as Dr. Iain MacLeod who has been of great help in my English. I acknowledge the assistance from the staff of the school computer and electronics units, particularly Julie Dalco, Bill Alford, Cathy Gillespie, Tom Rhymes and Tony Cullen. I also wish to thank Magaret Maguire, Di Hodges and Wally Hopkinson.
There are many off-campus friends who have helped me in many other aspects over the years. I thank particularly Dr. Alistair Drake and his wife, Ms. Carmen Zanetti, and Mr. Andrew Chin for their kindness and support which have always warmed my heart.
thank him especially for our discussions in physics, which are sometimes amazingly helpful (although I am often sceptical of a laser physicist’s opinion), and for his help in drawing many of the graphs in this thesis.
I acknowledge the scholarship of the Australian National University.
This thesis is dedicated to all my family in China
Abstract
A low pressure, radio frequency (rf), magnetized plasma generated in the WOM BAT apparatus has been investigated through extensive experiments and theoretical modelling.
The plasma studied here is characterized by low electron density (108 to 5 x l0 9 cm-3 ) and low electron temperature (1 to 5 eV), and is only weakly collisional. The plasma phenomena are complicated in particular by the kinetics of non-Maxwellian electrons in a non-uniform magnetic field. The electron energy distribution func tions are usually anisotropic and possess a “hot tail” in the high energy region. An anisotropic, bi-Maxwellian electron energy distribution is used to model this plasma. Both Langmuir probe and Bernstein wave interferometry techniques are extensively employed to diagnose the plasma experimentally.
This work is primarily concerned with hydrogen plasmas for which the particle dynamics are examined and an existing model [35] is adapted to describe the balance between particle creation and loss. The modelling results demonstrate the importance of the “hot tail” electrons in sustaining the hydrogen plasma which has a very low bulk electron temperature. An experimental comparison of hydrogen and argon plasmas has been conducted and the results have shown the plasmas formed in the two gases are very different. In addition, an analytic model has been developed to deal with the effect of the non-uniform magnetic field on the plasma, and many of the modelling results are consistent with experimental observations.
The plasma phenomena are further complicated by the existence of the electron cyclotron resonance regions in the system. The effects of excitation and electron cyclotron frequencies on the plasma are explored through detailed experiments. A qualitative analysis of these experimental results has provided some very useful information for the optimization of the excitation frequency and magnetic field profile (as they relate to plasma processing) in this type of plasma device.
Contents
1 Introduction I
1.1 Brief Review of Rf Discharge P lasm as... 2
1.2 Space Plasm as... 4
1.3 Thesis O u tlin e... 4
2 WOMBAT Apparatus and Diagnostics 7 2.1 WOMBAT A pparatus... 7
2.1.1 Magnetic Field ... 9
2.1.2 Pumping and Gas Filling Systems ... 10
2.1.3 Plasma Source... 12
2.2 Langmuir Probe T h eo ry ... 13
2.2.1 Fundamental Theory ... 13
2.2.2 Effects of Magnetic F ie ld ... 18
2.2.3 Effects of Rf Field ... 19
2.3 Probes and Data Acquisition S y s te m ... 23
2.4 Probe Data Analysis... 25
2.4.1 Measurements of Electron Energy Distribution and Plasma Potential... 25
2.5 Bernstein Wave D isp ersio n ... 29
2.5.1 Dispersion in an Isotropie Maxwellian P lasm a... 29
2.5.2 Dispersion in a non-Maxwellian P la s m a ... 31
2.6 Bernstein Wave Interferom etry... 32
2.6.1 The Interferometer... 32
2.6.2 Derivation of Temperature and Density... 33
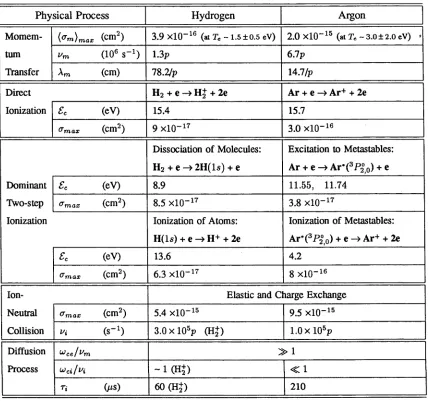
3 Particle Dynamics 36 3.1 Collisional Processes ... 37
3.1.1 Elastic C o llisio n s... 38
3.1.2 Rotational and Vibrational Excitation... 40
3.1.3 Electronic Excitation and D issociation... 41
3.1.4 Io n izatio n ... 42
3.1.5 Negative I o n s ... 43
3.2 Particle Losses due to Diffusion... 45
3.2.1 Diffusion of Neutral Particles... 46
3.2.2 Magnetic Confinement in WOMBAT... 46
3.2.3 Ion D ynam ics... 47
3.2.4 Diffusion-Controlled P la s m a ... 52
3.3 Rate Equations... 53
3.3.1 Assumptions... 53
3.3.2 Rate Equations ... 54
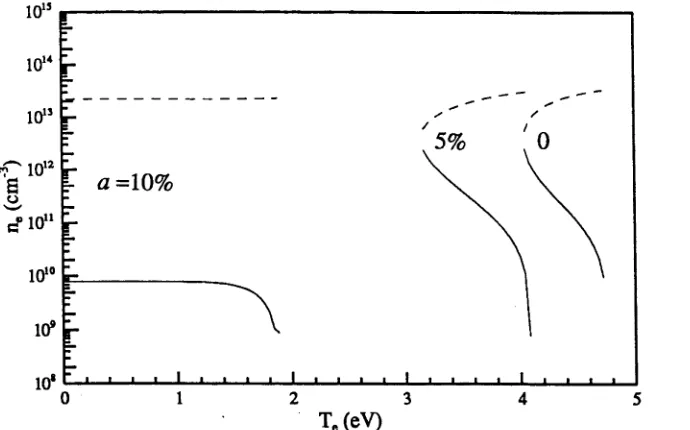
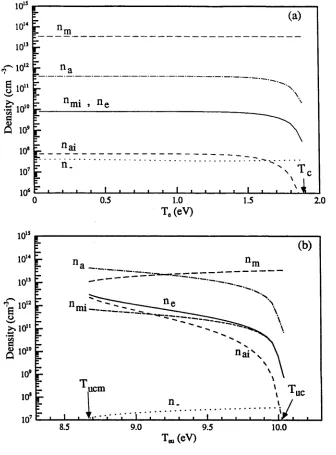
3.4 Solutions for Particle D e n sitie s... 57
3.4.1 For a Maxwellian D istrib u tio n... 58
3.5 Summary... 65
4 Plasma Characteristics: Comparison between Hydrogen and Argon Plas mas 67 4.1 General Background... 68
4.1.1 Collision and Diffusion Processes... 69
4.1.2 Power Balance... 72
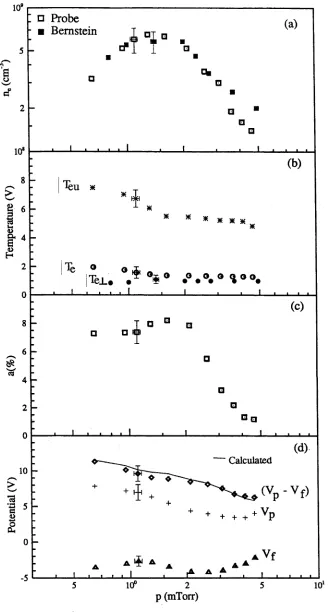
4.2 Dependence on Pressure... 73
4.2.1 The Hydrogen Plasm a... 73
4.2.2 The Argon Plasma... 77
4.3 Radial P rofiles... 79
4.3.1 The Hydrogen Plasm a... 79
4.3.2 The Argon Plasma... 82
4.4 Dependence on P ow er... 84
4.4.1 The Hydrogen Plasm a... 84
4.4.2 The Argon Plasma... 86
4.5 Summary... 87
5 Effect of Magnetic Mirror on Plasma Equilibrium 89 5.1 The M odel... 90
5.1.1 Model Assumptions... 90
5.1.2 Phase Space E le m e n t... 93
5.1.3 Flux of E le c tro n s... 95
5.1.4 Axial Evolution of the P la s m a ... 96
5.2 Modelling R e su lts... 98
5.2.2 ECR Distribution 100
5.2.3 Beam Type D istrib u tio n ...105
5.3 Comparison with Experimental R e s u lts ... 109
5.3.1 Sub-ECR Field Case ... I l l 5.3.2 Near-ECR Field C a s e ... 114
5.4 Sum m ary... 114
6 Effects of Excitation and Electron Cyclotron Frequencies 117 6.1 Experimental Observations ... 118
6.1.1 Effect of Source Magnetic F i e l d ... 118
6.1.2 Effect of Excitation F r e q u e n c y ... 121
6.1.3 Effect of Tuning C irc u it...126
6.2 Power Coupling M e c h a n ism s ... 130
6.2.1 Wave Propagation under Condition A ...131
6.2.2 Surface Waves under Condition B ...131
6.2.3 ECR E f f e c t ...132
6.2.4 Discussion of the R e s u l t s ... 133
6.3 Sum m ary...135
Chapter 1
Introduction
In this thesis, a low pressure radio frequency (rf) generated plasma is studied through extensive experimental observations and theoretical modelling. Efforts have been made to understand some of the fundamental physical processes involved in this particular rf discharge plasma.
This work is motivated by the increasing applications of low temperature, low pressure rf plasmas in the areas of plasma processing [31, 80, 87] and laboratory simulation studies of space plasmas [73, 95]. In the first instance, the understand ing and control of plasma characteristics is essential to achieve optimal processing of semiconductors [46, 53, 93]; in the second instance, the simulation of plasma and plasma-wave phenomena naturally occurring in the ionosphere requires detailed knowledge of the background plasma under laboratory conditions [5, 57, 104].
by the nonuniform magnetic field which exists in the source region. This thesis focuses upon these particular effects which have not been previously studied in this type of plasma device.
1.1 Brief Review of Rf Discharge Plasmas
Since the first observation by Thomson [98] more than one century ago, rf discharge plasmas have been extensively investigated through laboratory experiments [2, 21, 85], theoretical modelling [40, 45] and computer simulations [60, 101].
The rf discharges are often classified with respect to the form of the electromag netic field that causes the breakdown and sustains the discharge. One type is the inductive rf discharge, which occurs when the electromagnetic field in the plasma is induced by a change in the magnetic flux within the plasma. A typical example is the rf coil-coupled discharge first observed by Babat [3]. Another type is the capacitive discharge, where the electrodes are inside or outside the plasma, and the electro magnetic field in the plasmas is dominated by the electrostatic component. An rf parallel-plate discharge, which is commonly used in the current generation of plasma etching reactors in the microelectronics industry, capacitively couples the rf power into the plasma [79]. In both cases mentioned above, the free-space wavelength of the rf fields is longer than the plasma dimensions. The third type of discharge is the wave-sustained discharge where the plasma is excited by the electromagnetic fields of either propagating waves inside the plasma body [15] or surface waves on the boundary of the plasma [41]. In this case, the wavelength is generally shorter than the plasma dimensions, the length Lpi or diameter Dpi for cylindrical plasmas such as in WOMBAT.
A typical example of this is the helicon plasma source, which operates by cou pling externally generated electromagnetic fields into a plasma confined by an axial magnetic field. The helicon wave propagates in the frequency band ujci <C cu <C u;ce (usually lj <C u pe), where uj=2k f rj is the angular wave frequency, and ujpe, cvce and
ujci are the angular electron plasma frequency, cyclotron frequencies of electrons and ions, respectively, defined by
where c is the speed of light, e, n e and rrij are the charge, density and mass of electrons (or ions). The dispersion is described by [13]
where A is the wavelength in cm. Previous studies in WOMBAT have shown that the plasma generated by the helicon source can change mode as the wavelength decreases with increasing density [21]. When A > Lpi, the discharge is dominated by capacitive coupling which is characterized by relatively low density and high plasma potential; when A < Lpl, the helicon wave starts to propagate and the rf energy is coupled into the plasma through plasma-wave interactions. In this instance, the plasma has relatively high density but low plasma potential: these are desirable qualities for plasma processing, which often requires high fluxes of low energy ions [75]. Thus, helicon plasma sources may play a very important role in the next generation of plasma processing reactors in the microelectronics industry.
The rf discharge studied in this thesis is obtained in a similar way but with a different antenna geometry and excitation frequency range to that studied previously [81]. Although the single loop antenna used here is usually considered to be mainly inductively coupled [3], the rf voltage drop along the antenna always provides a capacitive component for the discharge. At certain frequencies, different plasma waves may propagate in the plasma, and a resonance may occur in the region where
tu ~ u ce, the electron cyclotron resonance (ECR). Therefore, the plasma generation
(1.1)
(1.2)
1 - u l u ce U / U c e
mechanism for the plasma studied here can be very complex. The main focus of this thesis is the plasma behaviour in the diffusion region rather than that in the source.
1.2 Space Plasmas
Space plasmas are typically magnetized and characterized by large dimension, low temperature and low density. Some very hot electrons are observed in the auroral region, a result of acceleration earthward by electric fields [6]. These electrons interacting with the magnetized ionospheric plasma can produce very rich wave phenomena such as VLF radiation [14] and naturally occurring three-wave decay [38].
In recent years many studies on beam-plasma interactions have been carried out through laboratory experiments [9] and computer simulations [71]. The WOMBAT apparatus was originally built in order to produce a reasonably uniform, large volume plasma without electrodes, which could be used for the studies of low temperature and low density plasmas and of beam-plasma interactions. It was also the predecessor of smaller helicon plasma sources currently used for plasma processing. The first research project on WOMBAT was conducted by Porteous, with emphasis on the equilibrium of the rf generated argon plasma [81]. His work has provided very useful information concerning this type of diffusion rf plasma device.
Some research on beam-plasma discharges was also carried out in WOMBAT by Boswell et al. [17] and the experimental results compared with computer simulations [72]. Their studies successfully explained some wave phenomena observed during the different stages of the beam-plasma discharge [19].
1.3 Thesis Outline
tech-niques are discussed. A bi-Maxwellian model is developed for the probe analysis to describe the “hot tails” appearing on the electron energy distributions. Bi-Maxwellian models are used throughout the whole thesis in both theoretical and experimental analysis.
The main interest of this work is hydrogen plasmas, which are studied through detailed experiments and modelling. For the purpose of comparison, argon plasmas are also investigated experimentally.
Chapter 3 deals with the particle balance in the hydrogen plasma. The principal collisional processes and particle losses due to diffusion to the walls are first dis cussed, and then a theoretical model by Donnelly et al. [35] is adapted to calculate the steady state particle densities for the bi-Maxwellian, nonuniform hydrogen plasma. The results presented in this chapter explain how the hydrogen plasma is sustained by the “hot tail” electrons even when most of the electrons have their energy around 1.5 eV.
In Chapter 4, experimental observations of both hydrogen and argon plasmas are presented and compared. In order to limit the number of the variable parameters, and to reduce the the degree of complication involved in the physical processes, the results reported in this chapter are taken with both the magnetic field profile and the rf frequency fixed. The analysis of the particle dynamics in the hydrogen plasma in Chapter 3 serves as a useful guide for some of the physical explanation of the hydrogen results presented in this chapter. The discussion of the argon results are mostly based on the previous work by Porteous [81].
As has been previously mentioned, the plasma behaviour in WOMBAT is further complicated by the nonuniform magnetic field, converging from the source to the diffusion region. The effect of such a magnetic field on the electron kinetics is treated in Chapter 4. An analytical model involving anisotropic bi-Maxwellian distributions is developed to describe the spatial evolution of the plasma, and the modelling results are compared with the experimental data.
only to the magnetic field profiles but also to whether the excitation frequency is below or above the electron cyclotron frequency in the source region. In Chapter 6, these effects are further explored through detailed experiments where both magnetic field profile and excitation frequency are varied. A quantitative discussion of these results is given based on a simple analysis for the power coupling mechanisms.
Chapter 2
WOMBAT Apparatus and Diagnostics
All the experiments reported in this thesis were carried out in the WOMBAT appa ratus, which will be initially described in Sec. 2.1. Langmuir probes and electron Bernstein wave interferometry were extensively used to determine the plasma density and electron energy distribution function. The rest of the chapter will focus upon the applications of these two diagnostics with emphasis on the special effects occurring in the WOMBAT plasma. Another diagnostic technique, the electron energy anal
yser, was only used rarely and so will not be discussed here. A detailed description on this topic is given in [81].
2.1 WOMBAT Apparatus
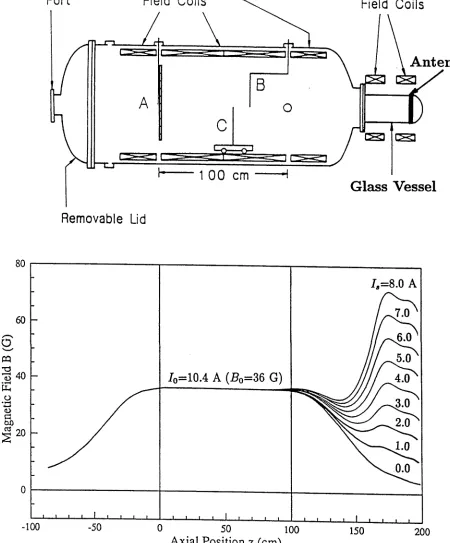
The WOMBAT apparatus consists of two parts. The first is a large cylindrical system with a non-magnetic, stainless steel vacuum vessel, 100 cm inner-diameter and 240 cm long. A glass vessel, 20 cm diameter and 50 cm long, forms the second part. It is mounted at one end with an rf antenna around it. These two parts distinguish two different plasma regions, referred to as the diffusion and source regions. A 15 cm diameter vacuum port is mounted on a removable lid at the other (non-source) end.
Vacuum Main Magnetic
Field Coils
Source M agnetic
Field Coils
A n ten n a
1 0 0 cm
G lass V essel
Removable Lid
Jo=10.4 A ( £ 0=36 G)
50
Axial Position z (cm)
[image:18.556.47.497.89.632.2]from the vacuum port. Several diagnostic ports are radially mounted on the main chamber with four at 2=0 and four at 2=100 cm. Each of the two sets has two ports
horizontally aligned and the other two vertical. A metal plate is located at 2=0 where
the plasma is terminated (see A in Fig. 2.1a). A rotating probe, with a horizontal arm 30 cm long and rotation angle between +45° (south) to —45° (north), through the top port at 2=100 cm (see B in Fig. 2.1a). Inside the chamber, an axially movable trolley is used to carry probes to detect the axial variation of plasma parameters (see C in Fig. 2.1a). Two radially movable probes are mounted through the horizontal ports at 2=100 cm. All the measurements of wave interferometry and most probe results have been taken at this axial position.
2.1.1 Magnetic Field
The magnetic fields in WOMBAT are produced by a set of magnetic coils wound on a cylindrical aluminium former with 88 cm inner diameter, positioned coaxially within the main chamber. A second set of Helmholtz coils is positioned coaxially outside the glass vessel in the source region.
The axial magnetic component measured by a Hall probe is shown in Fig. 2.1b The field in the main chamber remains uniform to ± 1% in the radial direction out to a radius of 30 cm and constant to 0.5% along the axis (0 < 2 < 100 cm). This
field value in this uniform region is represented by B0. The source magnetic field (150 < 2 < 200 cm) and the field in the region between the main chamber and the
source (100 < 2 < 150 cm) are far from uniform both axially and radially. Because
The inhomogeneity of the source magnetic field and its effects on the plasma were not considered in previous studies in WOMBAT when the source was run at 7 MHz [21]. Since the excitation frequency, f rj , was much less than the electron cyclotron frequency at the position where the antenna was situated, f ces, cyclotron resonance had no effect on the plasma behaviour. However, in this work these effects must be taken into account because of some “unusual” phenomena observed when
f rj is varied across f ces (see Chapter 5 and 6). The converging magnetic field under the standard conditions also introduces an additional complication to the physics involving magnetic mirror effects, which is dealt with in Chapter 5.
2.1.2 Pumping and Gas Filling Systems
From atmospheric pressure, the initial pump down of the chamber is by a rotary pump, and it takes about one hour to reach the fore-pressure of the diffusion pump, 0.5 Torr. The high vacuum is obtained using a Varian VHS-6 diffusion pump. The maximum speed of the pump is 2400 1 s-1 (air) with an operating range between 1 x 10⁻³ to 5 x 10~9 Torr. The pump is connected to the vacuum port by an L-shaped vacuum line. A cold trap is mounted above the pump to stop the vacuum oil reaching the vacuum chamber. The base pressure (typically around 3 x 10⁻⁶ to 5 x 10“6 Torr) can normally be obtained after two days pumping. The pressures are monitored by a Baratron gauge with the operating range from 0.1 mTorr to 1 Torr. In the range of 0.5 to 1 mTorr, the random error in reading can be as high as 10% caused by zero shifting. The shift is sensitive to the temperature and noise signal of the system and the maximum shift is 0.05 mTorr during a normal 5 hour experimental period.
The particle removal rate by pumping is dependent on the pressure of the system, the cross-section S c and Clausing factor K of the pumping line [77]. The particle loss process due to pumping may affect the dynamics of neutral particles when it is competing with other loss mechanisms such as dissociation, ionization and wall absorption. The pumping loss rate can be estimated by
where Vs is the chamber volume and kB is Boltzmann constant; n, (v), M and T are the density, the average velocity, the mass and the temperature of neutral particles respectively. When these symbols have subscripts “0” and “a”, they represent H2 molecules and H atoms respectively. Applying the method used by Porteous [81], the total Clausing factor is obtained
K = 8.5 x lO " 2.
Assuming To=300 K, we have
(v0) = 1.6 x 105 cm s“ 1.
For WOMBAT, Sc=176.7 cm2 and VS= \A 5 xlO6 cm3. Applying all these values to Eqn. 2.1, the loss rate of H2 due to pumping is obtained
dn
dt p u m p (2.1)
= 0.42no cm 3 s 1 (2.2)
p u m p
At p=l mTorr, H2 molecules have
V k BTc
3.4 x lO 13 c m '3, (2.3)
so their pumping flow rate is
dnp t /
dt p u m pVs pum p
n 0
5.9 x 105 cm3 s-1 46.7 seem
2.1.3 Plasma Source
The plasma is created by applying rf power to the antenna around the the glass vessel. The signal from a Wavetek rf generator is fed into a Kalmus broad-band rf amplifier (10 - 200 MHz), producing maximum output power of 100 W. The standard frequency and power are chosen at 72 MHz and 40 W respectively.
The rf power is measured by various rf power meters for different frequency ranges. The readings on all those power meters have been calibrated against a high- accuracy Bird 4391 rf power analyser, whose systematic uncertainty is less than 5%. The total uncertainty on power measurements is around 10 %.
To minimize the change in external parameters while the rf frequency is varied from 20 MHz to 90 MHz, a single-loop ring antenna has been used for all experiments over the whole frequency range even though it has been demonstrated that a helicon antenna works better at low rf frequencies [21]. The advantage of the single-loop antenna lies in its low inductance which makes it possible to tune frequencies as high as 90 MHz.
Two types of tuning circuit have been used for different frequencies. Fig. 2.2a and Fig. 2.2b show the tuning circuits for f r j < 4 0 MHz and for / r/ > 40 MHz respectively. The first one is the standard tv rf tuning circuit which is commonly
/ V T
vT
lC2 4 ^ Cl
RF
(b)
Figure 2.2: RF tuning circuits with 10 < C\ < 50 pF, 50 < C2 ^ 500 pF and 50 < C3 < 1000 pF. (a) tv tuning circuit for f r f < 40 MHz and (b) for f r i > 4 0 MHz
used for low frequency rf. In this work, the second one has been found necessary for tuning high frequencies. To examine the effect due to the circuit change at 40 MHz some measurements on plasma properties have been taken with each circuit respectively over a narrow frequency range around 40 MHz. Tuning is frequently adjusted during all the experiments to keep the standing wave ratio (SWR) always less than 1.1.
2.2 Langmuir Probe Theory
The electron energy distribution in WOMBAT is usually non-Maxwellian with a “hot tail”. Langmuir probe characteristics can be very complex in this non-Maxwellian plasma in the presence of magnetic and rf fields. These effects will be addressed in particular in this section.
2.2.1 Fundamental Theory
Experimentally, it has been found that at low pressures the electron energy distribution of the WOMBAT plasma usually has a “hot tail” [16]. As shown later, such a distribution is very close to a bi-Maxwellian which has most electrons at Te, referred to as the bulk or lower temperature, and a small population at Teu (tail or upper temperature), described by
f ( v ) = ( l - a ) m e
2-jrkRTP exp
m ev
2&RT„ + a 27rkBTe exp
m ev
2kBTeu (2.4)
where v is the velocity of electrons and a is the relative population of the upper temperature component. The average energy of electrons over this distribution is
- a)kBTe + akBTeu). (2.5) We define an effective temperature
and a mean energy
{£) = \ k BTeSS
which allows the use of Tejj as a useful parameter to represent the average energy
o f electrons.
Classical Langmuir probe theory discussed in this section is based on the follow
ing assumptions [63, 94]: the plasma consists of
(1) bi-Maxwellian electrons;
(2) Single positive ion species and no negative ions;
(3) Collisionless thin sheath satisfying A e , A, D p > A # ;
(4) Very weak magnetic field with r Le, r Li D p, \ D and no rf field.
Here D pand AD are the characteristic dimension o f the probe and the Debye length,
while \ j and r i j are the mean free path and Larmor radius of the jth species of
charged particles (eg. a subscript of “i ” denotes ions; “e” denotes electrons). The
Debye length and Larmor radius are defined by
where rrij and Tj are the mass and the temperature o f charged particles, and B is the
static magnetic field. Of these assumptions, (1) is valid for the plasma in WOMBAT
under most o f the experimental conditions. Validity o f (2) and (3) and (4) will be
discussed later.
Electron Current
The electron flux to a probe is given by
where U|| is the velocity component perpendicular to the probe surface and d v rep
resents the elementary volume in velocity space and the integral is evaluated over (2.7)
and
(2.8)
all permitted values o f velocity. It should be noted that n e and f ( v ) are the values o f the electron density and energy distribution in the unperturbed plasma far away
from the sheath region formed around the probe.
All the probe results presented in this thesis were taken by a circular planar (disk)
probe o f diameter D p- 1.5 cm situated with its surface perpendicular to B . It is well
known that the presence of B can cause anisotropic electron energy distributions,
so we should examine this effect on the electron flux to the probe. We first use an
anisotropic Maxwellian with a form:
/ ( « II. « 1 ) 1 y 1 exD ( m ' v l
2 ” kB ) ^jT enTel V 2hßTc11 2kBTexJ
(2.10)
where Uy, Te]l and ux, Tel are the components of the electron velocity and temperature
parallel and perpendicular to B respectively. When the probe is biased with a voltage
V < Vp, where Vp is the plasma potential, it can collect only the electrons with their parallel energy greater than the retarding potential energy o f the sheath field, i.e.
m euJ/2 > e{Vp — V ). Substituting / ( u jhux) into Eqn. 2.9, and integrating over
[uh > (2eVp/ m e)1/'2, v± > 0] for V < Vp or [uy > 0, vL > 0] for V > Vp> we arrive at r e||
7T m e J 8kBTe11 \
7rm e J
. k ß 1 e II V < vp
v>vp
(2.11)
In this case, the electron flux is only dependent on the parallel temperature, which
means the probe situated in this way only measures the parallel energy distributions.
For anisotropic bi-Maxwellian distributions, formed by a sum o f the two anisotropic
Maxwellian distributions, the above conclusion is also applicable. Therefore, we
can use the one dimensional form given in Eqn. 2.4 to represent the distribution
in parallel direction but with the subscript “ ||” omitted in the following discussion.
Similarly, we can obtain the electron flux for bi-Maxwellian distributions for V < V P
r ne)(^ \ (8kBTe\ 2
r ' = T ( 1 - a ) ( ^ 7 j exp
< V - V P)
kBTe + u 7rmf exp
e(V-VP)'
and for V > Vn
r - üi
e 4 ( i - a ) ( 8feT<7T m (
) +ü(
S iv X
jrrn.
n
(2.12)
The total electron current can then be derived from electron flux,
/ e = eApFe
where Ap=ttDp2/A is the collecting area of the probe. Substituting Eqns. 2.12 and 2.13 into above equation, we have
h
l e o
7?
(1 - a) exp (r/) + a^/gexp ( | ) ] (1 - a )+ a^/q\
k~TP
€ T l e A p
V Z7rme
< V - V p ) kBTe Ten
Te
T) < 0 rj > 0
(2.14)
(2.15)
(2.16)
(2.17)
where Ie0 is termed the electron saturation current.
The electron currents, calculated from Eqn. 2.14 as a function of rj, are plotted in Fig. 2.3 for different values of a. The figure clearly shows that I e increases with
c(V
—
V)
a over the whole range of rj = v > T p /, and at rj < —10 the electron current
K B - L e
for a=0.04 differs significantly from that with no hot electrons (a=0). In principle,
a =1.00
[image:26.556.110.439.463.677.2]Eqn. 2.14 can be use to determine distributions when I e is given by experiment, and
Eqn. 2.15 can be used for electron density measurements. Under real experimental
conditions, however, precautions must be taken because the collected electron current
may be seriously affected by the presence o f magnetic or rf fields. Generally, it is
difficult to determine accurately the plasma density from I e0.
Ion Saturation Current
The ion current to a probe is determined by the velocity o f the ions entering the
sheath formed around the probe. This velocity is often called the Bohm velocity, v B.
For a bi-Maxwellian plasma, it is given by [18]
V B
t b
1 — a ( l — 1 )
(2.18)
(2.19)
Under the assumptions of (1) to (4) shown in Sec. 2.2.1, the ion saturation current
is given by classical Langmuir probe theory [26]
h o - - e r i i A pvB
1/2
= 2 e niAp
m,
kBTe
1 - a ( l -
h
(2.20)
(2.21)
where is the ion density. Eqn. 2.21 is commonly used to determine the plasma
density n provided n e= nt=n.
In a low pressure plasma, the sheath thickness is often comparable to the probe
dimension and varies with the bias voltage on the probe [1]. For cylindrical probes,
Laframboise [61] studied the effect of finite sheath thickness and showed the ion
current has a nonlinear dependence on the ratio between o f the probe radius and
Debye length. A planar probe is a better choice in terms of simplicity, which is one
o f the reasons for using the planar probe in this work. When the diameter of the
disk probe is much greater than the Debye length, the plane sheath is well defined
is still valid for ion collection and thus Eqn. 2.21 can be used to calculate when /,o is obtained from experiments.
One useful quantity, floating potential Vj, can be defined by setting Ie=Ii0, which means at V=Vj the probe draws zero net current. From Eqn. 2.14 and 2.21, we can obtain
j ( l — a) exp ~ VT)
kRTP + ay/qtx p
<Vf - Vp)
qkBTe = 1 (2.22)
By solving this equation, (VJ, — Vf) can be calculated as a function of a, Te and Teu.
2.2.2 Effects of Magnetic Field
When an external magnetic field B is applied, the most noticeable effect is the reduction of the electron saturation current, resulting in the apparent decrease of VJ,. This is presumably because the electron current, normally provided by the electrons diffusing isotropically into the probe sheath, is now decreased by the presence of B , which makes the electrons diffuse at a reduced rate into the cylindrical “flux” tube defined by the lines of force intercepted by the probe and the ends of the machine. This phenomenon is often called “electron depletion”. There have been many published papers on this topic [10, 11, 12, 86] but each theory has its limitation in experimental applications for different plasma conditions [28].
The decrease of Vp can be evaluated by [92]
AVP
K
kR TP
1 + 16 Am \
3 tv Dp)
16 Am 1/2\ 1
3 7TDp* ) (2.23)
(2.24)
where vm and Am are the collision frequency and mean free path for momentum transfer process between electrons and neutrals, which are discussed in detail in Chapter 3. Although this equation was originally derived for a Maxwellian plasma, it can be extended to a bi-Maxwellian case by using Tefj instead of Te.
Under standard experimental conditions in WOMBAT with B=B0=36 G, p= 1 mTorr, we have (see Chapter 3)
um ~ 1.3 MHz, Am ~ 78.2 cm and coce = 6.28 x 10⁸ rad/s.
Putting the above values and Dp=1.5 cm into Eqn. 2.23, we finally obtain
AVP = 1.1kBTeff
This result shows that the apparent plasma potential is lowered by approximately kBTejj/e for plasma conditions not too far away from standard conditions.
2.2.3 Effects of Rf Field
We assume the plasma potential varies as
Vp(t) = Vp + Vrj cos ujt (2.25)
where Vrj is the amplitude of the rf potential. Replacing Vp by Vp(t) in Eqn. 2.14, the time-varying electron current can be derived [51]:
m =
| I g o j ( l — a ) ex p [rj(t)\ + a y ^ e x p } , T ] ( t ) <0
(2.26)
( ^eo: *?W > o
n i t ) = f] — T }rf COS LOt (2.27)
V r f =
Vrj
kBT e (2.28)
The time-averaged electron current is defined as
uj r2tt/w
{Ie)
It must be noted that the phase point at which Ie becomes saturated depends on ij/rirj; the integral in above equation should be carried out in three regions of tj\ (a)
t] < — rfrf, (b) -ijrf < t] < and (c) rj > . The time-averaged electron current thus
obtained is
Ue> =
/ eo[(l-a )e x p (7 /)J 0(^/ ) + a ^ e x p ( 2 ) z 0( ^ - ) ] ,
< /eo[(l-a)exp(7/)Q(7y,r^/ ) + exp(^) Q ( | , ^ ) ] ,
■feo 5
V^-Vrf
-rfrf<il<r}rf (2.29)
where 10 is the modified Bessel function of first kind and of zero order and the function Q is defined by
1 f ao
= — exp(7/ cos a)da
7T Jo
( V \ a s = arccos —
W f J
e(V - Vp)/KBTe
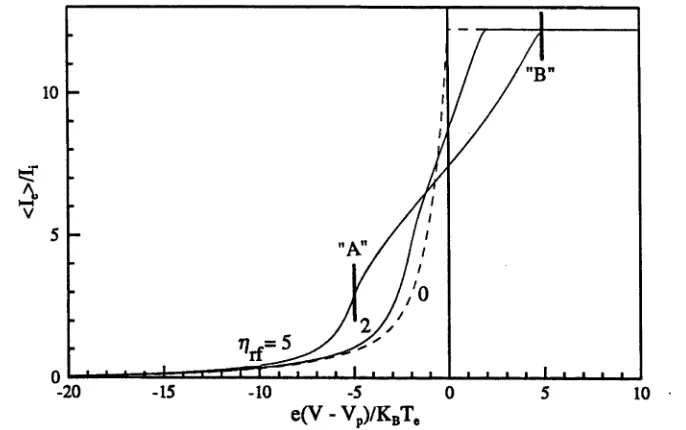
Figure 2.4: The calculated I e curves for 7^=0 (dashed line), 2 and 5 (two solid lines) and the bi-M axw ellian distribution w ith a=10% and q=5.
curve and that the curves reach the saturation only at point “B ” w ith rj=rfrf. Because of its appearance, it is very easy to m isinterpret the knee at point “A ” as Vv or as a directed electron beam [50]. Fig. 2.4 shows that w hen 7>/ < 2, knee “A ” is much
less predom inant than w hen % = 5 . Therefore, we can conclude that the rf effect is
negligible w hen t^j < 2 (Vr/ < 2kBTe/e) can be satisfied.
In practice, there are m any w ays to avoid the rf effect on the probe I-V charac
teristics. A m ong these, the com pensation m ethod developed by B enjam in et al. [22]
has been tried in W OM BAT. This m ethod is based on the principle o f cancelling out
the rf signal on the probe by applying a reference signal w ith the sam e am plitude as,
and 7r difference in phase to, Vrf ( t ) in the plasm a. It was found that Vrj m easured in this way is generally less than 2kBTe/ e over the w hole plasm a volum e in the main cham ber but greater in the source region. Therefore, w e can finally state that
in WOMBAT, except w here it is very close to the rf antenna, the distortion of the
probe I-V characteristics due to rf m odulation can be neglected for the bias voltage
[image:31.556.114.457.72.287.2]Ceram ic Tubing
15 m m
^ 7 7 7 7 7 7 7 7 7771
Stainless Steel W ire
C eram ic L ayer
Stainless Steel Disk
(a)
B
D ielectric Insulation ■25
mm-C opper W ire
Stainless Steel Tubing
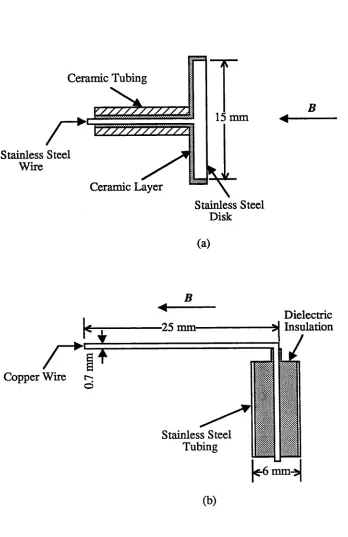
Figure 2.5: The probe constructions: (a) the plane probe and (b) cylin
[image:32.556.116.464.93.630.2]2.3 Probes and Data Acquisition System
All the probe results reported in this thesis were taken by the disk probe. Fig. 2.5a
shows the construction of the disk probe tip, which consists o f a stainless-steel disk
15 mm in diameter and a supporting ceramic tubing with a conducting wire enclosed
inside. To provide a well-defined collecting area, one side of the disk is covered with
a thin coating o f ceramic. A special adaptor is used to connect this tip to standard
probe supporting tubes made of 6 mm stainless-steel tubing. The planar probe with
its surface perpendicular to the magnetic field is usually mounted on the radially
movable arm through the north port at 2= 100 cm (see Fig. 2.1). Alternatively, this
plane probe can be mounted on the axially movable trolley to measure the axial
variation o f the plasma parameters from z- 86 cm (in the main chamber) to z=180
cm (inside the source).
Two cylindrical probes are used as transmitting and receiving antennas for Bern
stein wave experiments. The probe tips are formed by 0.7 mm bare copper wire,
L-shaped and 25 mm long as shown in Fig. 2.5b. They are connected to a conducting
wires enclosed in a coaxial cable, supported again with standard 6-mm tubing. The
two probes are usually arranged with tips parallel to B and mounted respectively on
the north and south radial supporting arms.
The probe data acquisition system is shown in Fig. 2.6. To provide the bias
voltage for probes, a Wavetek function generator and a sweeping amplifier are used
to produce a triangular-shaped sweep voltages up to ± 100 V. The probe current is
detected by measuring the voltage across the sensing resistor. A digital oscilloscope
with two channels is used to store the signal o f the bias voltage, V&, and the sensor
voltage, Vs, simultaneously. A voltage divider of 1:10 is used for the bias voltage
signal and an isolation amplifier is used for the sensor voltage before they are fed
into the oscilloscope. Using RS-232 communication and a house-written software
package on an IBM XT personal computer, the data on both channels are transferred
to the computer and stored on a floppy disk. Here, the main source of potential error
NICOLET Oscilloscope Isolation
Amplifier From
Probe
Sensing
Resistor Channel A
IBM XT PC
RS-232 Channel B
External Trigger Function
Generator VoltageDivider
■MO
Figure 2.6: The probe data acquisition system
-40 -20 0 20
Bias Voltage V (V)
Figure 2.7: The experimental probe curve taken from hydrogen under the standard conditions
2.4
Probe Data Analysis
A typical experimental I-V characteristic of the planar probe in the hydrogen plasma
is shown in Fig. 2.7. The dashed line in the figure is a straight-line fit extrapolation
for the ion current. Several points should be noted before analysing such a curve:
(a) the curve has a knee at point “A” just above the floating potential and this point
distinguishes two-slope regions, (b) 7e/ / t, given by the value o f I e at the plasma
potential o f around 5 V and that o f 7, at -40 V, is around 6 which is about 7 times
smaller than the theoretical value estimated by ~ 43 and (c) the curve slope
falls off from exponential growth before the apparent saturation point “B”. Among
these, it is believed that (a) possibly reflects a non-Maxwellian distribution with a
“hot tail”, (b) and (c) are likely due to the magnetic field or rf effect as discussed in
Sec. 2.2.2 and 2.2.3. To analyse such probe curves, a computer program has been
written using a bi-Maxwellian model. For the given probe current-voltage curves,
type o f gas, geometry of the probe, the program will calculate the electron energy
distribution function, plasma potential and plasma density.
2.4.1 Measurements of Electron Energy Distribution and Plasma
Potential
To obtain net electron current, straight-line extrapolation is employed to subtract the
ion current (see Fig. 2.7). After the net electron current is obtained, the probe data
is analysed by the following procedures:
(1) Normalize 7e by 7^;
(2) Find the floating potential Vj and then add an adjustable A V to give
the initial Vup, the upper limit o f V above which the data is treated as
unreliable;
(3) Give the initial values o f (Te, Teu, a, Vp) and calculate the theoretical
curve of 7e/7, vs. V from Eqn. 2.14 and 2.21;
(4) Use a minimizing technique to fit the experimental curves with theo
(5) Give a tolerance in fitting error, each time automatically add step A V
to Vup and repeat procedure (4) to obtain more sets o f (Te, Teu, a, Vp)
until the tolerance is exceeded;
(6) Plot all the curves for each set of fitting parameters and choose the set
o f (Te, Teu, a, Vp) from the best fit as the the final result.
There is another program developed only for Maxwellian plasmas which has been
used occasionally to check the results given by the bi-Maxwellian program. Using
the single Maxwellian program, Te and Teu can also be obtained by a two-slope fitting
technique. In this way, the obtained value of Te is often higher than that obtained
using the bi-Maxwellian analysis, but for Teu the opposite applies. This difference
should be expected since the two-slope fitting ignores the role o f a and simply treats
a smoothly slope-changing curve as a curve joined suddenly from two exponential
slopes. The single Maxwellian program gives Vp by calculating the maximum of the
first derivative of the experimental I-V curves [52]. The plasma potential obtained
by this method is expected to be lower than the true value at least by kBTe/e because
o f the magnetic field effect (see Sec. 2.2.2). The difference in Vp analysed by the
two programs is normally within kBTef j/e . By considering all the error sources, the
uncertainties in the measurements of Vp,Te, Teu and a are
A Up < 2 ^kBTejf
e
A Te < 0.3 eV
a
re„
< 1.5 eVA a
a < 15%.
In Fig. 2.8 two measured curves of the probe electron current (circle o), (a) for
hydrogen at a pressure o f 1.0 mTorr and (b) for argon at p ~ 0.5 mTorr, are plotted
in semi-log scale with theoretical fitting by the bi-Maxwellian model (solid line) and
the Maxwellian models (dashed lines) respectively. All other experimental conditions
are at the standard values as defined in Sec. 2.1. In Fig. 2.8a, the bi-Maxwellian
fitting gives the parameters o f a=6.5%, Te=1.9 ± 0.2 eV, Teu= 9.0 ± 0.7 eV and
(a) Hydrogen
O Measured
;9.0eV
V (V )
(b)
O Measured
---: a =4.0%,
T e=4.0eV, T =11.3eV
6.0eV'
Figure 2.8: The probe characteristics fitted respectively with bi-Maxwellian (solid lines) and bi-Maxwellian (dashed lines) distributions: (a) for hydrogen at p= 1 mTorr and (b) for argon at p=0.5 mTorr.
Fig. 2.8 clearly shows that the measured probe current cannot be modelled by a single Maxwellian distribution, particularly in the region with high negative bias voltages, which corresponds to the “hot electron tail”. Furthermore, if a Maxwellian distribution is assumed, the temperature derived from such a probe curve is always higher than the true bulk temperature due to “hot tail” effects unless the electron current very close the saturation region is used to derive Te. However, as has been previously discussed, the electron current in that region is strongly affected by the electron depletion and the rf modulation of the plasma potential so that it cannot give reliable results. This has been a common problem for temperature determination using a normal Maxwellian approach.
2.4.2 Density Measurement
As has been discussed in Sec. 2.2, in practice the plasma density is derived from the experimental ion saturation current. In principle, the density for each species is still derivable from the probe characteristics if the fraction of each species is known. However, applications to such complicated systems will not be considered in this thesis.
Using classical Langmuir probe theory for a planar probe, is calculated from the ion saturation current Iio when TB (see Eqn 2.19) has been determined from experiments. Using Eqn. 2.21, nt- is given by
This is based on the assumption of single positive ion species. As will be demon strated in Chapter 3, such an assumption is valid for the hydrogen plasma under standard conditions where the pressure is low. For p < 5 mTorr, HJ is the domi nant positive ion species, but for p > 5 mTorr, the populations of H+ and HJ ions will become comparable to that of HJ. From the above equation, we can see that n i 00 y/ini, so using HJ as the only ion species should cover most of combinations of the three ion species since its mass is the same as the average value of the three masses. The uncertainty in the density measurement under this assumption will be
less than 12% if the population o f any of H+ and Hj is not over 50% of the total
ion population.
It should be noted that the variation of 7l0 with (V — Vp) causes uncertainty in the
absolute measurement o f n*. To reduce the relative error in density measurements
for different experimental conditions, the value of 7l0 is always taken at (Vp — V")=60
V. Bernstein wave interferometry is another way to measure the plasma density. The
density measured by probes under standard conditions is calibrated by the Bernstein
measurement. The values o f the density for other conditions are then obtained from
the relative measurements. In general, the relative density measurement by the probe
can be as accurate as 5%, while the total error in the absolute measurement is around
30%.
2.5 Bernstein Wave Dispersion
The electron Bernstein waves are those electrostatic electron cyclotron waves which
propagate perpendicular to the magnetic field B . In plasmas where an anisotropy in
the electron distribution is introduced by the presence of B, the electron temperature
will have two components, one parallel (Te) and the other one perpendicular (Tel)
to B . The perpendicularly propagating Bernstein waves are good candidates for
the measurements of Te± and plasma density since their dispersion relations strongly
depend on Tel and n e [29, 64].
2.5.1 Dispersion in an Isotropic Maxwellian Plasma
For a hot plasma with an isotropic Maxwellian distribution, the dispersion function
for Bernstein waves is [8]
e(w, k±) =
lJ =
ür 1 -)---- —
6?
kl kBTe
“ ce m e UJ
1
-sin(cj7r)
J dx
exp [-6j(cos X + 1)] cos(u>x)u pe =
(2.31)
(2.32)
where k is th e wavenumber, e is th e dielectric constant of th e plasm a and x
is th e integral variable.
By setting e=0 in Eqn. 2.31 and numerically solving the equation, we can obtain the dispersion relations for the Bernstein waves. The multiple solutions for five branches of u;/cjce and several values of A=ujpe are plotted in Fig. 2.9. This figure clearly shows that the dispersion curves are very sensitive to bL for bL < 1.5 as well
bx
Figure 2.9: The Bernstein dispersion curves for <x=0 to 6 and A=uj2pe=\ to °°.
2.5.2 Dispersion in a non-Maxwellian Plasma
We first consider the case of an anisotropic Maxwellian plasma. For the anisotropic
Maxwellian given in Eqn. 2.10, it is well known that the dispersion relations of the
Bernstein waves are not affected by the parallel electron temperature Te,t provided
they propagate purely perpendicular to B (fc,,=0) [43]. It is very easy to demon
strate this mathematically by applying Eqn. 2.10 to the integral form o f the general
dispersion function for electrostatic waves [96]:
•2 + ~
r„M =2x /
J — OOv, dv. UUJce I l 7 2
v± dvx 113u||)
Ar||U|| — nu;c k,v.
(2.34)
(2.35)
where J n is the nth order Bessel function o f first kind. The final form o f the disper
sion for anisotropic Maxwellian distributions is identical to Eqn. 2.31 for isotropic
Maxwellian distributions except Te should be replaced by Tex. This is why the
Bernstein wave dispersion can be used to determine Te± in an anisotropic plasmas.
As has already been shown that the parallel distribution does not affect the Bern
stein dispersion relations, we can now consider the case with a non-Maxwellian distri
bution in the perpendicular direction, a general form of the distribution in the parallel
direction. Porteous [81] examined this case and showed that the Bernstein dispersion
is only sensitive to the averaged electron energy in the perpendicular direction even
for significantly non-Maxwellian distributions including “hot tail” distributions. As
a bi-Maxwellian distribution given by Eqn 2.4 with a « 1 is a specific type o f “hot
tail” distribution, his result should also be applicable to such a distribution.
Overall, we can conclude that from the Bernstein dispersion the average electron
energy in the perpendicular direction, represented by a effective temperature Tef f }±, can
be measured regardless o f whether the electron energy distribution is anisotropic or
non-Maxwellian. For the bi-Maxwellian case, this temperature can be approximated
by the perpendicular component o f the bulk electron temperature Te±, provided the
2.6 Bernstein Wave Interferometry
2.6.1 The Interferometer
The experimental arrangement for Bernstein interferometry is shown in Fig. 2.10. The Bernstein waves are launched by applying rf power to the previously described
Transmitter Centre
Plasma
Probe Driver 0-500MHz
Oscillator
50 dB Linear Amplifier
Probe Position Control Spectrum Analyser Chart Recorder
Figure 2.10: The experimental arrangement for the Bernstein interferom etry measurement.
L-shaped antenna. The rf signal, generated by a Wavetek and amplified by a broad band (0 - 500 MHz) amplifier, is directly fed the antenna via 50 coaxial cables. The input power is of the order of 0 dBm or 1 mW. The wave signal is picked up by another antenna which is identical to the transmitting antenna, as shown in Fig. 2.10.
with a very long wavelength, i.e. k L ~ 0 [47].
The received signal consisting of the sum of the two waves is fed a spectrum analyser, which acts as a narrow band filter. The interferograms are plotted by a X- Y recorder with the output from the spectrum analyser on the Y-axis and the radial position r on the X-axis.
2.6.2 Derivation of Temperature and Density
A set of interferograms from WOMBAT are shown Fig. 2.11 where (a) and (b) are for argon and hydrogen plasmas respectively. It clearly shows that the wavelength in the hydrogen plasma changes gradually with r even within r < 7 cm and this reflects the radial variation of the plasma parameters. However, in argon (Fig. 2.11a) the wavelength does not change much for r~ 1 0 cm and this reflects the radial
f=195MHz
Radius r (cm) Radius r (cm)
uniformity of the argon plasma. Such results are consistent with that given by probe measurements.
As uceis known, the dispersion relation can be obtained from the interferograms by measuring the wavelength A for each üf. The dispersion relation o f ts vs. ±
can be then plotted. The electron temperature and density are determined by fitting the theoretical dispersion curves to the experimental ones with the two fitting parameters
Teland A=UJl'- For ^ Siven k > ^ e Bernstein wave dispersion has multiple solutions for Ü7 located on the branches 1 < w < 2, 2 < w < 3, etc. (see Fig. 2.9). Its has been
found that good estimates of the perpendicular electron temperature and the plasma density can be obtained if the dispersion curves for 1 < S' < 2 and 2 < ^ < 3
are used together. In addition, the insensitivity of the curve to parameter A, and therefore to the density, in the first branch at can be compensated by that in the second branch. Therefore, most of the results taken by this method are derived from two branches of dispersion curves.
Fig. 2.12 shows an example o f such a fitting for the experimental results taken from (a) hydrogen with / « = 90 MHz and (b) argon with /« = 1 0 0 MHz. For hydrogen,
Fel~ 1 .0 eV and ne~ 7 xlO8 c m '8 (A~7; for argon, 7 ^ 1 . 8 eV and ne~ 2 ) xlO9 c m '8
(Ace 16). The densities obtained from the probe and the Bernstein measurements agree to within 30%. However, the perpendicular temperature determined by the Bernstein measurement is usually a factor of two lower than the bulk temperature by the probe.
This discrepancy between the temperatures measured by the two methods has been previously observed by Brand et al. [23], They showed that the temperature measured by the Bernstein method was 10 times lower than that measured by a double probe. It is well known that a double probe is sensitive to “hot tails” in the distributions. The difference in the two measurements was explained by postulating the existence of a bi-Maxwellian distribution. However, in this work, the discrep ancy still occurs even though a bi-Maxwellian model is applied to analyse the I-V characteristics o f the probes. As will be discussed in Chapter 6, this discrepancy may be related to the mechanisms for plasma generation in the source region.
0 5 10 15 20 25
k (cm 1)
3 2.0
ktcm'1)
Chapter 3
Particle Dynamics
This chapter deals with the particle dynamics of the molecular hydrogen plasma in
WOMBAT.
In a low pressure hydrogen plasma, multiple types o f particle species including
neutral molecules and atoms, H2 and H, molecular and atomic ions, Hj and H+,
negative ions, H_, and electrons, e, can coexist. The study o f the particle dynamics,
in particular the interactions between the particles, is very important in order to
understand the plasma properties.
In the first two sections, the main collisional processes between the particle
species, and the particle losses due to diffusion are discussed. In Sec. 3.3, the set of
rate equations, describing the balance between the creation and losses o f the particles,
are adapted from D onnelly’s [35] theoretical model, originally for a uniform nitrogen
plasma with a Maxwellian electron distribution. In this study we have extended this
model to the non-uniform, bi-Maxwellian hydrogen plasma in WOMBAT. Following
in Sec. 3.4, the solutions o f the equation set are presented in terms o f the densities
o f the six particle species for single- and bi-Maxwellian electron energy distribution