Scholarship@Western
Scholarship@Western
Electronic Thesis and Dissertation Repository
12-20-2016 12:00 AM
Physiological and Behavioral Evidence of Auditory Processing
Physiological and Behavioral Evidence of Auditory Processing
Deficit in Children Suspected of Auditory Processing Disorder
Deficit in Children Suspected of Auditory Processing Disorder
Sangamanatha Ankmnal Veeranna The University of Western Ontario
Supervisor Prudence Allen
The University of Western Ontario
Graduate Program in Health and Rehabilitation Sciences
A thesis submitted in partial fulfillment of the requirements for the degree in Doctor of Philosophy
© Sangamanatha Ankmnal Veeranna 2016
Follow this and additional works at: https://ir.lib.uwo.ca/etd
Part of the Speech and Hearing Science Commons, and the Speech Pathology and Audiology Commons
Recommended Citation Recommended Citation
Ankmnal Veeranna, Sangamanatha, "Physiological and Behavioral Evidence of Auditory Processing Deficit in Children Suspected of Auditory Processing Disorder" (2016). Electronic Thesis and Dissertation
Repository. 4310.
https://ir.lib.uwo.ca/etd/4310
This Dissertation/Thesis is brought to you for free and open access by Scholarship@Western. It has been accepted for inclusion in Electronic Thesis and Dissertation Repository by an authorized administrator of
i
A series of studies were carried out to examine the neural and behavioral processing of
acoustic stimuli in children with suspected auditory processing disorder (sAPD).
The click-evoked auditory brainstem responses recorded from children with sAPD and adults
were analyzed using traditional clinical measures and detailed analysis seeking to explore the
separate contributions of axonal conduction and synaptic transmission. Clinical measures
revealed significant prolongation of absolute latencies and interwave intervals in children
with sAPD compared to adults. Examination of responses delineating axonal vs. synaptic
transmission showed frequent delays in synaptic factors and fewer instances of delays related
to axonal conduction in children with sAPD compared to adults.
Inefficient neural transmission in the auditory brainstem may lead to difficulty in coding of
dynamic acoustic cues (envelope, fine structure or spectral shape) that are necessary for
recognizing speech in quiet and in noise. The ability to use envelope and fine structure cues
to recognize speech in noise was therefore examined in children with sAPD, typically
developing children and adults. Typically developing children showed developmental trend
in use of envelope cues. Whereas children with sAPD were less efficient in using envelope
and fine structure cues to recognize speech in noise compared to age-matched children and
adults. Perception of speech based on fine structure alone was difficult for both TD children
and children with sAPD compared to adults. This could be due to developmental difficulty in
integrating frequency information from different bands.
Difficulty in integrating auditory filter outputs may lead to the inadequate representation of
spectral shape, which is necessary for recognizing speech sounds. Spectral shape perception
was assessed using a spectral ripple discrimination task in typically developing children,
children with sAPD, and adults. Young children could resolve fewer of ripples per octave
when compared older children and adults. The performance of children with sAPD was poor
compared to age-matched controls and young adults. Spectral-ripple discrimination showed a
ii take a longer time to mature.
Keywords: Click-evoked auditory brainstem response, Auditory Processing Disorder,
iii
List of Abbreviations
A
AAA American Academy of Audiology
ANOVA Analysis of variance
ABR Auditory Brainstem Response
AEP. Auditory Evoked Potential
AN Auditory Nerve
ASHA American
Speech-Language-Hearing Association
APD Auditory Processing Disorder
B
BSA British Society of Audiology
C
CA Conception Age
CNC Cochlear Nucleus Complex
D
dB Decibel
E
E Envelope
F
FS Fine Structure
G
GUI Graphical User Interface
H
HINT-C Hearing in Noise for Children
I
IC Inferior Colliculus
IHC Inner hair Cells
M
MLS Maximum Length Sequence
iv OTD Older Typically Developing
R
RAU Rationalized Arcsine Units
R
RMANOVA Repeated Measure of Analysis of variance
RPO Ripple per Octave
S
SD Standard Deviation
SOC Superior Olivary complex
SMD Spectral Modulation Detection
SNR Signal to Noise Ratio
SRD Spectral Ripple Discrimination
SSN Speech Shaped noise
T
TD Typically Developing
Y
v
Co-Authorship Statement
This thesis is comprised of an introductory chapter (Chapter 1), four integrated manuscripts
(Chapter 2 to 5) and concluding chapter (Chapter 6). I am the main author for all the chapters
as I was responsible for designing the methods of the experiments, collecting the data,
statistical analysis of the results and writing the manuscripts. I, Sangamanatha Ankmnal
Veeranna, am the sole author for chapter 1 and Chapter 6. Dr. Chris Allan and Dr. Prudence
Allen are co-authors in chapters 2-5 as they participated in study design and analyses.
Additionally, Dr. Chris Allan was responsible for recruiting and assessing children’s auditory
processing skills. Chapter 2 has been submitted for peer review (Sangamanatha Ankmnal
vi
Acknowledgments
I would like to thank all the participants and their family, who participated in this study.
Without them this thesis would not have been possible.
I would like to thank first my dear parents (Appaji and Mummy), my brothers and sister who
have been always there to support, guide and love me. Words are not enough to express my
love and affection towards them.
My deepest respect and gratitude are due to my guide and mentor, Dr. Prudence Allen for her
constant guidance and support. She has been a great source of inspiration at every stage of
this work, sharing her expertise thoughts and experience. “Dr. Prudence, you have been
really supportive and helpful throughout my dissertation and the word ‘thank you’ is not just
sufficient to express my gratitude towards you”.
Special thanks to Dr. Chris Allan. Without your help, this thesis would have been difficult for
me. You have been an exemplary teacher in every sense of the word, thoughtful guidance,
and constructive criticism.
I would like to thank my advisory committee members Dr. David Purcell, Dr. Ewan
MacPherson and Dr. Blake Butler for their thoughtful inputs to my research.
I would like to thank David Grainger, Steve Beaulac, and Lucy Keiffer or all the technical
and administrative support.
I am also thankful Mathew Lucas, Leichelle Little and Viji for their help and advice.
Special thanks to Nambi sir, for his guidance and support.
I would like to thank Ajay and Impa for their love and support. I could survive in Canada
vii
Table of Contents
Abstract ... i
Co-Authorship Statement... v
Acknowledgments... vi
Table of Contents ... vii
List of Tables ... xi
List of Figures ... xii
Chapter 1 ... 1
1 Overview ... 1
1.1 Auditory processing disorder ... 4
1.1.1 Definition ... 4
1.1.2 Criteria for making a diagnosis ... 4
1.1.3 Objective assessment of APD ... 5
1.1.4 Comorbidity ... 6
1.2 Reference ... 7
Chapter 2 ... 14
2 Auditory brainstem responses in children with auditory processing disorder ... 14
2.1 Introduction ... 14
2.2 Methods... 18
2.2.1 Participants ... 18
2.2.2 Auditory Brainstem Responses ... 18
2.2.3 ABR analysis ... 19
2.3 Results ... 20
2.3.1 Clinical measures ... 20
viii
2.5 Summary and Conclusion ... 34
2.6 Reference ... 35
Chapter 3 ... 41
3 Sensitivity to Envelope and Fine Structure Cues In Speech: Data from Adults, Typically Developing Children and Children with Suspected Auditory Processing Difficulties... 41
3.1 Introduction ... 41
3.2 Method ... 45
3.2.1 Participants ... 45
3.2.2 Signal processing ... 45
3.2.3 Procedure ... 46
3.3 Results ... 50
3.3.1 Reference condition ... 50
3.3.2 Varied envelope and fine structure condition ... 52
3.4 Discussion ... 56
3.5 Summary and Conclusion ... 60
3.6 Reference ... 61
Chapter 4 ... 67
4 Perception of Speech with Fine Structure Cues: Data from Adults, Typically Developing Children and Children with Suspected Auditory Processing Difficulties 67 4.1 Introduction ... 67
4.2 Method ... 70
4.2.1 Participants ... 70
4.2.2 Signal processing ... 70
4.2.3 Procedure ... 73
ix
4.5 Summary and Conclusion ... 82
4.6 Reference ... 83
Chapter 5 ... 87
5 Perception of Spectral Shape: Data from Adults, Typically Developing Children and Children with Suspected Auditory Processing Difficulties ... 87
5.1 Introduction ... 87
5.2 Method ... 91
5.2.1 Participants ... 91
5.2.2 Signal processing ... 91
5.2.3 Procedure ... 92
5.3 Results ... 94
5.3.1 Maturation of spectral ripple discrimination... 94
5.3.2 Spectral ripple discrimination by children suspected with APD ... 95
5.4 Discussion ... 96
5.4.1 Maturation of spectral ripple discrimination... 96
5.4.2 Spectral-ripple discrimination by children with sAPD ... 97
5.5 Summary and Conclusion ... 98
5.6 References ... 99
Chapter 6 ... 102
6 Summary, Future direction and Clinical implications ... 102
6.1 Summary ... 102
6.2 Future directions ... 107
6.3 Clinical implications ... 108
6.4 Reference ... 110
x
Appendix B: Letter of Information and Consent ... 120
Appendix C: Click-ABR waveforms of adults, children diagnosed as APD and non-APD. ... 135
135
Appendix D: Click-ABR mean (and SDs) absolute and interwave latencies. ... 136
Appendix E: Mean (and SDs) spectral ripple discrimination thresholds for different age groups. ... 137
Appendix F: Additional analysis for chapter 3. ... 138
xi
List of Tables
Table 3.1: Number of key words in different experimental conditions. ... 48
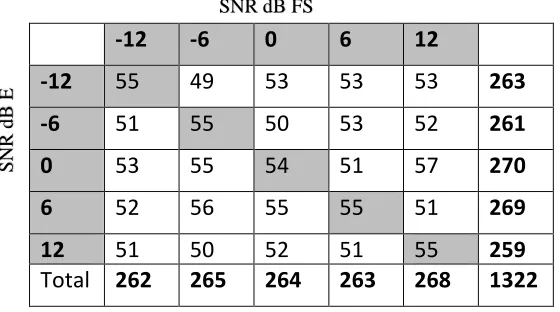
Table 3.2: Bonferroni post hoc analysis for different SNR E and SNR FS conditions
xii
List of Figures
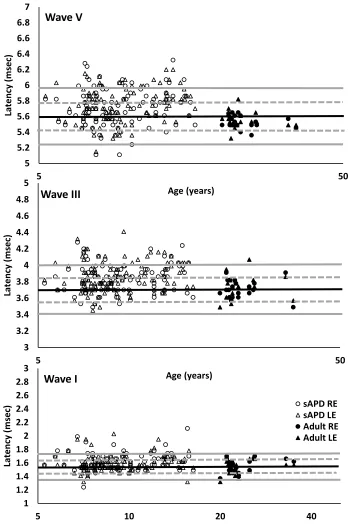
Figure 2.1: ABR wave I, III and V latencies plotted as a function of age. Data for sAPD
children are shown as unfilled circles and unfilled triangles for right and left ears,
respectively. Adult responses are shown as filled circles and filled triangles for right and left
ears, respectively. Filled horizontal black line, unfilled and filled grey lines represents mean,
±1 and ±2 SD, respectively. ... 21
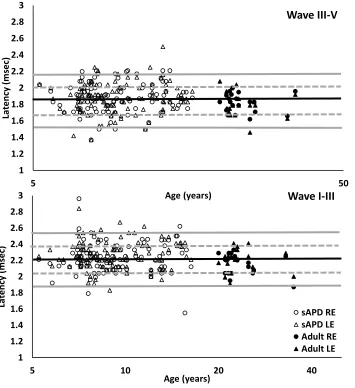
Figure 2.2: ABR interwave intervals I-III and III-V plotted as a function of age. Data for
sAPD children are shown as unfilled circles and unfilled triangles for right and left ears,
respectively. Adult response are shown as filled circles and filled triangles for right and left
ears, respectively. Filled horizontal black line, unfilled and filled grey lines represent mean,
±1 and ±2 SD, respectively. ... 23
Figure 2.3: Individual wave V latency shift in the faster stimulation rate (57.7 clicks/sec)
plotted as a function of slower stimulation rate (13.3 clicks/sec). Data for the right and left
ears are shown by unfilled circles and triangles for children sAPD, respectively. Adult data
for the right and left ear are shown by filled circles and triangles, respectively. ... 24
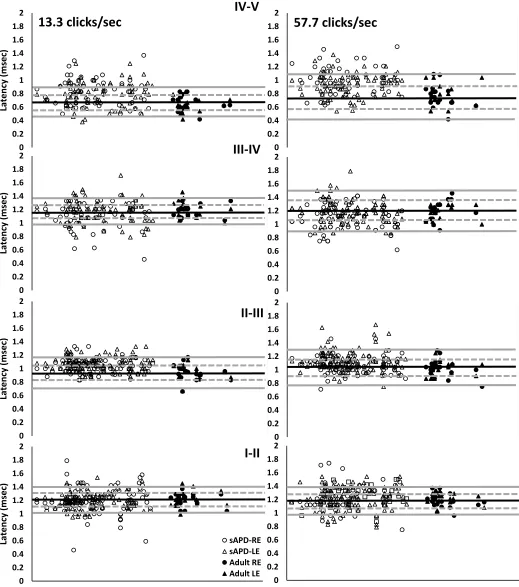
Figure 2.4: ABR interwave latencies I-II, II-III, III-IV and IV-V plotted as a function of age
for slow and fast rates in left and right panel, respectively. Data for sAPD children are shown
as unfilled circles and unfilled triangles for right and left ears, respectively. Adult responses
are shown as filled circles and filled triangles for right and left ears, respectively. Filled
horizontal black line, unfilled and filled grey lines represent mean, ±1 and ±2 SD,
respectively. ... 27
Figure 2.5: Venn diagrams illustrating number of children with clinically abnormal interwave
latencies at slower (top panel) and faster stimulation rates (bottom panel) in unilateral and
bilateral. I-II and III-IV interwave interval represents the axonal conduction times and II-III
and IV-V represents the synaptic transmission times. ... 29
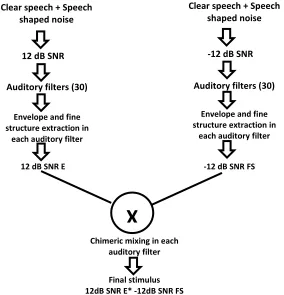
Figure 3.1: Simplified flow chart showing steps involved in creating stimuli. Abbreviations:
xiii
spectrogram (0-5000Hz) for that condition. The original unprocessed sentence “Show me
bear” is shown in the left column. Processed stimulus examples are shown in the center and
right columns. Center column shows processed stimuli with dominant envelope (E) cues and
reduced fine structure (FS). Right column shows processed stimuli with predominant fine
structure cues and reduced envelope cues. ... 48
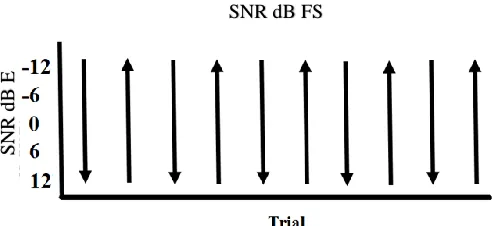
Figure 3.3: Schematic of stimulus presentation. ... 49
Figure 3.4: Individual speech recognition scores at different SNR. Open symbols indicate
scores for TD children and adults. Filled symbols indicate scores for children with sAPD.
Best-fit lines are shown separately for the two groups of children... 51
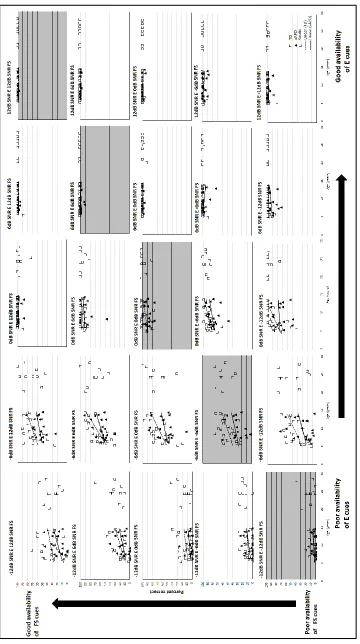
Figure 3.5: Individual speech recognition scores at different SNR dB E and SNR dB FS
conditions. Open symbols indicate scores for TD children and adults. Filled symbols indicate
scores for children with sAPD. Best-fit lines are shown separately for two groups of children.
Abbreviations: SNR, signal to noise ratio; E, envelope; FS, fine structure. ... 55
Figure 4.1: Simplified flow chart showing the steps involved in creating speech signals that
include only fine structure acoustic cues. Abbreviations: E, Envelope; FS, fine structure. ... 71
Figure 4.2: Stimulus processing examples. The original unprocessed sentence “Show me bear” is shown in the left column; waveform (A) and spectrogram (B). Spectrograms of the
processed sentence to retain fine structure in the 4 bands (C), 8 bands (D), 16 bands (E), and
30 bands (F) conditions are shown in the right column. ... 72
Figure 4.3: Schematic representation of stimulus presentation ... 73
Figure 4.4: Individual speech recognition scores, in percent correct, obtained for TFS speech
extracted from different filter band conditions. Open symbols indicate scores for TD children
and young adults. Filled symbols indicate scores for children sAPD... 76
Figure 4.5: Mean speech recognition scores obtained for children suspected of auditory
xiv
of the mean. ... 81
Figure 5.1: Spectra of spectral ripple stimuli for reference (top and bottom) and target
conditions (middle). ... 93
Figure 5.2: Spectral ripple discrimination thresholds as a function of age for all listeners.
Typically developing children and adults are represented by the filled squares. Unfilled
squares represent the children with sAPD. The dark line characterizes the relationship
between age and spectral ripple discrimination threshold. Best-fit lines are shown separately
Chapter 1
1
Overview
School children may be referred to audiology for central auditory processing assessment
because their parents or school teachers expressed concerns over their hearing and
difficulty understanding speech in noise. These children are suspected of having an
auditory processing disorder (sAPD). The American Speech-Language-Hearing
Association [ASHA] defines APD as a perceptual deficit in the processing of acoustic
information. Children with APD should demonstrate abnormal neural processing of
auditory stimuli that is not attributable to deficit in cognition or language (ASHA, 2005).
For an APD evaluation, ASHA recommends including electrophysiological measures to
assess the integrity of the auditory nervous system. Even at the Bruton Conference held at
the Callier Centre in Dallas, Jerger and Musick, (2000) suggested to include ABR and
middle latency responses (MLR) in an APD assessment battery. However, less than 15 %
of audiologists include electrophysiology [ABR, MLR and Late Latency Response
(LLR)] in their routine battery (Emanuel, Ficca, & Korczak, 2011). One reason for this
disconnect may be the position of the American Academy of Audiology (American
Academy of Audiology [AAA], 2010) who described the value of click-evoked auditory
brainstem response (ABR) as limited, agreeing with prominent authors (Katz et al., 2002)
who have criticized the inclusion of ABR in a routine diagnostic battery due to lack of
evidence to support its inclusion. This is unfortunate because there is evidence that
children with APD do show a measurable physiologic deficit at lower levels of the
auditory system, similar to that observed in individuals with auditory neuropathy. ABR
responses are often characterized by increased wave latencies and interwave intervals,
reduced wave amplitudes and abnormal latency shifts at faster stimulation rates (Allen &
Allan, 2014; Gopal & Kowalski, 1999; Jirsa, 2001). These findings suggest a disruption
in neural timing. Neural disruption may arise from axonal conduction or synaptic
transmission delays in the auditory brainstem pathway. Ponton, Moore, and Eggermont,
(1996) have demonstrated that maturation of these parameters can be seen in the
The peripheral auditory system of typically developing children’s is mature early enough
to provide an acoustic signal that can be well represented in the higher level auditory
system; however, young children require a higher signal to noise ratio (SNR) to perceive
speech signal in noise (Fallon, Trehub, & Schneider, 2000; Hall, Grose, Buss, & Dev,
2002; Nittrouer & Boothroyd, 1990). Recognizing speech in noise becomes especially
important when children enter school. In school, teaching and learning may not take
place in a quiet environment, as there are several sources of background noise (e.g.
children chatting, noise from the corridor).
There is general agreement that typically developing children’s ability to understand
speech in noise improves with age (Fallon et al., 2000; Wilson, Farmer, Gandhi,
Shelburne, & Weaver, 2010). The prolonged maturation of recognizing speech in noise
could be due to differences in maturation of the perception of dynamic acoustic cues (fine
structure and envelope cues). Envelope cues are slowly varying amplitudes over time and
fine structure cues are rapid variations in amplitude over time. Both envelope and fine
structure are known to provide important cues for speech recognition (Rosen, 1992).
Listeners use both envelope and fine structure cues to recognize speech. Developmental
studies indicate that typically developing children may weight fine structure cues more
heavily than envelope cues (Allen & Bond, 1997). Perception of speech based on fine
structure cues is matured by 5-7 years of age (Bertoncini, Serniclaes, & Lorenzi, 2009).
Typically developing children can extract speech from envelope cues by 5-7 years of age
but reaches adult level by 10 years old (Eisenberg, Shannon, Martinez, Wygonski, &
Boothroyd, 2000). In quiet, typically developing children can use both envelope and fine
structure cues to recognize speech. However, it is not clear how these cues are used to
recognize speech in noise by typically developing children.
One of the most frequent listening complaints of children with sAPD is that they have
difficulty understanding speech in the presence of background noise (Bamiou, Musiek, &
Luxon, 2001; Chermak, Hall, & Musiek, 1999; Lagacé, Jutras, Giguère, & Gagné, 2011;
Vanniasegaram, Cohen, & Rosen, 2004). Unfortunately, only a handful of studies have
tested speech in noise directly. Such studies suggest that children with listening disorders
scores to age-matched controls (Lagacé et al., 2011; Vanniasegaram et al., 2004a).
However, the underlying cause for the poor recognition in noise by APD children has not
been specifically identified. One possibility is that children with listening disorders may
be less proficient at extracting important envelope and fine structure cues. However, this
has not been examined directly.
Previous studies, both developmental and in APD, have examined speech in noise ability
by mixing speech in noise at different SNRs. By mixing speech and noise at various
SNRs, it may not be clear to what extent envelope and fine structure cues are masked and
what cues are used to recognize speech. Apoux, Yoho, Youngdahl, and Healy (2013)
proposed to use auditory chimera (Smith, Delgutte, & Oxenham, 2002) signal processing
strategies to study the importance of envelope and fine structure cues in recognizing
speech in noise. They demonstrated that adults rely heavily on envelope cues rather than
fine structure cues to recognize speech in noise. However, it is not clear how envelope
and fine structure cues are used in noise by typically developing children and children
with APD.
Spectrally, a listener may use spectral shape, periodicity, spectral peaks or rapid spectral
changes to recognize speech from background noise (Assmann & Summerfield, 2004).
The ability to discriminate spectral shape in complex sounds is important for accurate
speech perception (Allen & Wightman, 1992; Henry, Turner, & Behrens, 2005). Spectral
shape refers to the overall shape of the spectrum of an acoustic signal. Perception of
spectral shape relies on identifying frequency-amplitude information from each auditory
filter and integrate them (across-channel integration). Any difficulty in across-channel
integration may lead to the inadequate representation of spectral shape. Psychoacoustic
studies have been used to understand the perception of these cues in adults. However,
only a handful of studies have been carried on typically developing children (Allen &
Wightman, 1992; Peter et al., 2014; Rayes, Sheft, & Shafiro, 2014). The perception of
spectral shape in children with sAPD has not been explored.
The main focus of this dissertation was to understand why children with sAPD find it
speech perception and psychoacoustic tasks that tap different aspects of auditory
processing was used. Study 1 analyzed the click-evoked ABRs in children with sAPD
and adults using traditional clinical measures and responses that delineate axonal
conduction and synaptic transmission times. This study provides novel evidence for the
underlying source of neural disruption in children with sAPD. Study 2 focused on
understanding the ability of typically developing children, children with sAPD and
adult’s to use envelope and fine structure cues to recognize speech in noise. Study 3
focused on the perception of speech with only fine structure cues in typically developing
children, children with sAPD and adults. Study 4 assessed the perception of spectral
shape using psychoacoustic measures in typically developing children, children with
sAPD and adults. The main focus of this study is to understand whether children with
sAPD abilities to integrate frequency-amplitude information is similar to that of
age-matched adults.
1.1
Auditory processing disorder
1.1.1
Definition
ASHA (2005) defines APD as a deficit processing auditory information in the auditory
nervous system in the presence of normal audibility. Children with APD may
demonstrate a deficiency in auditory discrimination, localization, temporal processing, or
detecting sound in noise (ASHA, 2005). ASHA also highlights that the diagnosis of APD
requires demonstration of a neural deficit in the processing of acoustic stimuli that is not
due to the influence of cognition or language.
1.1.2
Criteria for making a diagnosis
The diagnosis of APD can be made based on the identification of difficulties in auditory
discrimination, localization of sounds, temporal processing (resolution or patterning),
dichotic listening and recognition of degraded acoustic signals. Professional bodies (e.g
ASHA, 2005) have recommended certain diagnostic guidelines to be used with APD
assessment. These diagnostic guidelines typically involve a battery of behavioral and
auditory processing. The test batteries can include tests of auditory discrimination,
temporal processing, binaural processing, monaural low-redundancy test, and
electrophysiological measurements. The diagnosis of APD can be made if a child’s
performance is poor on two or more tests in the battery falling at least two standard
deviations below the mean (Chermak & Musiek, 1997). If only one test is administered
then, a diagnosis of APD should only be made if the result falls three standard deviations
below the mean (ASHA, 2005). However, ASHA did not specify whether the auditory
deficit should be present in one ear or both ears. The AAA (2010) requires that the deficit
be present in at least one ear.
There is no standard clinical protocol for APD diagnosis. More recently, Wilson and
Arnott (2013) reviewed the files of 150 children who had completed an APD assessment,
including low-pass filtered speech, competing sentences, dichotic digits and frequency
patterns tests. From performance on these tests, children were classified as having APD
or not having APD based on nine different sets of recommended diagnostic criteria. The
diagnosis of APD ranged from 7.3% to 96% depending on the criteria used for diagnosis.
The researchers suggested not using the APD as a global label. The presence of ongoing
debate on the diagnosis of APD make it difficult for the audiologist to diagnose and
provide adequate rehabilitation for these children.
1.1.3
Objective assessment of APD
For APD evaluation, ASHA recommends the inclusion of electrophysiological measures
to assess the integrity of the auditory nervous system. However, less than 15 % of
audiologists include electrophysiology in their assessments (Emanuel et al., 2011). This
could be due to the limited availability of advanced equipment in some clinics and
limited research on objective indicators of APD. Another reason for this disconnect may
be the position of the AAA (2010) who described the value of click-evoked auditory
brainstem response (ABR) as limited, agreeing with prominent authors (Katz et al., 2002)
who have criticized the inclusion of ABR in routine diagnostic battery due to lack of
The advantage of using objective measures is that no overt behavioral response is
required and responses can be acquired passively. Acoustic reflex measurements
(acoustic reflex thresholds, acoustic reflex growth function), otoacoustic emissions, and
electrophysiological measures (click or speech evoked ABR, MLR, P300) can be used to
assess neural integrity in children with APD. Jerger and Musiek (2000) recommended
using auditory evoked potentials and otoacoustic emissions (OAE) along with behavioral
measures of APD. Studies have reported abnormal acoustic reflex thresholds and growth
functions ( Allen & Allan, 2014; Saxena, Allan, & Allen, 2015, 2016), abnormal
click-evoked ABRs (Allen & Allan, 2014; Gopal & Kowalski, 1999; Jirsa, 2001), and
abnormal speech evoked ABRs (Kumar & Singh, 2015). Results from these studies
suggest the objective measures may aid in the diagnosis of APD.
1.1.4
Comorbidity
The classification of APD as a separate disorder is controversial as this disorder often
co-exists/co-occur with other conditions. Children with APD often show associated
difficulties in language learning, reading, writing, memory and attention (ASHA, 2005;
Allen and Allan, 2014). Children with language-learning related difficulties often
demonstrate auditory processing difficulties, behaviorally (Corriveau, Pasquini, &
Goswami, 2007; Fraser, Goswami, & Conti-Ramsden, 2010) and neurally (Banai, Nicol,
Zecker, & Kraus, 2005). These groups of children are known to have difficulties in
processing acoustic stimuli both at the level of the brainstem (Banai et al., 2005; Billiet &
Bellis, 2011) and at the level of auditory cortex (Sharma et al., 2006). Researchers have
also reported difficulty in processing speech (Russo, Nicol, Zecker, Hayes, & Kraus,
2005) and non-speech stimuli (Mody, Studdert-Kennedy, & Brady, 1997). Some authors
have questioned these findings (Bishop, Carlyon, Deeks, & Bishop, 1999) and argue that
not all children demonstrate auditory deficits, only some portion of these children carry
auditory deficits. Since the presence of heterogeneity of APD, it becomes difficult to
differentially diagnose the child as APD. Objective measures showing poor auditory
1.2
Reference
American Speech- Language- Hearing Association [ASHA] (2005). (Central) Auditory Processing Disorders. American Speech-Language-Hearing Association. Retrieved from http://www.asha.org/docs/html/tr2005-00043.html
Allen, P., & Allan, C. (2014). Auditory processing disorders: relationship to cognitive
processes and underlying auditory neural integrity. International Journal of Pediatric Otorhinolaryngology, 78(2), 198–208.
http://doi.org/10.1016/j.ijporl.2013.10.048
Allen, P., & Bond, C.-A. (1997). Multidimensional scaling of complex sounds by
school-aged children and adults. The Journal of the Acoustical Society of America,
102(4), 2255. http://doi.org/10.1121/1.419637
Allen, P., & Wightman, F. (1992). Spectral Pattern Discrimination by Children. Journal of Speech Language and Hearing Research, 35(1), 222.
http://doi.org/10.1044/jshr.3501.222
American Academy of Audiology [AAA]. (2010). Diagnosis, treatment and management of children and adults with central auditory processing disorder [Clinical
Practice Guidelines]. Retrieved from
http://www.audiology.org/resources/documentlibrary/Documents/CAPD
Guidelines 8-2010.pdf
Apoux, F., Youngdahl, C. L., Yoho, S. E., & Healy, E. W. (2013). Can envelope recovery
account for speech recognition based on temporal fine structure? The Journal of the Acoustical Society of America, 133(5), 3380. http://doi.org/10.1121/1.4805822
Assmann, P. F., & Summerfield, A. Q. (2004). The perception of speech under adverse
conditions. In R. R. Greenberg, S., Ainsworth, W. A., Popper, A. N., & Fay (Ed.),
Speech Processing in the Auditory System. Springer New York.
presentations of auditory processing disorders--a review. Archives of Disease in Childhood, 85(5), 361–5. http://doi.org/10.1136/ADC.85.5.361
Banai, K., Nicol, T., Zecker, S. G., & Kraus, N. (2005). Brainstem timing: implications
for cortical processing and literacy. The Journal of Neuroscience : The Official
Journal of the Society for Neuroscience, 25(43), 9850–7. http://doi.org/10.1523/JNEUROSCI.2373-05.2005
Bertoncini, J., Nazzi, T., Cabrera, L., & Lorenzi, C. (2011). Six-month-old infants
discriminate voicing on the basis of temporal envelope cues (L). The Journal of the Acoustical Society of America, 129(5), 2761–4.
http://doi.org/10.1121/1.3571424
Bertoncini, J., Serniclaes, W., & Lorenzi, C. (2009). Discrimination of speech sounds
based upon temporal envelope versus fine structure cues in 5- to 7-year-old
children. Journal of Speech, Language, and Hearing Research : JSLHR, 52(3), 682–95. http://doi.org/10.1044/1092-4388(2008/07-0273)
Billiet, C. R., & Bellis, T. J. (2011). The relationship between brainstem temporal
processing and performance on tests of central auditory function in children with
reading disorders. Journal of Speech, Language, and Hearing Research : JSLHR,
54(1), 228–42. http://doi.org/10.1044/1092-4388(2010/09-0239)
Bishop, D. V, Carlyon, R. P., Deeks, J. M., & Bishop, S. J. (1999). Auditory temporal
processing impairment: neither necessary nor sufficient for causing language
impairment in children. Journal of Speech, Language, and Hearing Research :
JSLHR, 42(6), 1295–310. Retrieved from
http://www.ncbi.nlm.nih.gov/pubmed/10599613
Chermak, G. D., Hall, J. W., & Musiekl, F. E. (1999). Differential Diagnosis and
Management of Central Auditory Processing Disorder and Attention Deficit
Hyperactivity Disorder. J Am Acad Audiol, 10, 289–303.
Perspectives. Singular Publishing Group Inc. Retrieved from
http://www.amazon.com/Central-Auditory-Processing-New-Perspectives/dp/1565936973
Corriveau, K., Pasquini, E., & Goswami, U. (2007). Basic auditory processing skills and
specific language impairment: a new look at an old hypothesis. Journal of Speech, Language, and Hearing Research : JSLHR, 50(3), 647–66.
http://doi.org/10.1044/1092-4388(2007/046)
Dawes, P., & Bishop, D. (2009). Auditory processing disorder in relation to
developmental disorders of language, communication and attention: a review and
critique. International Journal of Language & Communication Disorders / Royal College of Speech & Language Therapists, 44(4), 440–65.
http://doi.org/10.1080/13682820902929073
Eisenberg, L. S., Shannon, R. V, Martinez, A. S., Wygonski, J., & Boothroyd, A. (2000).
Speech recognition with reduced spectral cues as a function of age. The Journal of the Acoustical Society of America, 107(5 Pt 1), 2704–10. Retrieved from
http://www.ncbi.nlm.nih.gov/pubmed/10830392
Emanuel, D. C., Ficca, K. N., & Korczak, P. (2011). Survey of the diagnosis and
management of auditory processing disorder. American Journal of Audiology,
20(1), 48–60. http://doi.org/10.1044/1059-0889(2011/10-0019)
Fallon, M., Trehub, S. E., & Schneider, B. A. (2000). Children’s perception of speech in
multitalker babble. The Journal of the Acoustical Society of America, 108(6), 3023–9. Retrieved from http://www.ncbi.nlm.nih.gov/pubmed/11144594
Fraser, J., Goswami, U., & Conti-Ramsden, G. (2010). Dyslexia and Specific Language
Impairment: The Role of Phonology and Auditory Processing. Scientific Studies of Reading, 14(1), 8–29. http://doi.org/10.1080/10888430903242068
Gopal, K. V, & Kowalski, J. (1999). Slope analysis of Auditory Brainstem Responses in
28(2), 85–90. Retrieved from http://www.ncbi.nlm.nih.gov/pubmed/10384895
Hall, J. W., Grose, J. H., Buss, E., & Dev, M. B. (2002). Spondee recognition in a
two-talker masker and a speech-shaped noise masker in adults and children. Ear and Hearing, 23(2), 159–65. Retrieved from
http://www.ncbi.nlm.nih.gov/pubmed/11951851
Heinz, M. G., & Swaminathan, J. (2009). Quantifying envelope and fine-structure coding
in auditory nerve responses to chimaeric speech. Journal of the Association for Research in Otolaryngology : JARO, 10(3), 407–23.
http://doi.org/10.1007/s10162-009-0169-8
Henry, B. A., Turner, C. W., & Behrens, A. (2005). Spectral peak resolution and speech
recognition in quiet: normal hearing, hearing impaired, and cochlear implant
listeners. The Journal of the Acoustical Society of America, 118(2), 1111–21. Retrieved from http://www.ncbi.nlm.nih.gov/pubmed/16158665
Jerger, J., & Musick ’, F. (2000). Report of the Consensus Conference on the Diagnosis
of Auditory Processing Disorders in School-Aged Children. J Am Acad Audiol,
11, 467–474.
Jirsa, R. E. (2001). Maximum length sequences-auditory brainstem responses from
children with auditory processing disorders. Journal of the American Academy of Audiology, 12(3), 155–64. Retrieved from
http://www.ncbi.nlm.nih.gov/pubmed/11316053
Katz, J., Johnson, C. D., Brandner, S., Delagrange, T., Ferre, J., King, J., . . . Tillery, K.
(2002). Clinical and research concerns regarding the 2000 APD consensus
report and recommendations. Audiology Today, 14(2), 14–17.
Kumar, P., & Singh, N. K. (2015). BioMARK as electrophysiological tool for assessing
children at risk for (central) auditory processing disorders without reading
Lagacé, J., Jutras, B., Giguère, C., & Gagné, J.-P. (2011). Speech perception in noise:
exploring the effect of linguistic context in children with and without auditory
processing disorder. International Journal of Audiology, 50(6), 385–95. http://doi.org/10.3109/14992027.2011.553204
Mody, M., Studdert-Kennedy, M., & Brady, S. (1997). Speech perception deficits in poor
readers: auditory processing or phonological coding? Journal of Experimental Child Psychology, 64(2), 199–231. http://doi.org/10.1006/jecp.1996.2343
Nittrouer, S., & Boothroyd, A. (1990). Context effects in phoneme and word recognition
by young children and older adults. The Journal of the Acoustical Society of America, 87(6), 2705–15. Retrieved from
http://www.ncbi.nlm.nih.gov/pubmed/2373804
Oh, E. L., Wightman, F., & Lutfi, R. A. (2001). Children’s detection of pure-tone signals
with random multitone maskers. The Journal of the Acoustical Society of America, 109(6), 2888–95. Retrieved from
http://www.ncbi.nlm.nih.gov/pubmed/11425131
Peter, V., Wong, K., Narne, V. K., Sharma, M., Purdy, S. C., & McMahon, C. (2014).
Assessing spectral and temporal processing in children and adults using temporal
modulation transfer function (TMTF), Iterated Ripple Noise (IRN) perception,
and spectral ripple discrimination (SRD). Journal of the American Academy of Audiology, 25(2), 210–8. http://doi.org/10.3766/jaaa.25.2.9
Ponton, C. W., Moore, J. K., & Eggermont, J. J. (1996). Auditory brain stem response
generation by parallel pathways: differential maturation of axonal conduction
time and synaptic transmission. Ear Hear, 17(5), 402–410. http://doi.org/10.1097/00003446-199610000-00006
Rayes, H., Sheft, S., & Shafiro, V. (2014). Discrimination of static and dynamic spectral
patterns by children and young adults in relationship to speech perception in
Rosen, S. (1992). Temporal information in speech: acoustic, auditory and linguistic
aspects. Philosophical Transactions of the Royal Society of London. http://doi.org/10.1098/rstb.1992.0070
Russo, N. M., Nicol, T. G., Zecker, S. G., Hayes, E. A., & Kraus, N. (2005). Auditory
training improves neural timing in the human brainstem. Behavioural Brain Research, 156(1), 95–103. http://doi.org/10.1016/j.bbr.2004.05.012
Saxena, U., Allan, C., & Allen, P. (2015). Crossed and uncrossed acoustic reflex growth
functions in normal-hearing adults, typically developing children, and children
with suspected auditory processing disorder. International Journal of Audiology,
54(9), 620–6. http://doi.org/10.3109/14992027.2015.1043147
Saxena, Allan, & Allen. (2016). Acoustic Reflexes in Normal-Hearing Adults, Typically
Developing Children, and Children with Suspected Auditory Processing Disorder:
Thresholds, Real-Ear Corrections, and the Role of Static Compliance on
Estimates. Journal of the American Academy of Audiology. http://doi.org/10.3766/jaaa.15136
Sharma, M., Purdy, S. C., Newall, P., Wheldall, K., Beaman, R., & Dillon, H. (2006).
Electrophysiological and behavioral evidence of auditory processing deficits in
children with reading disorder. Clinical Neurophysiology : Official Journal of the
International Federation of Clinical Neurophysiology, 117(5), 1130–44. http://doi.org/10.1016/j.clinph.2006.02.001
Smith, Z. M., Delgutte, B., & Oxenham, A. J. (2002). Chimaeric sounds reveal
dichotomies in auditory perception. Nature, 416(6876), 87–90. http://doi.org/10.1038/416087a
Vanniasegaram, I., Cohen, M., & Rosen, S. (2004). Evaluation of selected auditory tests
in school-age children suspected of auditory processing disorders. Ear and Hearing, 25(6), 586–97. Retrieved from
Wilson, R. H., Farmer, N. M., Gandhi, A., Shelburne, E., & Weaver, J. (2010).
Normative data for the Words-in-Noise Test for 6- to 12-year-old children.
Journal of Speech, Language, and Hearing Research : JSLHR, 53(5), 1111–21. http://doi.org/10.1044/1092-4388(2010/09-0270)
Wilson, W. J., & Arnott, W. (2013). Using different criteria to diagnose (central) auditory
processing disorder: how big a difference does it make? Journal of Speech, Language, and Hearing Research : JSLHR, 56(1), 63–70.
Chapter 2
2
Auditory brainstem responses in children with auditory
processing disorder
2.1
Introduction
School-aged children are often referred to audiology for assessment because of concern
about their hearing in difficult listening situations. These children, when found to have
normal hearing threshold levels, may be suspected of having an auditory processing
disorder (APD). The diagnosis of APD is challenging because there is no one diagnostic
procedure that is agreed upon by hearing healthcare professionals, potentially leading to
inconsistent identification (Hind, 2006). Professional guidelines (ASHA, 2005; AAA,
2010) typically recommend behavioral test batteries consisting of speech and non-speech
tests designed to examine auditory skills. An assessment battery can include tests of
auditory discrimination, temporal processing, auditory pattern recognition, binaural
interaction and the perception of monaural low-redundancy and dichotic speech (ASHA,
2005). A diagnosis of APD is made based upon overall performance on the test battery.
Although the manner in which test results are combined may vary, typically performance
deficits in at least two or more tests in the battery falling at least two standard deviations
below age expectations are used to support an APD diagnosis (Chermak & Musiek,
1997). If only one test is administered the child would be identified as APD only if
performance was at least three standard deviations below expectations (ASHA, 2005).
The use of behavioral measures in diagnosing children with APD is controversial. Speech
tests (word or sentence repetition) have linguistic information, making it difficult to
distinguish between listening and language skills (Hall, 2007). Test results may also be
affected by attention (Sharma, Purdy, & Kelly, 2009).
The use of neurophysiologic techniques may provide some assistance in avoiding
language and attentional issues (Dawes & Bishop, 2009). Professional guidelines often
the auditory nervous system for APD. However, very few clinicians include objective
measures in their test battery. A survey of audiologists on protocols used to assess APD
revealed that less than 15 percent of clinicians indicated using electrophysiology tools
such as the auditory brainstem response (ABR), middle latency response or cortical
evoked potentials as part of their standard central auditory battery (Emanuel et al., 2011).
AAA (2010) described the value of click-evoked ABR as limited and some authors have
criticized the inclusion of ABR in a routine diagnostic battery due to lack of evidence
(Katz et al., 2002). This is unfortunate because the ABR has the potential to provide
useful information regarding the integrity of the ascending auditory pathway.
The ABR is widely used for objective hearing threshold and neuro-diagnostic assessment
(Stapells & Oates, 1997; Starr & Achor, 1975). It is a robust response characterized by
low intra-subject variability in both amplitude and latency (Lauter & Loomis, 1986). The
time at which peaks are generated provides information regarding travel time in the
brainstem. A delay in absolute or interwave intervals may suggest impairment as may the
ability of the system to maintain integrity at increasing stimulation rates. The ABR has
been used as an objective tool to study auditory neural integrity in children suspected of
an auditory processing disorder (Allen & Allan, 2014; Gopal & Kowalski, 1999; Jirsa,
2001) although the number of reported studies is limited and patient populations are often
small. For example, Gopal and Kowalski (1999) recorded ABRs in 9 children with APD
and 9 typically developing children. They used slope vector analysis which calculates the
amplitude difference between a positive peak and the following negative peak divided by
the travel time. The slope decreases when the amplitude of the peaks is low or the travel
time is lengthened. Children with APD demonstrated lower slopes compared to
age-matched controls. The effect of stimulus repetition rate was studied by Jirsa (2001) who
recorded Maximum Length Sequence ABRs in 37 children diagnosed with APD and
age-matched controls. They found wave V latency was significantly delayed in the children
with APD when the stimuli were presented at a very high rate (909.1/sec). Allen and
Allan (2014) recorded ABRs for slow (21.7 -27.7/sec) and faster rates (57.7/sec) in 62
children with suspected APD and 8 normal hearing adults. Approximately 25% of the
children showed delayed wave V latencies at the slower stimulation rate with many
Maturation must be considered when using the ABR as a neuro-diagnostic tool for infants
and very young children but responses are mature by school age, when most APD testing
is recommended. The ABR can be recorded as early as 27 weeks conceptual age (CA) but
responses are characterized by prolonged absolute and interpeak latencies and poor
amplitude when compared to older children and adults (Hecox & Galambos, 1974). Peak
I matures rapidly and is expected to be seen at adult latencies by 2-3 months of age, while
peaks III and V do not mature until 1-2 years of age (Gorga, Kaminski, Beauchaine,
Jesteadt, & Neely, 1989; Hall, 2006; Salamy, 1984). Peaks II and IV, seldom evaluated in
clinical settings, are found to follow behind the maturation of peaks I and V, respectively
(Salamy, 1984). Longer maturation times for the later occurring waves than for the earlier
ones results in maturational delays in the inter-peak intervals of very young children,
reflecting increased transmission time through the brainstem. Changes in ABR wave
amplitudes can also act as an index of maturation of the auditory brainstem. V/I
amplitude ratios are greater than 1.0 in normal hearing adults (Starr & Achor, 1975) but
are typically less than 1 until 3-4 years of age, after which there is an increase in peak V
amplitude resulting in an increased V/I ratio (Jiang et al., 1993; Mochizuki et al., 1982).
Maturational changes in the ABR likely arise from increased axonal myelination and
synaptic maturation (Eggermont & Salamy, 1988; Ponton et al., 1996). Understanding
how axonal and synaptic factors are impacted by maturation and pathologic processes
could prove useful when assessing auditory neural integrity in clinically referred children.
Ponton et al. (1996) developed a model of ABR generation and maturation based on
age-related changes in axonal conduction and synaptic transmission. The model was derived
from extensive review of the literature, anatomical and electrophysiological data from
infants and adults, intra-surgical recordings, and direct recording of the human cochlear
nuclear complex (CNC) through a brainstem implant device. The model argues that peaks
I and II are generated from the auditory nerve. The I-II interval is largely determined by
axonal conduction and is adult-like even for premature infants, 29-34 weeks CA. Peak
III is assumed to be generated by axons emerging from the CNC in the ventral acoustic
stria and the II-III interval is therefore dominated by synaptic contributions. It does not
become adult-like until 18 months post term. Peaks IV and V are generated from the
attains adult levels by 40 weeks CA. In contrast, the IV-V interval, reflecting synaptic
responses in the medial olivary nucleus, does not become adult-like until 11-12 months
post term. The non-linear best-fit functions to the synaptically dominated II-III and IV-V
intervals are parallel and slower than the axonally dominated I-II and III-IV intervals.
This closely matches the findings of Mochizuki et al. (1982) showing little change in I-II
and III-IV (axonal) intervals from infancy to adulthood but significant changes in the
maturation of II-III and IV-V (synaptic) intervals.
In this study, ABRs recorded from normal hearing adults and children referred for APD
assessment elicited both at slow (13.3 clicks/sec) and faster stimulation rates (57.7
clicks/sec) were analysed using traditional clinical measures (absolute and interwave
intervals for waves I, III and V, and the effect of stimulus presentation rate on wave V
latency) and using Ponton et al.’s model to separate axonal (I-II and III-IV) and synaptic
(II-III and IV-V) factors. The goal was to determine if the more detailed analysis could
provide useful clinical insights not visible with traditional, clinical inspection. Because
the ABR is mature within the first few years of life, the data from our clinical population
2.2
Methods
2.2.1
Participants
Participants included 20 normal hearing adults (20 to 35 years of age, mean age: 23.71
years, standard deviation [SD]: 3.90 years) and 108 children (5.25-15.7 years of age,
mean age: 9.63 years, SD: 2.70 years) with sAPD. The children had been referred to our
clinic because of concerns about their hearing as a contributor to poor academic
performance. As part of their clinical assessment all children underwent pure tone
audiometry to ensure that they had normal (< 20 dB HL) air-conduction thresholds at
octave frequencies from 250 to 8000 Hz and tympanometry to verify normal middle ear
function. Distortion product otoacoustic emissions (DPOAEs) were recorded to ensure
normal functioning of outer hair cells. Adult participants received a similar evaluation of
hearing threshold levels and had no reports of listening difficulties. The Health Sciences
Research Ethics Board of Western University, Canada approved the study methods.
2.2.2
Auditory Brainstem Responses
For all participants, ABRs had been acquired as part of their standard APD evaluation
using a Bio-logic Navigator Pro AEP system (Natus Medica, Inc). A 100 µs rarefaction
click was presented at 13.3 (slow) and 57.7 (fast) clicks/sec. Stimuli were presented
monaurally via insert earphones (ER-3A, Etymotic Research, Inc) to the right and left
ears at 80 dBnHL. Recordings were made with four surface electrodes placed at Cz and
Fz (ground) positions and referenced to the right and left earlobes. Electrode impedance
was below 5kΩ. The responses were averaged over a 10 msec window, amplified (100k)
and filtered (100-1500Hz). Artifact rejection was set at 23.8 µV. Click responses to 2000
repetitions were averaged for each response with a minimum of two replications. Lights
2.2.3
ABR analysis
Waves I to V were identified by an experienced audiologist and verified by a second
experienced audiologist. Wave V was always marked on the prominent ‘shoulder’
following the peak (expected time between 5 to 6 msec). Interwave intervals and the
effect of stimulation rate on wave V were calculated. The ABR data were compared to
published data (Schwartz, Pratt, & Schwartz, 1989) and evaluated according to the model
proposed by Ponton et al. (1996). For the Ponton model, the ABR data were analyzed
using interwave intervals that represents axonal conduction times (I-II and III-IV) and
synaptic transmission times (II-III and IV-V). A repeated measure of ANOVA was used
to evaluate group differences and effect sizes are reported as partial Eta-Squared (ŋ2p).
Whenever the assumption of sphericity was violated the Greenhouse-Geisser correction
2.3
Results
2.3.1
Clinical measures
Absolute latencies. Figure 2.1 shows the individual absolute wave I, III and V latencies for children and adults plotted as a function of age to facilitate visualization of individual
data. Responses from the children are shown by the unfilled circles and triangles for right
and left ears, respectively. Adult responses are shown by the filled circles and triangles
for right and left ears, respectively. Lower, middle and upper panels display latencies for
waves I, III and V, respectively. Solid horizontal black lines represent expected means
from published data (Schwartz et al., 1989). Dashed and filled grey lines represent ±1 and
±2 standard deviations, respectively.
As can be seen in the Figure 2.1, there was no apparent age effect in the children’s data
but there was a trend for the children’s latencies to be longer than those of the adults, [F
(1, 126) = 15.75, p < 0.001, ŋ2p = 0.111]. This was especially obvious for the later waves,
seen in a significant latency by group interaction [F (1.75, 220.77)= 5.03, p = 0.010, ŋ2p =
0.038]. Post hoc t-tests revealed a significant group difference for wave I [t (254) = 2.44,
p = 0.015], III [t (254) = 4.16, p < 0.001], and V [t (254) = 5.26, p < 0.001] with longer
latencies measured in the children compared to adults. There were no significant
differences between ears [F (1, 126) =.819, p = 0.367, ŋ2p = 0.006]. Individual latencies
for adults fell within 2 SD of published data (Schwartz et al., 1989) but the mean
latencies for the children were higher and several children showed wave latencies more
than 2 SD beyond expectations for wave I, III and V. At slower stimulation rates, 51 of
the 108 (47.22%) children had clinically abnormal absolute latencies (either in one or
more of waves I, III and V). Of these children, 33 (30.55%) children were unilateral and
18 (16.66%) were bilateral. Only 1 adult showed absolute latency (wave III) more than 2
Figure 2.1: ABR wave I, III and V latencies plotted as a function of age. Data for sAPD
children are shown as unfilled circles and unfilled triangles for right and left ears,
respectively. Adult responses are shown as filled circles and filled triangles for right and
left ears, respectively. Filled horizontal black line, unfilled and filled grey lines represents
mean, ±1 and ±2 SD, respectively. 3 3.2 3.4 3.6 3.8 4 4.2 4.4 4.6 4.8 5 5 50 Late n cy ( m sec ) Age (years) Wave III 5 5.2 5.4 5.6 5.8 6 6.2 6.4 6.6 6.8 7 5 50 Late n cy ( m sec ) Age (years) Wave V 1 1.2 1.4 1.6 1.8 2 2.2 2.4 2.6 2.8 3
5 10 20 40
Interwave intervals. Figure 2.2 shows I-III and III-V interwave intervals in lower and upper panels, respectively, plotted as a function of age. Symbols are the same as in Figure
2.1 for individual children and adults. Horizontal lines represent expected means ±1 and
±2 standard deviations from published data (Schwartz et al., 1989).
Interwave intervals (both I-III and III-V) were significantly prolonged in children when
compared to adults [F (1, 126) = 7.16, p = 0.008, ŋ2p = 0.054]. Interwave intervals showed
no significant difference between ears [F (1, 126) = 2.63, p = 0.107, ŋ2p = 0.020] and the
interwave interval by group interaction was not significant [F (1, 126)= .006, p = 0.938,
ŋ2
p = 0.000]. Latencies from individual adults and children largely fell within 2 SD of
published data but several children showed interwave latencies more than 2 SD beyond
expectations. Twenty children (18.51%) demonstrated unilateral abnormal interwave
intervals (either I-III or III-V). None were prolonged bilaterally. The incidence of
abnormalities was similar in the lower [I-III, n = 11 (10.18%)] and upper brainstem
Stimulus rate effects. In Figure 2.3, wave V latencies for faster rates of stimulation are plotted as a function of slow rate latencies for children (left panel) and adults (right
panel). Data for the right and left ear are shown by circles and triangles, respectively. 1 1.2 1.4 1.6 1.8 2 2.2 2.4 2.6 2.8 3
5 10 20 40
Late n cy ( m sec ) Age (years) Wave I-III sAPD RE sAPD LE Adult RE Adult LE 1 1.2 1.4 1.6 1.8 2 2.2 2.4 2.6 2.8 3 5 50 Late n cy ( m sec ) Age (years) Wave III-V
Figure 2.2: ABR interwave intervals I-III and III-V plotted as a function of age.
Data for sAPD children are shown as unfilled circles and unfilled triangles for
right and left ears, respectively. Adult response are shown as filled circles and
filled triangles for right and left ears, respectively. Filled horizontal black line,
The solid diagonal line shows no change and the dotted line shows an expected latency
shift of 0.36 msec (Jiang et al., 2009). The wave V shift was not significantly different
between groups [F (1, 126) = 1.60, p = 0.207, ŋ2p = 0.013]. There were no significant
difference between ears [F (1, 126) = 0.097, p = 0.756, ŋ2p = 0.001]. Although there were
no significant group effects several individual children showed large shifts in wave V
latency. Thirty-two of the 108 (29.62%) children showed abnormal shifts in wave V
latency (> 0.4ms) when stimulation rate changed from slow to fast. Of these, 24 were
unilateral and 8 were bilateral. Of the 32 children, 18 (16.66%) had shown clinically
abnormal absolute latencies at the slow rate.
Summary. Both group and individual data suggest that many of the children in this clinically referred group showed objective indicators of reduced neural integrity that
could contribute to their reported listening difficulties. However, these clinical measures
do not provide any information about whether the observed delay in absolute or
5.3 5.5 5.7 5.9 6.1 6.3 6.5 6.7 6.9
5.3 5.5 5.7 5.9 6.1 6.3 6.5 6.7 6.9
Fa st w av e V la te n cy (m sec)
Slow wave V latency (msec)
sAPD
5.3 5.5 5.7 5.9 6.1 6.3 6.5 6.7 6.95.3 5.5 5.7 5.9 6.1 6.3 6.5 6.7 6.9
Fa st w av e V la te n cy (m sec)
Slow wave V latency (msec)
Adults
Figure 2.3: Individual wave V latency shift in the faster stimulation rate (57.7 clicks/sec) plotted
as a function of slower stimulation rate (13.3 clicks/sec). Data for the right and left ears are
shown by unfilled circles and triangles for children sAPD, respectively. Adult data for the right
interwave latency was due to the atypical functioning of axonal or synaptic factors.
Evaluation of responses according to the model proposed by Ponton et al. (1996) was
used to understand the axonal conduction and synaptic contribution to abnormalities in
the children’s data.
2.3.2
Evaluation of axonal conduction and synaptic transmission
Figure 2.4 shows I-II, II-III, III-IV and IV-V interwave intervals at slow (leftmost panel)
and faster (rightmost panel) stimulation rates, plotted as a function of age. Symbols are
the same as in Figure 2.1 for individual children and adults. Solid horizontal black,
dashed and filled lines represent expected means, ±1 and ±2 standard deviations from
adult data, respectively.
As the figure shows, there was no trend for age effects within the group of children but
the children did show a tendency for longer interwave intervals in the intervals dominated
by synaptic factors (II-III and IV-V) than those dominated by axonal transmission (I-II
and III-IV) when compared to the adult data. A repeated measure of ANOVA was
applied to the responses with the ear (right and left), interwave interval (I-II, II-III, III-IV,
and IV-V) and stimulation rate (slow and fast) as within-subject factors and group
(children and adults) as a between-subject factor. There were statistically significant
differences between groups [F (1, 52) = 25.39, p < 0.001, ŋ2p = 0.328] and a significant
interaction between interwave interval and group [F (3, 156)= 6.08, p = 0.001, ŋ2p =
0.105]. Post hoc t-tests revealed no significant group difference in intervals measuring
axonal conduction time (I-II [p = 0.986] and III-IV [p = 0.664]), but intervals
representing synaptic transmission were significantly longer in the children (interwave
II-III [p < 0.001] and IV-V [p < 0.001]). There were no differences between ears [F (1, 52)
= 2.89, p = 0.095, ŋ2p = 0.053].
There were significant differences in interwave intervals at slow and faster stimulation
rates [F (1, 52)= 189.87, p < 0.001, ŋ2p = 0.785] but the rate by group interaction was not
significant [F (1, 52) = 1.45, p = 0.233, ŋ2p = 0.027]. The interaction between rate and
interwave interval showed a significant rate dependent prolongation [F (1.95, 156) =
prolonged interwave intervals that measures synaptic transmission time (interwave
interval II-III [p < 0.001] and IV-V [p < 0.001]) but stimulation rate had no effect on
intervals measuring axonal conduction time (I-II [p = 0.621] and III-IV [p = 0.429]). The
three-way interaction (interpeak interval by rate by groups) was not significant [F (3,156)
0 0.2 0.4 0.6 0.8 1 1.2 1.4 1.6 1.8 2 Late n cy ( m sec )
13.3 clicks/sec
IV-V
0 0.2 0.4 0.6 0.8 1 1.2 1.4 1.6 1.8 257.7 clicks/sec
0 0.2 0.4 0.6 0.8 1 1.2 1.4 1.6 1.8 2 Late n cy ( m sec )III-IV
0 0.2 0.4 0.6 0.8 1 1.2 1.4 1.6 1.8 2 Late n cy ( m sec )II-III
0 0.2 0.4 0.6 0.8 1 1.2 1.4 1.6 1.8 2 0 0.2 0.4 0.6 0.8 1 1.2 1.4 1.6 1.8 25 10 20 40
Age (years) 0 0.2 0.4 0.6 0.8 1 1.2 1.4 1.6 1.8 2
5 10 20 40
Late n cy ( m sec ) Age (years)
I-II
sAPD-RE sAPD-LE Adult RE Adult LE 0 0.2 0.4 0.6 0.8 1 1.2 1.4 1.6 1.8 2Figure 2.4: ABR interwave latencies I-II, II-III, III-IV and IV-V plotted as a function of age for slow and fast
rates in left and right panel, respectively. Data for sAPD children are shown as unfilled circles and unfilled
triangles for right and left ears, respectively. Adult responses are shown as filled circles and filled triangles for
right and left ears, respectively. Filled horizontal black line, unfilled and filled grey lines represent mean, ±1
Although the group trends suggested a preponderance of delays in the synaptically
dominated intervals of the children, it can be seen that many individual children showed
delays in axonal intervals. To better examine individual trends for the occurrence and
co-occurrence of synaptic and/or axonal delays and whether effects were unilateral or
bilateral, Venn diagrams were constructed. Figure 2.5 shows the number of children
showing axonal and synaptic transmission delays that exceeded 2 standard deviations
relative to the adult data. The upper and lower figures show the incidences of delays that
were observed at the slow and fast stimulation rates, respectively. Delays that were
unilateral are shown in the leftmost figures, and bilateral delays are on the right.
At the slow stimulation rate, shown in the 2 upper diagrams, 69 of the 108 children
(63.88%) showed delays, the majority, 53 (49.07%), were unilateral and 16 (14.81%)
were bilateral. As was indicated in the group level analysis, significant delays in
synaptically dominated intervals (II-III and IV-V shown by solid circles) were nearly 4
times more likely than delays in axonally dominated intervals (I-II and III-IV shown by
the patterned circles). Unilateral delays in axonal transmission, when they did occur,
were more likely to occur in the I-II interval. The presence of delays in both synaptic and
axonal intervals, as shown by the numbers in the intersection of solid and patterned
circles was consistently low.
At faster stimulation rates, the incidence and pattern of delays were very similar to that
observed at the slower rate. Sixty-one of the 108 children (56.48%) showed delays that
were much more often unilateral (n = 50, 46.29%) than bilateral (n = 11, 10.18%). The
incidence of axonal delays increased, especially in the lower level I-II response from the
auditory nerve. Although both groups had shown increased delays in the synaptic
intervals, the children were more likely to show large rate dependent axonal delays. The
I-II 1 III-IV 2 II-III 2 IV-V 8 1 1 1 I-II 8 III-IV 2 II-III 15 IV-V 17 1 7 3
Unilateral n=53 (49.07%) Bilateral n=16
I-II 20 IV-V 15 II-III 8 III-IV 3 2 1 1 I-II 6 III-IV 0 II-III 1 IV-V 4
Unilateral n=50 (46.29%) Bilateral n=11 (10.18%)
Figure 2.5: Venn diagrams illustrating number of children with clinically abnormal
interwave latencies at slower (top panel) and faster stimulation rates (bottom panel) in
unilateral and bilateral. I-II and III-IV interwave interval represents the axonal conduction