Rice Farmer’s Perception Of Salinity Problem, Their
Preferred Varieties And Cropping Environment In Niger
O. SouleymaneP
1
P
, E. NarteyP
2
P
, B. MannehP
3
P
, K. OforiP
2
P
, E. DanquahP
2
P
,
1: National Institute for Agronomic Research of Niger (INRAN).
2: School of Agriculture, College of Basic and Applied Sciences, University of Ghana. 3: Africa Rice center (ex-WARDA)/AfricaRice Sahel Station B.P. 96 Saint Louis/Senegal
INRAN (Institut National de la Recherche Agronomique du Niger)/ CERRA de Kollo BP 429 Niamey Niger
Corresponding author: Souleymane Oumarou: Email: 30TU[email protected]U30T
Abstract
Participatory rural appraisal (PRA) was conducted in 3 regions in March 2012. A total of 197
farmers were randomly selected from 11 villages in irrigated ecology. The PRA tools included
group discussion, individual interview, and field visit. Twenty composite soil samples have been
collected from irrigated and none irrigated fields. Soil pH, electrical conductivity, exchangeable
bases, cation exchange capacity, sodium adsorption ratio, and sodium potassium ration have
been determined. The results showed that lack of fertilizer, diseases and salinity problems, lack
of good varieties are the main production constraints. 90% of the farmers are aware of salinity
problem and the coping strategies are the use of manure and or ashes, use of straw, the avoidance
of urea. The farmers preferred traits are high yielding ability, resistance to stress, the height and
high tillering. Soils were acidic, the cation exchange capacity (CEC), electrical conductivity
(EC) and sodium adsorption ration (SAR) were significantly higher in irrigated fields then
non-irrigated ones.
Key words: Rice, farmers ‘perception, salinity, soil, participatory rural appraisal (PRA), Niger.
Introduction
Niger is a landlocked country in the heart of West Africa with a total area of 1,267,000 sq km,
but only half of this is habitable due to adverse climatic or soil conditions (Hohenheim, 2000).
Agriculture is the mainstay of the country’s economy, with most families relying on subsistence
farming (FAO, 2011). Rice production is estimated to be 10% of the total cereal production.
Irrigated rice is about 80 to 90% of national rice production (Issaka, 2000). The national average
yield is decreasing from 3.96 t/ha in 2000 to 1 t/ha in 2012. This led to a decrease of national
total production from 78400 t in 2000 to 5,400 t in 2012 (INS and Mda, 2012). Information on
characteristics of rice production environment and the role of various stakeholders is important
to identify factors to be considered in strategies to improve production. Key among these factors
include the importance of rice among other crops in the area, rice production constraints, causes
of low adoption of improved varieties, causes of abandonment of the adopted improved varieties,
and farmer’s preferences. Rice in this area is essentially cultivated under irrigation. Irrigation
schemes, especially under arid and semiarid environments, are experiencing increasing levels of
salt-affected soil because of mismanagement of the soils, irrigation and drainage principles,
poorly designed and managed irrigation infrastructures, excessive and irrational use of irrigation
water and global climatic change (Kashenge-Killenga, 2010). Therefore, it is important to know
the characteristics of rice production environment, to identify farmers’ needs and preferences and
to establish the impact of salinity among other production constraints in rice production area of
Niger.
Methodology
The study was conducted in three regions of western Niger, located in the semi-arid zone where
rice is cultivated (FAO, 2007). These regions were: Gaya, Niamey, and Tillabery.
Sampling procedure
A stratified random sampling was used for villages sampling. The first stratum was where
irrigation has been practiced for equal or more than 30 years. This is equivalent to at least sixty
seasons under irrigation (2 seasons per year). The second stratum was where the irrigation has
been practiced less than 30 years. Random samples of 30% of villages were taken in each of the
two strata. This led to a sample size of 11 irrigated schemes. This includes 3 irrigated schemes
less than 30 years and 8 more than (or equal to) 30 years old. The work was done with all the
participants together in one group, if the number was less than 15, but if the participants’ number
was beyond this, they were split into two or more groups of eight to twelve farmers. A total of
197 farmers have been used in all the villages.
Composite soil samples from the plough depth (20 cm) were taken from each site. Composite
soil samples were also taken from similar soils adjacent the sites which have had no history of
irrigation. These latter samples served as control. The soil and water samples were analyzed in
the soil laboratory of INRAN (National Institute of Agronomic Research, Niger).
Data collection and analysis
Group discussions were held to obtain community level information. The group of participants
was guided by a moderator who introduced topics for discussion and helped the group to
participate. The discussions were guided by a semi-structured questionnaire to get information
on areas of interest. Preference ranking was used for the determination of the preferences of
individual farmers. The pair-wise method was used to identify the preferred crop and the most
important constraint of rice production in the area. Individual interviews were made to
supplement the findings from the focus group discussion and for in-depth verification of key
issues discovered. To verify information from farmers’ field visits were conducted on farm.
These involved three representative fields with salinity and without salinity problem.
Soil texture was determined using Day (1965) method. Soils pH and electrical conductivity were
also determined. Total N of the fine earth was determined by using the Kjeldahl digestion
procedure as outlined by Anderson and Ingram (1993). Total phosphorus and cation exchange
capacity were determined using Murphy and Riley (1962) method and the available P by Olsen
et al. (1954) method. The Sodium Adsorption Ratio (SAR) was calculated was calculated using (Mohsen et al., 2009) method. The total dissolved ions in the water was measured as the sum of
ions present in a sample of water and was used as an estimate of the total dissolved solids (Turf,
2005). SPSS 16.0 software was used for socio-economic data analysis. GenStat 9.2 and
Minitab14 software were also used for statistical analysis. T-test and mean difference confidence
interval approach were used for data comparison between irrigated and non-irrigated fields.
Results
Rice appeared to be the most preferred crop in the area followed by millet, sorghum and cowpea.
All the farmers recognized that rice yield was decreasing over the years but diverged about the
causes and extents. Forty-eight (48) percent of the farmers said that yield was reduced about 25%
compared to 20 years ago. For twenty three (23) percent the yield reduction was about 50%.
Eight (8) percent of the farmers said that it was more than 50% and twenty one (21) percent said
that it was less than 25%.
Rice production was constrained by several problems such as lack of fertilizers, lack of good
varieties, salinity, diseases, birds attack and flooding. Salinity was the third most serious problem
impeding rice production after diseases and the lack of fertilizers. The lack of fertilizer and
diseases were the two most serious problems and they were scored 4 and ranked first. Varieties
problem and birds attack were scored 2 and were ranked fourth. Flooding notified in only one
village was the less serious problem in the area.
Ninety percent (90%) of the farmers in the area were aware of salt problem while the others were
not aware. Salinity was recognized by farmers through its appearance at the soil level (40% of
the farmers) and the symptoms on rice plants (50% of the farmers). Farmers also suspected
salinity in cases of yield reduction despite applying recommended levels of mineral fertilizer.
According to the farmers that experienced salt problems on their fields, salinity symptoms on
leaves of rice plants disappeared after the application of manure. Twenty-seven (27) percent
though that salinity came from soil degradation under irrigation and 32% thought it was
inherited.
The yield reduction due to salinity ranged from less than 25% at Sebery to 100% at some
abandoned fields of Saga. To improve productivity under salinity various strategies were
employed by farmers. These were: the avoidance of urea application (4%), Application of
manure (11%) or a combination of manure and ashes (6%) and Application of straw (9%).
However, seventy percent (70%) of the farmers use no method to overcome salinity problem.
A number of improved varieties have been released for irrigated rice cultivation. The improved
variety IR1529 was used about 20 years ago because of its relatively high yield and good taste. It
was abandoned because the decreasing yields due to susceptibility to diseases and the high
demand for fertilizer. Other varieties such as Wita 8 and Wita 9 were cultivated because of good
yield and ability to grow under low nitrogen conditions. They were abandoned because of their
sensitivity to drought, lodging, salinity and birds. BG, NERICA, and Gambiaka, were other
improved varieties in use.
The foremost trait preferred by farmers was yield followed by resistance to diseases. The
tolerance to salinity was the third preferred trait. High tillering ability was ranked fourth (4).
Other farmers preferred traits such as height, earliness and low nitrogen efficiency that were
respectively classified fifth, sixth and seventh. Grain quality such as good taste was the last trait
preferred by rice growers. However, this was the most preferred traits at Gaya.
Soil characteristics
A huge variability exists within irrigated field soils and among irrigated and non irrigated soils
texture. This variability existed also within non irrigated fields. Irrigated soils of Gaya Amont,
Gaya Aval, Sokondji, Ndounga Sebery and Ndounga were predominantly composed of clay and
silt. At Saga, Toula and Bonfeba, sand was the main component of the texture. Most of none
irrigated fields (NIF) were sandy soils. Irrigated fields soils were significantly different from
non-irrigated fields’ soils (at 0.001 probability level) in terms of clay content. Significant
differences also existed among the two types of fields in terms of sand content (at 0.05
probability level). However, in terms of silt content the irrigated fields were not different from
non-irrigated fields. Soils chemical characteristics for irrigated fields (IF) and non irrigated fields
(NIF) were mentioned in the table1. Irrigated field fields were significantly different from
none-irrigated ones in term of SAR, CEC, EC and Na/K. However pH of none-irrigated fields was not
significantly different from none-irrigated one.
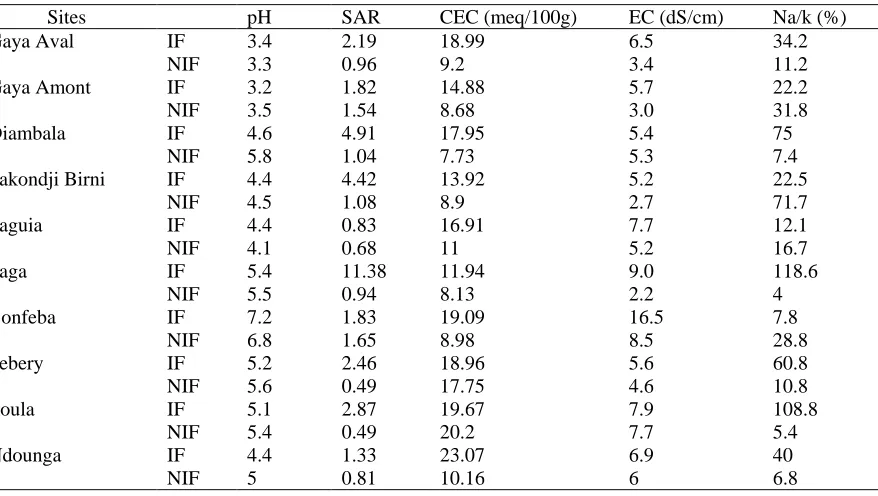
Table 1: Rice fields soils characteristics compared to non-irrigated fields
Sites pH SAR CEC (meq/100g) EC (dS/cm) Na/k (%)
Gaya Aval IF 3.4 2.19 18.99 6.5 34.2
NIF 3.3 0.96 9.2 3.4 11.2
Gaya Amont IF 3.2 1.82 14.88 5.7 22.2
NIF 3.5 1.54 8.68 3.0 31.8
Diambala IF 4.6 4.91 17.95 5.4 75
NIF 5.8 1.04 7.73 5.3 7.4
Sakondji Birni IF 4.4 4.42 13.92 5.2 22.5
NIF 4.5 1.08 8.9 2.7 71.7
Saguia IF 4.4 0.83 16.91 7.7 12.1
NIF 4.1 0.68 11 5.2 16.7
Saga IF 5.4 11.38 11.94 9.0 118.6
NIF 5.5 0.94 8.13 2.2 4
Bonfeba IF 7.2 1.83 19.09 16.5 7.8
NIF 6.8 1.65 8.98 8.5 28.8
Sebery IF 5.2 2.46 18.96 5.6 60.8
NIF 5.6 0.49 17.75 4.6 10.8
Toula IF 5.1 2.87 19.67 7.9 108.8
NIF 5.4 0.49 20.2 7.7 5.4
Ndounga IF 4.4 1.33 23.07 6.9 40
NIF 5 0.81 10.16 6 6.8
Discussion
Importance of rice and framers’ perception of its production constraints
Rice was the most preferred crop in the area because of three main raisons. First, rainfed crops
production is constrained by several factors such as drought, pests and diseases and the use
inherently low-yielding varieties of crops. Secondly, rice, more than all the others cereals, serves
as food and also helps to solve economic problems. The contribution of the irrigated schemes to
the family basic food coverage varies from 30 to 190 percent (IPTRID, 2004). Thirdly, rice is
cultivated two times a year giving it an advantage over other crops.
Salinity was the third most serious constraint after diseases and the lack of fertilizers. Farmers
considered salt problem as a phenomenon that was imposed by nature and that occurrence can
neither be predicted nor prevented. They thought that salt problem unlike the two first is a daily
routine constraint that once appeared will remain for no limited time.
Farmers ‘perceptions of the salinity problem, coping strategies and expectations
Ninety percent of the farmers were aware of the salt problem. In all the villages but “Gaya
Amont” this problem was mentioned. Yield loss can range from 10 to 100% depending on the
salinity level and the cultural practices. Because of soil degradation, farmers realized that their
field cannot produce using only mineral fertilizer. In some cases usage of urea was completely
avoided by farmers because it was said to burn the rice plants. Straw, manure and ashes were
also used in the area to deal with salt problems. Rice glumes and ashes were mostly used in
Gaya, while manure was applied in Tillabery. These coping strategies aim to avoid effects of salt
on soil structure by providing organic matter. The effects of exchangeable sodium on plants are
either direct on plant nutrition or indirect through deterioration of the soil structure, leading to
decreased hydraulic conductivity and aeration (Mahmood et al., 2004). Organic matter
application would enhance soil structure and reduce evaporation.
The most preferred rice characteristics were: yield, resistance to diseases, tolerance to salinity
high tillering ability and height. Farmers were interested in yield because rice was for the
population a source of income and food. All the improved varieties introduced in the region have
been adopted because of their relative high yield, and rejected some years later because of their
low yielding due to deterioration. The reasons for high preference for tall plants were that the
majority of the farmers harvested rice panicles using knives while standing. Tall plants lessened
the burden of bending to harvest (Efisue, 2007). Apart from this, tall plants had long rice straws
and more biomass. Farmers used straw to feed their animals. Other preferred rice characteristics
were earliness, low nitrogen efficiency, and taste. Short duration rice allow farmers to grow other
crops or to consecrate their time to others activities. Because of the lack of fertilizer provision,
farmers like varieties that can produce more with little amounts of fertilizer.
Rice production environment
Seventy percent (70%) of non-irrigated fields were sandy soils, while eighty percent (80%) of
irrigated field soils were clay and silt. The higher percentage of the irrigated fields being silty
and clay was due to the fact that these irrigation schemes were located in the low lying areas of
the Niger River. These soils have capacity to store and supply water and air for plant growth
(Adamu and Aliyu, 2012). Clay soils have a greater water holding capacity than sandy soils. In
addition, well drained soils typically have good soil aeration meaning that the soil contains air
which is conducive to healthy root growth, and thus, a healthy crop (Berry et al., 2007). Results
of non irrigated fields confirmed FAO (1994) report which said that sahelian soils are generally
sandy with sand percentage varying between 71 to 99% at the surface layer.
The results showed that the pH of all fields was lower than 5.6 except for Bonfeba. This was too
low for optimum development of rice. Most agronomic crops require soil water pH values
between 5.7 and 7 for optimum plant growth (Kidder et al., 1988; Kalra, 1995; Miller and Kissel,
2010). Soil pH is among the important environmental factors which can influence plant growth
(Reeuwijk, 2002). Soils formed under low rainfall conditions tend to be basic with soil pH
readings around 7.0. However, intensive farming over a number of years with nitrogen fertilizers
or manures can result in soil acidification (Cliff, 2005). This may be the reason why the irrigated
soils pH was more acidic than none irrigated soil. Irrigated Fields EC was too high (16.5dS/cm at
Bonfeba and 9dS/cm at Saga) to induce severe yield reduction of rice. In these two areas fields
are completely abandoned. This great EC level may partly be due to irrigation because irrigated
fields had greater value of electrical conductivity compare to none irrigated one. However, some
fields that have never been irrigated had also high EC. This was due to inherent soil salts
composition.
The sodium adsorption ratio (SAR) was significantly higher in irrigated fields than non-irrigated
ones. Munshower (1994) reported that SAR along with pH, characterize salt-affected soils.
When the SAR rises above 12 to 15, serious physical soil problems arise and plants have
difficulty absorbing water. The greatest level of SAR was observed at Saga irrigated fields.
These fields were abandoned because of salt problem. So the great salt content may explain this
high SAR.
Sodium to potassium ratio was significantly higher in irrigated schemes than non irrigated
schemes despite application of K fertilizer application in the irrigated rice fields and this could
be attributed to the high addition of Na from the irrigation water.
The CEC of irrigated field was significantly higher than for non irrigated fields likely due to their
higher clay and organic matter contents. Low CEC soils were more likely to develop potassium
and magnesium deficiencies, while high CEC soils were less susceptible to leaching losses of
these cations. The lower the CEC, the faster the soil pH will decrease with time.
Conclusion
The results of this study showed that yield, resistance to diseases and salinity, high tillering
ability and height were the most farmers preferred traits. The soil pH was low, the electrical
conductivity (EC), the sodium adsorption ratio (SAR), the cation exchange capacity (CEC) and
sodium potassium ration were significantly higher in irrigated fields compared to non-irrigated
ones. Most of the farmers’ rice fields were saline soils.
References
Adamu, G. K. & Aliyu, A. K. ( 2012). Determination of the influence of texture and organic matter on soil water holding capacity in and around tomas irrigation scheme, dambatta local government kano state. Research Journal of Environmental and Earth Sciences, 4: 1038-1044.
Anderson, J. M. & Ingram, J. S. I. (1993). Tropical soil biology and fertility. In: Ingram, J. S. I. (ed.) A handbook of methods. Wallingford, UK.: CAB International.
Berry, W., Ketterings, Q., Antes, S., Page, S., Russell-Anelli, J., Rao, R. & Degloria, S. (2007). Soil texture [Online]. Cornell University: 30TUhttp://nmsp.css.cornell.eduU30T. [Accessed 07/09 2014].
Cliff, S. (2005). Efficient fertilizer use: Soil ph management 20.
Day, P. R. (1965). Particle fractionation and particle-size analysis. In: Black, C. A. (ed.) Methods of soil analysis, part 1. Agronomy.
Efisue, A. A. (2007). Studies of drought tolerance in interspecific progenies of oryza glaberrima (steud) and o. Sativa (l) and an appraisal of the use of male gametocides in rice hybridisation. PhD, University of KwaZulu-Natal.
FAO (1994). Le travail du sol pour une agriculture durable. FAO Soils Bulletin 69. FAO, Rome: 90 FAO. (2007). Niger presentation [Online]. Rome:
30TU
http://www.fao.org/ag/AGP/AGPC/doc/Counprof/niger/niger.htmU30T. [Accessed 06/04 2013].
FAO. (2011). FAO initiatve on soaring food prices [Online].
Hohenheim (2000). Atlas of natural and agronomic resources of Niger and benin. Hohenheim: University of Hohenheim.
INS & Mda (2012). Agriculture. In: Mda (ed.) Annuaire statistique du Niger 2008-2012. Niamey: Direction des statistiques/Ministère du Développement Agricole
IPTRID (2004). Identification et diffusion de bonnes pratiques sur les périmètres irrigués en afrique de l’ouest. Rome.
Issaka, M. (2000). Contribution a l'étude des systemes rizicoles de la vallée du fleuve Niger: Cas des amenagements hydro agricoles de say. Ingenieur, ABdou Moumouni
Kalra, Y. P. (1995). Determination of ph of soils by different methods: Collaborative study. J. AOAC Int,
78: 310-321.
Kashenge-Killenga, S. (2010). Breeding investigations for salt tolerance in rice incorporating characterisation of salt affected soils and farmers perceptions and preferences for tolerant cultivars in north-eastern tanzania. PhD, University of KwaZulu-Natal.
Kidder, G., Sabbe, W. E. & Parks, C. L. (1988). Procedures and practices followed by southern state soil testing laboratories for making liming recommendations. Southern Cooperative Series bulletin no, 332: Univ. of Florida.
Mahmood, T., Turner, M., Stoddard, F. L. & Javed, M. A. (2004). Genetic analysis of quantitative traits in rice (oryza sativa l.) exposed to salinity. Australian journal for agricultural research, 55: 1173-1181.
Miller, R. O. & Kissel, D. E. (2010). Comparison of soil ph methods on soils of north america. Soil Science Society of America Journal, 74.
Mohsen, S., Majid, R. & Borzoo, G. K. (2009). Prediction of soil exchangeable sodium percentage based on soil sodium adsorption ratio. American-Eurasian J. Agric. & Environ. Sci., 5: 1-4.
Munshower, F. F. (1994). Practical handbook of disturbed land revegetation. Lewis Publishers, Boca Raton, Florida.
Murphy, J. & Riley, J. P. (1962). A modified single solution method for determination of phosphates in natural waters. Anal. Chim. Acta, 27: 31-36.
Olsen, S. R., Cole, C. V., Watanabe, F. S. & Dean, L. A. (1954). Estimation of available phosphorus in soils by extraction with sodium bicarbonate. Usda circular 939:1-19. Gov. Printing office washington d.C.
Reeuwijk, L. P. (2002). Editor. Procedures for soil analysis. 6th edition. - technical paper/international soil reference and information centre. Wageningen, The Netherlands.
Turf, R. (2005). Cation exchange capacity (cec) turf revolution.