Clinical and Experimental Gastroenterology
Dove
press
O r i G i n a l r E s E a r C h
open access to scientific and medical research
Open access Full Text article
Modulation of the gut microbiota composition
by rifaximin in non-constipated irritable bowel
syndrome patients: a molecular approach
sara soldi1
sotirios Vasileiadis2
Francesca Uggeri1
Mariachiara Campanale3
lorenzo Morelli4
Maria Vittoria Fogli5
Fiorella Calanni5
Maria Grimaldi5
antonio Gasbarrini3
1aaT – advanced analytical
Technologies srl, Piacenza, italy;
2Centre for Environmental risk
assessment and remediation, University of south australia, Mawson lakes, australia; 3internal Medicine
and Gastroenterology Division, Catholic University of rome, rome, italy; 4Microbiology institute, Catholic
University of Piacenza, Piacenza, italy;
5alfa Wassermann spa, Bologna, italy
Correspondence: sara soldi
aaT – advanced analytical Technologies srl, via Martiri della resistenza – Galleria san Giuseppe 1, 29122 Piacenza, italy Tel +39 05 2346 1483
Email [email protected]
Abstract: Rifaximin, with its low systemic absorption, may represent a treatment of choice for irritable bowel syndrome (IBS), mainly due to its ability to act on IBS pathogenesis, through the influence on gut microbiota. The aim of the present study was to assess, by biomolecular tools, the rifaximin active modulation exerted on gut microbiota of non-constipated IBS patients. Fifteen non-constipated IBS subjects were treated with 550 mg rifaximin three times a day for 14 days. Stool samples were collected before starting the treatment, at the end of it, and after a 6-week washout period. Real-time polymerase chain reaction, denaturing gradient gel electro-phoresis, and next-generation sequencing were applied to all the samples to verify and quantify possible microbial fluctuations. Rifaximin treatment did not affect the overall composition of the microbiota of the treated subjects, inducing fluctuations in few bacterial groups, balanced by the replacement of homologs or complementary bacterial groups. Rifaximin appeared to influence mainly potentially detrimental bacteria, such as Clostridium, but increasing the presence of some species, such as Faecalibacterium prausnitzii. A decrease in the Firmicutes/ Bacteroidetes ratio after 14 days of treatment and bacterial profiles with higher biodiversity were observed during the follow-up compared to baseline. Rifaximin treatment, although effective on IBS symptom relief and normalization of lactulose breath test, did not induce dramatic shifts in the microbiota composition of the subjects, stimulating microbial reorganization in some populations toward a more diverse composition. It was not possible to speculate on differences of fecal microbiota modification between responders vs nonresponders and to correlate the quali-/ quantitative modification of upper gastrointestinal microbiota and clinical response.
Keywords: IBS, rifaximin, next-generation sequencing, microbiota
Introduction
Irritable bowel syndrome (IBS) is a heterogeneous gastrointestinal (GI) disorder characterized by chronic recurrent abdominal pain or discomfort associated with disordered bowel habits.1 No single unifying cause has been identified for IBS, but there is recent evidence suggesting the involvement of the gut microbiota. In par-ticular, imbalances in gut microbiota have been suggested to contribute to IBS and IBS-related symptoms.2
The role of the intestinal microbiota in the pathophysiology of IBS was investigated in several studies. Early studies using selective and nonselective culture techniques demonstrated differing viable levels of coliforms, Lactobacillus, Bifidobacteria and Enterobacteriaceae species in fecal samples from IBS patients.3–5 More recent studies, using molecular methods, characterized an abnormality or dysbiosis in the intestinal microbiota of IBS subjects and demonstrated variations in the levels of the
Clinical and Experimental Gastroenterology downloaded from https://www.dovepress.com/ by 118.70.13.36 on 20-Aug-2020
For personal use only.
Number of times this article has been viewed
This article was published in the following Dove Press journal: Clinical and Experimental Gastroenterology
Dovepress
soldi et al
Eubacterium – Clostridium coccoides group and Lactoba-cillus, Veillonella, Coprococcus, Collinsella, Coprobacillus species.6–11
Rifaximin is a nonabsorbable, oral antibiotic derived from rifamycin, which has a broad spectrum of activity against gram-positive and gram-negative, aerobic, and anaerobic Enterobacteria.12 Recently, rifaximin treatment at the dose of 550 mg three times a day for 14 days was shown to induce a durable relief of symptoms from non-constipated IBS (non-C IBS).13 Other published clinical studies with rifaximin at 1,000 to 1,200 mg/day for approximately 10 days was shown to be effective in terms of IBS symptoms’ improvement and it was even associated with reduction in small intestinal bacterial overgrowth (SIBO) as diagnosed by hydrogen breath test.14–22
The aim of this exploratory study was, therefore, to evalu-ate the effect and the impact on gut microbiota, in terms of composition and diversity of fecal microbial community, after rifaximin treatment in patients with non-C IBS, using different molecular techniques, such as polymerase chain reaction (PCR)-Denaturing Gradient Gel Electrophoresis (DGGE) and high-throughput sequencing technologies. These techniques allow, in fact, a deeper characterization of bacterial communities such as the microflora of the GI tract. In particular, Illumina sequencing was chosen as a very powerful and up-to-date tool to improve the knowledge of complex environment composition.
Furthermore a possible correlation with clinical symp-toms was secondarily investigated.
Materials and methods
This exploratory, open label study was conducted at the Internal Medicine and Gastroenterology Division, Catholic University of Rome, between May 2011 and June 2012. The protocol was approved by the Comitato Etico Indipendente of the Catholic University of Rome (Italy) Ethics Committee, and all patients gave written informed consent. The study was conducted according to the European Clinical Trials Directive (EudraCT number: 2010-024177-39).
study population
We studied 15 non-C IBS patients and five healthy subjects (HS). Only non-C IBS patients received treatment with rifaxi-min 550 mg tablets three times a day for 14 days. Healthy volunteers did not receive any study drug.
HS were of either sex, aged between 18 and 75 years without concomitant diseases or recurring GI symptoms and no clinically significant abnormalities.
Non-C IBS patients (according to Rome II diagnostic criteria)23 with current symptoms of IBS aged between 18 and
75 years were enrolled. Patients were excluded if they had constipation-predominant IBS, inflammatory bowel disease, diabetes or unstable thyroid disease, history of duodenal or gastric ulcer, diverticulitis or infectious gastroenteritis, previous abdominal surgery or known hypersensitivity to rifaximin/rifampin or excipients, lactose intolerance, posi-tive stool culture for pathogenic bacteria, yeast, parasites and viruses, human immunodeficiency virus infection and renal, or cardiac or hepatic disease.
Subjects treated with rifaximin and other antibiotics, probiotics, antipsychotics, antispasmodics, bismuth sub-salicylate or Kaopectate, alosetron, laxatives, lubiprostone, proton-pump inhibitors, narcotics, prokinetic drugs within 4 weeks prior to and during screening were also excluded from the study.
Subjects could receive no more than 3 consecutive days of treatment with nonsteroidal anti-inflammatory drugs during the study. Tricyclic antidepressants and serotonin reuptake inhibitors were allowed at stable doses for at least 6 weeks prior to screening throughout the duration of the study.
study design and procedures
Following the screening procedures to exclude any con-comitant disease, the involvement of HS into the study was limited to the collection of one fecal sample.
Rifaximin 550 mg tablets were administered orally three times per day for 14 days to non-C IBS patients. Patients were followed for an additional 6 weeks. Before baseline assess-ment, patients underwent a 2-week screening period. Non-C IBS patients were administered an IBS symptom binary questionnaire each week during the treatment and the 6-week follow-up period, in order to assess IBS symptom improvement. Fecal sample collection and lactulose breath test (LBT) were performed at baseline (T0), at the end of 14 days of treatment, and at the end of the 6-week follow-up period (T56).
Adverse events were monitored throughout the study. The duration and intensity of each event were recorded by the investigator, together with its relationship to the study drug, and its outcome and seriousness. Standard laboratory tests, including hematology, biochemistry, and urinalysis were performed at screening, at the end of the treatment (T14), and at the end of the follow-up (T56).
Efficacy variables
The key clinical end point was the proportion of patients who achieved adequate relief of global IBS symptoms. This end point was determined from the response (yes or no) to the fol-lowing question, which was asked weekly during the evaluation
Clinical and Experimental Gastroenterology downloaded from https://www.dovepress.com/ by 118.70.13.36 on 20-Aug-2020
Dovepress non-constipated iBs subjects treated with rifaximin
period (ie, weeks 2 through 5): “In regard to all your symptoms of IBS, as compared with the way you felt before you started the study medication, have you, in the past 7 days, had adequate relief of your IBS symptoms?”. Other clinical end points were the proportion of patients reporting adequate relief of bloating, abdominal pain/discomfort during the same period.
Bacterial community Dna extraction
The collected fecal samples were frozen immediately at −30°C and stored until used. Fecal bacterial DNA was extracted using the FastDNA SPIN Kit and FastPrep Instrument (MP Biomedicals, Santa Ana, CA, USA). The extracted DNA was quantified using the PicoGreen method of the Quant-iT™ HS ds-DNA assay kit in a Qubit™ fluorometer (Thermo Fisher Scientific, Waltham, MA, USA) and verified.Quantitative PCr
Real-time PCR (RT-PCR) was performed in epGradientS, RealPlex4 instrument (Eppendorf, Amburg, Germany), and SYBR Green I fluorophore was used to correlate the amount of PCR product with the fluorescence signal. Specific primers for the quantification of 16S rRNA gene belonging to some of the most interesting phyla/genera constituting the gut micro-biota, ie, Bifidobacteria, Enterobacteriaceae, Firmicutes, and Bacteroidetes, were used as previously reported.24–26 For all the samples, the amount of DNA was adjusted to the same concentration of 3 ng/µL to avoid quantification biases, and the final results were converted to correspond to the bacterial load found in 1 g of wet feces.
PCr-DGGE analysis
Two primers designed on the 16SrDNA molecules, Bact0124-GCf and Univ0515r were chosen. The amplification was performed following the indications reported by Heilig et al.27 Dice’s and Pearson’s coefficients were calculated applying the specific software InfoQuestTMFP Software (Bio-Rad Laboratories Inc., Hercules, CA, USA) and the sequences of the isolated fragments were compared to those available in public databases by using Basic Local Alignment Search Tool analysis of sequences from Ribosomal Database Project.28
Multiplexed high-throughput sequencing
of the prokaryotic 16s rrna gene PCr
amplicons
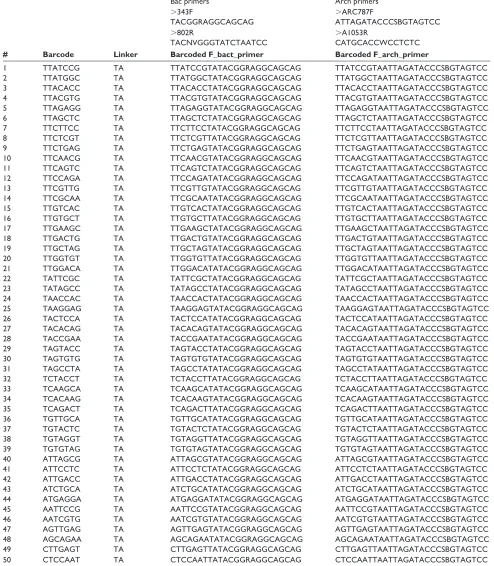
The V3-4 hypervariable region PCR amplicons and the V5-6 hypervariable region PCR amplicons of the bacterial and archaeal 16S rRNA gene, respectively, were screened using an Illumina platform multiplex approach.29 The amplification,
quantification, and pooling details are provided in the Supple-mentary materials. Details about primers and linkers design were previously optimized by Vasileiadis et al.30
The PCR amplicon pool was then purified using the solid- phase reversible immobilization method of the Agencourt® AMPure® XP kit (Beckman Coulter, Brea, CA, USA). Illumina sequencing with the V3 chemistry and library preparation of the amplicons were performed by Fasteris SA (Geneva, Switzerland).
sequence data preparation
Base-calling and demultiplexing of the sequenced libraries were performed with the MiSeq Control V2.3.0.3 (Illumina Inc., San Diego, CA, USA), the RTA v1.18.42.0 (Illumina Inc., San Diego, CA, USA), and the CASAVA v1.8.2 soft-wares (Illumina Inc., San Diego, CA, USA). Amplicon reconstruction was performed with the “pandaseq” script, previously made available by Masella et al.31 Fastx-toolkit was used for demultiplexing procedure applied to the sequences (http://www.hannonlab.cshl.edu/fastx_toolkit/). Read assembly and sample index-based demultiplexing resulted in 7,536,760 reads to be further analyzed. The sequences were submitted at the Sequence Read Archive (http://www.ncbi. nlm.nih.gov/sra) of the National Center for Biotechnology Information (http://www.ncbi.nlm.nih.gov) and are publicly accessible under the BioProject number PRJNA279031. These reads were further processed with the Mothur v 1.32.1 software suit32 for removal of potentially chimeric amplicons, miss-amplified genes and gene regions.
statistical analysis
The full analysis and safety sets of data included all patients randomized who received at least one dose of study medication and who had at least one post-baseline safety assessment.
Demographic variables and baseline
disease factors
The number and proportion of subjects with normaliza-tion of LBT at the end of treatment and at the end of the follow-up and with and without adequate relief of global IBS symptoms, abdominal pain/discomfort, and bloating each week during the study were summarized by means of descriptive statistics.
Microbiological analysis
Statistical analysis of the data produced by DGGE technique were provided by the Dice’s coefficient to obtain an objective
Clinical and Experimental Gastroenterology downloaded from https://www.dovepress.com/ by 118.70.13.36 on 20-Aug-2020
Dovepress
soldi et al
interpretation of the similarity of the profiles belonging to each single subject. Statistical evaluations of RT-PCR results were performed using mean, median, standard deviation (SD) of the values, obtained in duplicate, among different collec-tion moments and considering selected bacterial groups, as established after DGGE analyses results. RealPlex instrument and software were used for real-time amplification and data statistics.
high Throughput sequencing data analysis
Modules of Mothur v1.32.132 were used for calculating the α diversity indicators, while the R v 3.0.033 software with the Vegan34 package, unless otherwise stated, were used for the rest analysis tests. The generated amplicon reads per sample were down-sampled to the sequences for the sample represented by the lowest number of reads per targeted microbial group, to reduce biases associated with potentially undetected sequencing artefacts32 and also the sample size effect on the α and β diversity indices.35 The sequence data analysis was performed through the operational taxonomic unit (OTU) and the taxonomy-based approaches. The OTU and taxonomy matrices were used to assess the associated α and β diversity of the analyzed samples. Calculated α diversity indices included the inverse Simpson’s index (D).36 Core microbiome analysis was performed in order to identify OTUs consistently occur-ring for each sampling, defined as sequences with relative abundances of at least 1% in 60% of the samples. Differences between samples and testing experiment-associated hypotheses were analyzed through clustering analysis and multivariate approaches. Dominant OTUs and taxa were further analyzed for differential abundances and correlations between treat-ments and time using Student’s t-test-based pairwise com-parisons of the Metastats R package37 and rank correlations. Interesting sequences were subjected to maximum likelihood phylogenies along with type isolate partial 16S rRNA gene sequences using the RAxML-HPC v7.2.8 software.38Results
Characteristics of the subjects
Five HS (one male and four females), with a mean age (± SD) of 27.7±8.2 years (range: 22–44) and 15 patients with non-C IBS (five males and ten females) with a mean age (± SD) of 34.5±14.5 years (range: 19–62) were enrolled. All HS and patients were of Caucasian origin. None of the enrolled patients and HS were taking concomitant medications during the month before the screening visit and during the study. Stool culture for pathogenic bacteria, yeast, parasites, and viruses performed before the first drug intake were negative in all enrolled HS and patients. The compliance to study drug was higher than 90% in all patients. All the patients completed the entire 56-day study period. At baseline (T0), 12 of the 15 non-C IBS patients had a diagnosis of SIBO confirmed by an LBT.
Efficacy
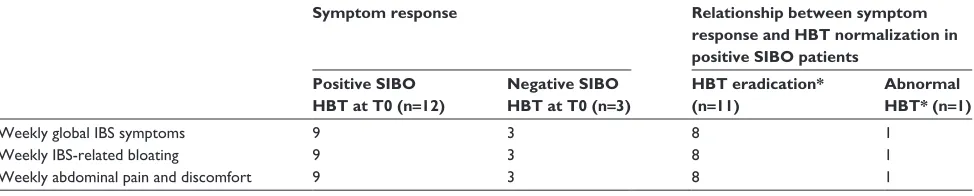
Of the patients, 80% (12/15) met the criteria for the key clinical end point of adequate relief of global IBS symptoms during the evaluation period. Patients with adequate relief of global IBS symptoms also reported adequate relief of bloating and abdominal pain/discomfort. In regard to LBT normalization, eleven of 12 patients (92%) with a positive diagnosis of SIBO at baseline confirmed by LBT had a negative LBT at the end of treatment with rifaximin and ten (83%) were negative at T56. Nine of them had a negative LBT both at the end of 14 days of treatment and at end of follow-up (T56).
Eight of the eleven patients who had a negative LBT at the end of treatment, and seven of the nine patients who had a negative LBT both at T14 and at T56, achieved an overall relief of IBS symptoms. A summary of clinical and hydrogen breath testing results, and the relationship between clinical response and hydrogen breath test are shown in Table 1.
Table 1 summary of clinical and hydrogen breath testing results, and relationship between clinical response and hydrogen breath test
Symptom response Relationship between symptom
response and HBT normalization in positive SIBO patients
Positive SIBO HBT at T0 (n=12)
Negative SIBO HBT at T0 (n=3)
HBT eradication* (n=11)
Abnormal HBT* (n=1)
Weekly global iBs symptoms 9 3 8 1
Weekly iBs-related bloating 9 3 8 1
Weekly abdominal pain and discomfort 9 3 8 1
Notes: T0 = baseline. *hBT performed at the end of 14 days of treatment.
Abbreviations: iBs, irritable bowel syndrome; hBT, hydrogen breath test; siBO, small intestinal bacterial overgrowth; T14, the sampling time at the end of 14 days of treatment.
Clinical and Experimental Gastroenterology downloaded from https://www.dovepress.com/ by 118.70.13.36 on 20-Aug-2020
Dovepress non-constipated iBs subjects treated with rifaximin
Molecular data
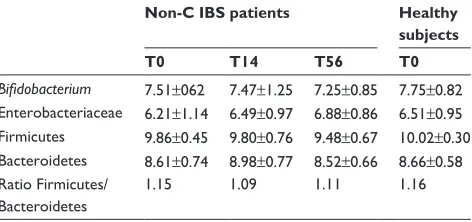
The fecal samples collected from all enrolled non-C IBS (ie, 15) patients and HS were processed according to the Material and methods section. All the values obtained from RT-PCR are reported in Table 2.
At T0, the mean levels of Bifidobacteria and Enterobac-teriaceae in HS were similar to the mean values calculated for IBS subjects across each collection time.
In IBS patients, a general stability of the investigated groups across the different time points was observed: any fluctuation of Bifidobacterium spp., Enterobacteriaceae, Firmicutes, and Bacteroidetes seemed to be subject-related, even though an increasing trend over time was observed for Enterobacteriaceae (Table 2).
DGGE analyses confirmed that rifaximin did not signifi-cantly affect the overall composition of the core microbiota, as shown by uniformity of bands abundance and richness in the 15 subjects and across the three sampling time points (average number of dominant bands at T0=22±6.4, T14=20±7.0 and T56=21±6.6; for HS average number of bands was 23±5.3).
Similarity comparison between different sampling times in the same subject, calculated through Dice’s coefficients (T0 vs T14 80±5.7%; T14 vs T56 85±12%; T56 vs T0 77±13%) suggested that rifaximin treatment did not induce relevant and measurable changes in the core microbiota.
However, fluctuations at the level of specific bacterial populations at T14 samples were observed in clostridial rep-resentatives (eight out of 15 patients) and Faecalibacterium prausnitzii sequences (four out of 15 patients).
high-throughput sequencing-based
diversity screening
High-throughput sequencing was performed, in order to confirm and further analyze data obtained with RT-PCR and DGGE analysis.
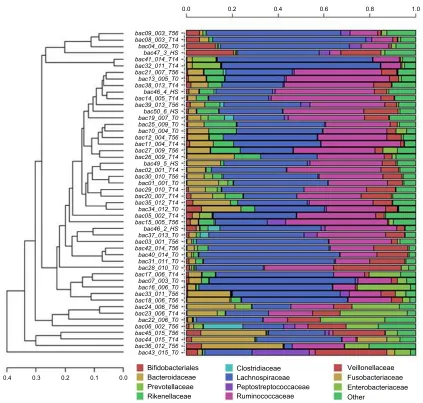
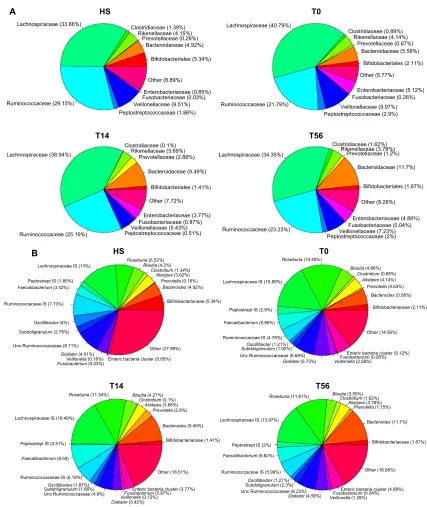
Figure 1 reports the hierarchical clustering of clas-sified sequences, performed using the average linkage algorithm according to the order–family classifications for taxa participating with $10% in at least one sample. Taxa with lower participations were added to the “other” sequence group. The obtained clustering clearly showed that Lachnospiraceae and Ruminococcaceae dominated the major-ity of the surveyed microbial communities followed in abun-dance by Bacteroidaceae and Veillonellaceae (Figure 2A). Bacteroidetes were more abundant in IBS samples (T0: 5.58%, T14: 9.49%, T56:11.7%) compared to HS (4.92%), whereas Bifidobacteria were lower in IBS samples (T0: 2.11%, T14: 1.41%, T56: 1.67%) than in HS (5.34%).
Genus-related pie charts of HS (Figure 2B) showed a lower presence of Roseburia and Faecalibacterium in HS compared to IBS subjects, being the former 6.52% vs 14.4% and the latter 3.42% vs 5.66% respectively. Moreover at the end of the rifaximin treatment (T14), Faecalibacterium was increased (T14: 8.50% vs T0: 5.58%).
As shown in Figure 3, the IBS sample bacterial com-munities had reduced diversity (Simpson’s D). The average values of this coefficient were higher in HS (18.2) than IBS subjects (16.1), with a slight increasing trend from T0 to T56, leading to the hypothesis of a recovery in bacterial species differentiation after rifaximin intervention. This observation could also be inferred by the pie charts (Figure 2A and B), where the compositions of the bacterial communities at T0 are similar to those at T56.
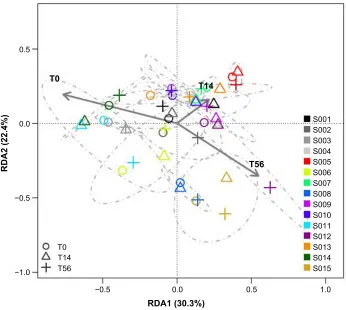
Clustering analysis did not suggest a particular treat-ment/time-wise grouping of the surveyed communities at taxonomical levels as low as the genus level (Figure 2B). Results of distance-based redundancy analysis showed that the combined effect of subject and sampling time contributed to 68.6% of the total variance between samples, but with most of it being attributed to the subject factor (94.3% of the explained variance, P,0.001) and only a small portion (5.7% of the explained variance, P=0.028) associated with the sampling time (antibiotic-associated effect) (Figure 4).
Pairwise comparisons between samples of different experimental time points and with HS showed significantly lower participation of Clostridiaceae at T14 compared to T0 and T56. Bacteroidaceae increased in IBS subjects during the course of the trial and compared to HS. Enterobacteriaceae Table 2 average log 10 amount (± sD) of 16s rrna gene copies
belonging to different phyla/genera at different fecal collection time points per gram of feces detected by rT-PCr
Non-C IBS patients Healthy subjects
T0 T14 T56 T0
Bifidobacterium 7.51±062 7.47±1.25 7.25±0.85 7.75±0.82 Enterobacteriaceae 6.21±1.14 6.49±0.97 6.88±0.86 6.51±0.95 Firmicutes 9.86±0.45 9.80±0.76 9.48±0.67 10.02±0.30 Bacteroidetes 8.61±0.74 8.98±0.77 8.52±0.66 8.66±0.58 ratio Firmicutes/
Bacteroidetes
1.15 1.09 1.11 1.16
Notes: all P-values calculated among different sampling times and in comparison with HS never revealed any statistical significance, being included in 0.079–0.912 range (P.0.05). T0: baseline; T14: at the end of 14 days of treatment; T56: at the end of the 6-week follow-up period.
Abbreviations: sD, standard deviation; rT-PCr, real-time polymerase chain reaction; non-C iBs, non-constipated irritable bowel syndrome; hs, healthy subjects.
Clinical and Experimental Gastroenterology downloaded from https://www.dovepress.com/ by 118.70.13.36 on 20-Aug-2020
Dovepress
soldi et al
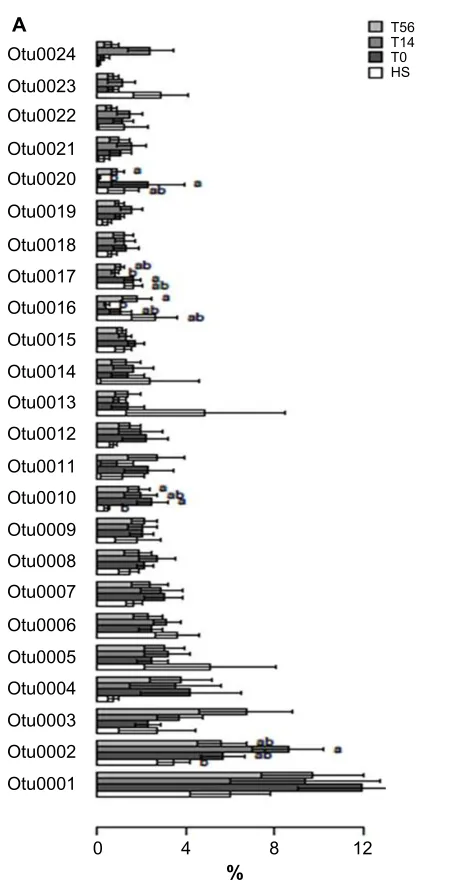
had higher abundance in IBS subjects compared to HS. Significant differences were found also in Streptococcaceae, that decreased in IBS patients over time; on the contrary Prevotellaceae were more represented in IBS samples than in HS, particularly after rifaximin treatment (Figure 5).
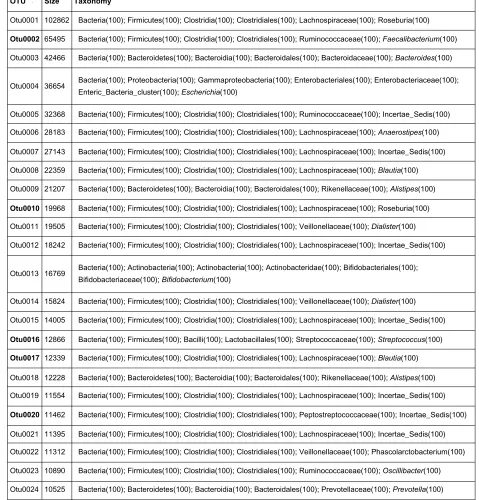
Maximum likelihood phylogeny showed that Otu0020, that resided in the same clade of Clostridium bartlettii, decreased from 2% to an almost undetectable amount of sequences at T14 and recovered to 1% at T56 (Figure 5). Other OTUs with significant variations (Otu0002, Otu0010, Otu0016, and Otu0017) corresponded to F. prausnitzii (from 5.6% at T0 to 8.5% at T14), Roseburia inulinivorans (from 2.4% at T0 to 1.9% at T56), Streptococcus salivarius/ vestibularis (from 1% at T0 to 0.4% at T14, followed by a recovery to 1.9% at T56), and Blautia luti (from 1.6% at T0 to 0.7% at T14). Core bacteriome analysis between HS and the
different sampling times in the IBS patients yielded 15 OTUs shared among all core bacteriomes (Table 3). The number of core bacteriome OTUs was reduced according to the ranking order: HS (13 OTUs) . T0 (ten OTUs) . T14 (six OTUs) . T56 (five OTUs). Thus, resulting in a condensation trend along time and treatment of the core bacteriome. Most OTUs were affiliated with the Firmicutes phylum, especially repre-sented in the gut environment, and just two out of 15 OTUs were included in Bacteroidetes phylum. Five out of 15 OTUs participated in all core bacteriomes with their family/genus level taxonomical affiliations belonging to Roseburia, Faeca-libacterium, Bacteroides, Anaerostipes, Lachnospiraceae. The described core bacteriome condensation corresponded to a trend of reduction in the within-sample diversity as shown by the obtained inverse Simpson’s D values (Figure 3) and an increased between-subject bacterial community structural 0.0
bac09_003_T56 bac08_003_T14 bac04_002_T0 bac47_3_HS bac41_014_T14 bac32_011_T14 bac21_007_T56 bac13_005_T0 bac38_013_T14 bac46_4_HS
bac50_6_HS
bac49_5_HS
bac46_2_HS bac14_005_T14 bac39_013_T56 bac19_007_T0 bac25_009_T0 bac10_004_T0 bac12_004_T56 bac11_004_T14 bac27_009_T56 bac26_009_T14 bac02_001_T14 bac30_010_T56 bac01_001_T0 bac29_010_T14 bac20_007_T14 bac35_012_T14 bac34_012_T0
bac37_013_T0 bac03_001_T56 bac42_014_T56 bac40_014_T0 bac31_011_T0 bac28_010_T0 bac07_003_T0 bac16_006_T0 bac33_011_T56 bac18_006_T56 bac24_006_T56 bac23_006_T14 bac22_006_T0 bac06_002_T56 bac45_015_T56 bac44_015_T14 bac36_012_T56 bac43_015_T0
0.4 0.3 0.2 0.1 0.0
Bifidobacteriales Bacteroidaceae Prevotellaceae Rikenellaceae
Clostridiaceae Lachnospiraceae Peptostreptococcaceae
Ruminococcaceae Other Veillonellaceae Fusobacteriaceae Enterobacteriaceae
bac17_006_T14 bac05_002_T14 bac15_005_T56
0.2 0.4 0.6 0.8 1.0
Figure 1 Hierarchical clustering of classified sequences, according to the order–family taxonomy levels for taxa participating with $10% in at least one sample.
Notes: Different colors indicate the bacterial taxa identified for each sample. No specific clustering was observed.
Abbreviations: hs, healthy subjects; T0, baseline; T14, at the end of 14 days of treatment; T56, at the end of the 6-week follow-up period.
Clinical and Experimental Gastroenterology downloaded from https://www.dovepress.com/ by 118.70.13.36 on 20-Aug-2020
Dovepress non-constipated iBs subjects treated with rifaximin
variability (β-diversity) for samples derived from the IBS patients, as confirmed by the distance-based redundancy analysis results (Figure 4).
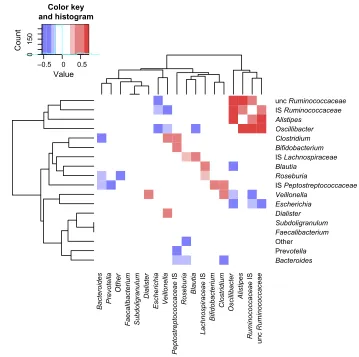
For assessing potentially informative bacterial associations throughout all samples, we performed a Spearman’s rank correlation test between bacterial taxonomical annotations followed by hierarchical clustering of the obtained correlation values. Two major groups of taxa were formed according to
the Spearman’s rank correlation test (Figure 6). The first one included the Ruminococcaceae, Alistipes and Oscillibacter taxa, which were positively correlated with each other and mainly negatively correlated with Escherichia and Veil-lonella, while Oscillibacter was also negatively correlated with Blautia. The second major cluster was divided into three subclusters as follows: the Clostridium, Bifidobacterium, Lachnospiraceae incertae sedis (IS), Blautia, Roseburia and
Bifidobacteriales (5.34%)
Bifidobacteriales (1.41%) Bifidobacteriales (1.67%) Bifidobacteriales (2.11%) Bacteroidaceae (4.92%)
Bacteroidaceae (9.49%) Bacteroidaceae (11.7%) Bacteroidaceae (5.58%) Prevotellaceae (0.26%)
Prevotellaceae (2.88%) Prevotellaceae (1.2%) Prevotellaceae (0.67%) Rikenellaceae (4.15%)
Rikenellaceae (3.69%) Rikenellaceae (3.78%) Rikenellaceae (4.14%) Clostridiaceae (1.39%)
Clostridiaceae (0.1%) Clostridiaceae (1.62%) Clostridiaceae (0.89%) Lachnospiraceae (33.66%)
Lachnospiraceae (38.94%) Lachnospiraceae (34.35%) Lachnospiraceae (40.79%)
HS A
T14 T56
T0
Peptostreptococcaceae (1.86%)
Peptostreptococcaceae (0.51%) Peptostreptococcaceae (2%) Peptostreptococcaceae (2.9%) Ruminococcaceae (29.15%)
Ruminococcaceae (25.19%) Ruminococcaceae (23.23%) Ruminococcaceae (21.79%) Other (8.89%)
Other (7.72%) Other (8.28%)
Other (5.77%)
Veillonellaceae (9.51%)
Veillonellaceae (5.43%)
Veillonellaceae (7.23%) Veillonellaceae (9.97%) Fusobacteriaceae (0.03%)
Fusobacteriaceae (0.87%) Fusobacteriaceae (0.04%) Fusobacteriaceae (0.26%) Enterobacteriaceae (0.85%)
Enterobacteriaceae (3.77%) Enterobacteriaceae (4.89%) Enterobacteriaceae (5.12%)
Figure 2 Pie charts of the community compositions of samples derived from iBs patients and healthy subjects.
Notes: Themean values of the major order/family level taxa (A) and genera (B) are presented for each study group. T0: baseline; T14: at the end of 14 days of treatment; T56: at the end of the 6-week follow-up period.
Abbreviations: iBs,irritable bowel syndrome; HS, healthy subjects; IS, incertae sedis; Unc, unclassified.
Bifidobacteriaceae (1.41%) Bifidobacteriaceae (1.67%) Bifidobacteriaceae (2.11%) Bifidobacteriaceae (5.34%)
Bacteroides (5.58%) Prevotella (0.63%) Alistipes (4.14%) Clostridium (0.88%) Blautia (4.86%) Roseburia (14.49%)
Lachnospiraceae IS (15.89%) Prevotella (0.16%)
Prevotella (2.8%) Prevotella (1.15%) Bacteroides (4.92%)
Bacteroides (9.49%) Bacteroides (11.7%) Alistipes (3.62%)
Alistipes (3.68%) Alistipes (3.78%) Roseburia (6.52%)
Roseburia (11.34%) Roseburia (11.61%) Blautia (4.2%)
Blautia (4.27%) Clostridium (1.34%)
Clostridium (0.1%)
Blautia (3.55%) Clostridium (1.62%) Lachnospiraceae IS (13%)
Lachnospiraceae IS (16.49%) Lachnospiraceae IS (13.87%)
HS
T14 T56
T0 B
Peptostrept IS (1.85%)
Peptostrept IS (2.9%) Faecalibacterium (3.42%)
Faecalibacterium (5.66%) Ruminococcaceae IS (7.73%)
Ruminococcaceae IS (4.78%) Oscillibacter (4%)
Oscillibacter (1.21%) Subdoligranulum (2.75%)
Subdoligranulum (1.92%) Unc Ruminococcacseae (8.11%)
Peptostrept IS (0.51%)
Faecalibacterium (8.59)
Peptostrept IS (2%)
Faecalibacterium (5.62%)
Ruminococcacseae IS (6.19%) Ruminococcaceae IS (5.99%) Oscillibacter (1.87%) Oscillibacter (1.27%) Subdoligranulum (1.66%) Subdoligranulum (2.3%) Unc Ruminococcaseae (4.9%) Unc Ruminococcacseae (6.23%)
Unc Ruminococcacseae (6.68%) Veillonella (0.16%)
Fusobacterium (0.03%) Veillonella (2.58%) Fusobacterium (0.26%) Dialister (4.01%)
Veillonella (0.12%)Fusobacterium (0.87%) Veillonella (1.28%)Fusobacterium (0.04%) Dialister (3.42%)
Dialister (4.56%) Dialister (5.73%) Other (27.99%)
Other (18.51%) Other (16.88%)
Other (14.56%)
Enteric bacteria cluster (0.85%)
Enteric bacteria cluster (3.77%) Enteric bacteria cluster (4.89%) Enteric bacteria cluster (5.12%)
Clinical and Experimental Gastroenterology downloaded from https://www.dovepress.com/ by 118.70.13.36 on 20-Aug-2020
Dovepress
soldi et al
three groups were mainly found in the negative correlations identified among the different genera and families, rather than specific positive correlations.
The ratio of Firmicutes/Bacteroidetes, shown in Fig-ure 7 and calculated as approximate representation of microbiota composition, was of particular interest in IBS subjects.39 Comparison of the means of this ratio between sampling groups or subjects did not show significant differences, as already shown by RT-PCR. However, a larger dispersal of values for the HS and IBS subjects at T0 was observed in particular compared to T14, indi-cating an overall condensation around low ratio values, following the treatment with rifaximin (Figure 7). At T14, Firmicutes components displayed a slight increase, after the treatment, whereas Bacteroidetes group pre-sented a definitely more important increase in their relative abundance, as shown in Figure 2A (pie chart of bacterial families). At T56, the picture obtained from Firmicutes/Bacteroidetes investigation could be interpreted as intermediate between T0 and T14. The level of Bacteroi-detes presented a progressive increase at the three different time points following rifaximin treatment (Figure 2A).
0.5
0.5
RDA1 (30.3%) T0
T14
T56
RDA2 (22.4%)
1.0 0.0
0.0 −0.5
−0.5 −1.0
T0
S001 S002 S003 S004 S005 S006 S007 S008 S009 S010 S011 S012 S013 S014 S015 T14
T56
Figure 4 Distance-based redundancy analysis (rDa) showing the combined effect of subject and sampling time on the composition of the bacterial communities.
Notes: The total variance explained by the model along with its partition into the model components are reported in the plot above. Model explained variance: 68.6% (P=0.005) of total: subject variance 94.3% (P=0) of explained, time variance 5.7% (P=0.028) of explained. T0: baseline; T14: at the end of 14 days of treatment; T56: at the end of the 6-week follow-up period.
Abbreviation: s, subject.
40 HS
T0 T14 T56
IBS 16.18
18.22 15.89 15.77 16.64
30
20
10
HS T0 T14 T56
Group
Simpson’s
D
Mean D
Figure 3 Boxplots of diversity index (simpson’s D) grouped according to samplings and non-constipated iBs/hs subjects.
Notes: Thecorresponding mean values and also the mean values of the iBs- associated sampling groups are also provided on the top right-hand side. T0: baseline; T14: at the end of 14 days of treatment; T56: at the end of the 6-week follow-up period.
Abbreviations: iBs,irritable bowel syndrome; hs, healthy subjects.
Peptostreptococcaceae IS cluster; the Veillonella, Escherichia cluster (formed mainly due to common negative associations); and the Dialister, Subdoligranulum, Faecalibacterium, Pre-votella, Bacteroides along with the cluster of more rare taxa. Differences in the correlation of the taxa participating in the
Clinical and Experimental Gastroenterology downloaded from https://www.dovepress.com/ by 118.70.13.36 on 20-Aug-2020
Dovepress non-constipated iBs subjects treated with rifaximin
The condensation of the ratio around low values at T14 could be partially explained by the decrease of Clostridium spp. (belonging to Firmicutes phylum) that are highly sensi-tive to rifaximin antibacterial activity.
archaea
Almost all retrieved sequences (99.9%) were classi-fied up to the family–genus level. The vast majority of the archaeal dataset sequences were classified in the Methanobrevibacter genus with the representative sequence of the dominant OTU being phylogenetically affiliated to Methanobrevibacter smithii. No particular grouping of the samples was obtained according to the taxonomy analysis.
No differences were observed between HS and IBS patients (T0) and no modifications were induced by the rifaximin treatment.
Discussion
Epidemiological, physiological, and clinical data support bacteria as a key player in IBS ethiopathogenesis.40,41 Studies taking advantage of the new molecular biology techniques have highlighted distinct differences in the quality, quantity, and temporal stability of the gut microbiota in IBS patients when compared to HS.4–8
Modifications of the gut microbiota were also reported in IBS patients with an imbalance of Firmicutes/Bacteroidetes ratio that is likely to have an impact on gas and metabolite
Otu0024
A T56
T14 T0 HS
Otu0023 Otu0022 Otu0021 Otu0020 Otu0019 Otu0018 Otu0017 Otu0016 Otu0015 Otu0014 Otu0013 Otu0012 Otu0011 Otu0010 Otu0009 Otu0008 Otu0007 Otu0006 Otu0005 Otu0004 Otu0003 Otu0002 Otu0001
0 4 8 12
%
Figure 5 (Continued)
Clinical and Experimental Gastroenterology downloaded from https://www.dovepress.com/ by 118.70.13.36 on 20-Aug-2020
Dovepress
soldi et al
production such as short chain fatty acids, thus on gut motil-ity and bloating.42
While the gut microbiota is highly variable between individuals,41 most of the studies reported an increase of Enterobacteriaceae in IBS patients associated with a decrease of Lactobacilli and F. prausnitzii.2–4
This latter phenomenon could have negative reflections, as F. prausnitzii was shown to have significant anti-inflammatory activity.43
In our study, all the results, obtained with different molecular techniques, pointed out that rifaximin treatment did not affect the overall composition of the core microbiota Figure 5 Pairwise comparisons according to treatment and time.
Notes: (A)hs, T0, T14, T56 for dominant OTUs; (B) Taxonomic lineages of the OTUs displayed in the bar plot (A), accounting for a participation of at least 1% in the analyzed samples. T0: baseline; T14: at the end of 14 days of treatment; T56: at the end of the 6-week follow-up period. letters ‘a’ and ‘b’ are used to indicate the groups of significance according to the performed pairwise comparisons test. ‘ab’ show that no statistically significant differences were shown between the particular sample group and the sample groups classified in ‘a’ or ‘b’. The data in bold show the OTUs showing differential abundance between treatments.
Abbreviations: OTUs,operational taxonomic units; hs, healthy subjects.
Size B
Taxonomy
Bacteria(100); Firmicutes(100); Clostridia(100); Clostridiales(100); Ruminococcaceae(100); Faecalibacterium(100)
Bacteria(100); Proteobacteria(100); Gammaproteobacteria(100); Enterobacteriales(100); Enterobacteriaceae(100); Enteric_Bacteria_cluster(100); Escherichia(100)
Otu0010
Bacteria(100); Actinobacteria(100); Actinobacteria(100); Actinobacteridae(100); Bifidobacteriales(100); Bifidobacteriaceae(100); Bifidobacterium(100)
Otu0002
Otu0016 12866
Otu0017 12339
Otu0020 11462 OTU
Otu0003 42466 Bacteria(100); Bacteroidetes(100); Bacteroidia(100); Bacteroidales(100); Bacteroidaceae(100); Bacteroides(100) 65495
Otu0001 102862 Bacteria(100); Firmicutes(100); Clostridia(100); Clostridiales(100); Lachnospiraceae(100); Roseburia(100)
Bacteria(100); Firmicutes(100); Clostridia(100); Clostridiales(100); Ruminococcaceae(100); Incertae_Sedis(100) 32368
Otu0005
Otu0006 28183
27143
Bacteria(100); Firmicutes(100); Clostridia(100); Clostridiales(100); Lachnospiraceae(100); Anaerostipes(100) 36654
Otu0004
Otu0007 Bacteria(100); Firmicutes(100); Clostridia(100); Clostridiales(100); Lachnospiraceae(100); Incertae_Sedis(100)
Otu0008 22359 Bacteria(100); Firmicutes(100); Clostridia(100); Clostridiales(100); Lachnospiraceae(100); Blautia(100)
Bacteria(100); Bacteroidetes(100); Bacteroidia(100); Bacteroidales(100); Rikenellaceae(100); Alistipes(100) 21207
Otu0009
19968 Bacteria(100); Firmicutes(100); Clostridia(100); Clostridiales(100); Lachnospiraceae(100); Roseburia(100)
19505
Otu0011 Bacteria(100); Firmicutes(100); Clostridia(100); Clostridiales(100); Veillonellaceae(100); Dialister(100)
Bacteria(100); Firmicutes(100); Clostridia(100); Clostridiales(100); Lachnospiraceae(100); Incertae_Sedis(100) 18242
Otu0012
16769 Otu0013
Bacteria(100); Firmicutes(100); Clostridia(100); Clostridiales(100); Veillonellaceae(100); Dialister(100) 15824
Otu0014
Bacteria(100); Firmicutes(100); Clostridia(100); Clostridiales(100); Lachnospiraceae(100); Incertae_Sedis(100) 14005
Otu0015
Bacteria(100); Firmicutes(100); Bacilli(100); Lactobacillales(100); Streptococcaceae(100); Streptococcus(100)
Bacteria(100); Firmicutes(100); Clostridia(100); Clostridiales(100); Lachnospiraceae(100); Blautia(100)
Bacteria(100); Bacteroidetes(100); Bacteroidia(100); Bacteroidales(100); Rikenellaceae(100); Alistipes(100) 12228
Otu0018
Bacteria(100); Firmicutes(100); Clostridia(100); Clostridiales(100); Lachnospiraceae(100); Incertae_Sedis(100) 11554
Otu0019
Bacteria(100); Firmicutes(100); Clostridia(100); Clostridiales(100); Peptostreptococcaceae(100); Incertae_Sedis(100)
Bacteria(100); Firmicutes(100); Clostridia(100); Clostridiales(100); Lachnospiraceae(100); Incertae_Sedis(100) 11395
Otu0021
Bacteria(100); Firmicutes(100); Clostridia(100); Clostridiales(100); Veillonellaceae(100); Phascolarctobacterium(100) 11312
Otu0022
Bacteria(100); Firmicutes(100); Clostridia(100); Clostridiales(100); Ruminococcaceae(100); Oscillibacter(100) 10890
Otu0023
Bacteria(100); Bacteroidetes(100); Bacteroidia(100); Bacteroidales(100); Prevotellaceae(100); Prevotella(100) 10525
Otu0024
Clinical and Experimental Gastroenterology downloaded from https://www.dovepress.com/ by 118.70.13.36 on 20-Aug-2020
Dovepress non-constipated iBs subjects treated with rifaximin
of the treated subjects but caused, instead, fluctuations in few bacterial groups, that were balanced by the replacement of disappeared species by homologs or complementary bacterial groups, harboring similar characteristics.
Rifaximin appeared to influence mainly potentially detrimental bacteria, such as Clostridium besides Peptostreptococcaceae and Escherichia. On the other hand, a 14-day treatment with rifaximin seemed to increase the presence of bacteria such as F. prausnitzii, increasingly recognized as able to positively impact on physiological functions and homeostasis of the gut by producing butyrate and inducing anti-inflammatory processes.44
As reported in recent literature, the majority of the IBS subjects had an altered intestinal microbiota, when com-pared with healthy controls, but some of the IBS samples presented no abnormalities in their microbiota composition.45 Therefore, there is an extreme variability in the composition of IBS-subtypes microbiota with a consequent difficulty in identifying common traits among subjects, as confirmed by our study.
The results of our study evidenced a decrease in the Firmi-cutes/Bacteroidetes ratio at T14 compared with those detected in HS and at T0 in IBS patients. Furthermore, as shown by high-throughput sequencing and inferred by DGGE, bacterial profiles with higher biodiversity were observed in samples collected during the follow-up to rifaximin treatment (T56), compared to T0 and T14 (Figure 2A, B and Figure 7). How-ever, these data did not reach a statistical significance, due, likely, to the limited sample size and the high inter-individual variability.
During the last decades, some works have tried to iden-tify possible relationships existing between the presence of methanogens and specific human diseases (colorectal can-cers, inflammatory bowel disease, IBS, obesity, constipation), investigating the role of Archaea but no consistent link has been established between these diseases and methanogens. The high presence of M. smithii has been linked to bacteria46,47 and enterotypes48 detectable in adults, suggesting the non-specific and symbiotic interaction of methanogens with other members of gut microbiota. The prevalence of M. smithii was Table 3 OTUs shared among all core bacteriomes, as identified by the core bacteriome analysis of the samples belonging to healthy and iBs subjects
HS T0 T14 T56 Seq # out of 1,040,300 Taxonomic lineage (bootstrap confidence)
Otu0001 1 1 1 1 102862 Bacteria(100);Firmicutes(100);Clostridia(100);Clostridiales(100);
lachnospiraceae(100);roseburia
Otu0002 1 1 1 1 65495 Bacteria(100);Firmicutes(100);Clostridia(100);Clostridiales(100);
ruminococcaceae(100);Faecalibacterium
Otu0003 1 1 1 1 42466 Bacteria(100);Bacteroidetes(100);Bacteroidia(100);Bacteroidales
(100);Bacteroidaceae(100);Bacteroides
Otu0005 1 0 0 0 32368 Bacteria(100);Firmicutes(100);Clostridia(100);Clostridiales(100);
ruminococcaceae(100);incertae_sedis
Otu0006 1 1 1 1 28183 Bacteria(100);Firmicutes(100);Clostridia(100);Clostridiales(100);
lachnospiraceae(100);Anaerostipes
Otu0007 1 1 1 1 27413 Bacteria(100);Firmicutes(100);Clostridia(100);Clostridiales(100);
lachnospiraceae(100);incertae_sedis
Otu0008 1 1 1 0 22359 Bacteria(100);Firmicutes(100);Clostridia(100);Clostridiales(100);
lachnospiraceae(100);Blautia
Otu0009 0 1 0 0 21207 Bacteria(100);Bacteroidetes(100);Bacteroidia(100);Bacteroidales
(100);rikenellaceae(100);Alistipes
Otu0010 0 1 0 0 19968 Bacteria(100);Firmicutes(100);Clostridia(100);Clostridiales(100);
lachnospiraceae(100);roseburia
Otu0015 1 1 0 0 14005 Bacteria(100);Firmicutes(100);Clostridia(100);Clostridiales(100);
lachnospiraceae(100);incertae_sedis
Otu0016 1 0 0 0 12866 Bacteria(100);Firmicutes(100);Bacilli(100);lactobacillales(100);st
reptococcaceae(100);Streptococcus
Otu0017 1 1 0 0 12339 Bacteria(100);Firmicutes(100);Clostridia(100);Clostridiales(100);
lachnospiraceae(100);Blautia
Otu0023 1 0 0 0 10890 Bacteria(100);Firmicutes(100);Clostridia(100);Clostridiales(100);
ruminococcaceae(100);Oscillibacter
Otu0028 1 0 0 0 9568 Bacteria(100);Firmicutes(100);Clostridia(100);Clostridiales(100);
ruminococcaceae(100);subdoligranulum
Otu0033 1 0 0 0 8173 Bacteria(100);Firmicutes(100);Clostridia(100);Clostridiales(100);
lachnospiraceae(100);incertae_sedis
13 10 6 5 number of shared OTUs
Notes: T0: baseline; T14: at the end of 14 days of treatment; T56: at the end of the 6-week follow-up period.
Abbreviations: OTUs, operational taxonomic units; iBs, irritable bowel syndrome; seq, sequence; hs, healthy subjects.
Clinical and Experimental Gastroenterology downloaded from https://www.dovepress.com/ by 118.70.13.36 on 20-Aug-2020
Dovepress
soldi et al
Bacteroides Prevotella
Other
Faecalibacteriu
m
Subdoligranulu
m
Dialiste
r
Escherichia Veillonell
a
Peptostreptococcaceae
IS
Roseburia
Blautia
Lachnospiraceae
IS
Bifidobacteriu
m
Clostridium Oscillibacte
r
Alistipes
Ruminococcaceae
IS
unc
Ruminococcaceae
Bacteroides
Prevotella Other
Faecalibacterium Subdoligranulum Dialister Escherichia Veillonella
IS Peptostreptococcaceae
Roseburia Blautia
IS Lachnospiraceae
Bifidobacterium Clostridium Oscillibacter Alistipes
IS Ruminococcaceae unc Ruminococcaceae –0.5 0 0.5
Value
Color key and histogram
0
150
Count
Figure 6 spearman’s rank correlation test between bacterial taxonomical annotations followed by hierarchical clustering of the obtained correlation values.
Abbreviations: IS, incertae sedis; Unc, unclassified.
60
50
0.15 Overall
HS T0 T14 T56
0.10
0 20 40
Firmicutes/Bacteroidetes
Firmicutes/Bacteroidetes
Density
60
HS T0 T14 T56
0.05
0.00 40
30
20
10
0
Figure 7 Firmicutes/Bacteroidetes ratio box-plot (left) and density plot (right).
Notes: The box-plot provides the median values obtained from the samples according to the collection moment. T0: baseline; T14: at the end of 14 days of treatment; T56: at the end of the 6-week follow-up period.
Abbreviation: hs,healthy subjects.
Clinical and Experimental Gastroenterology downloaded from https://www.dovepress.com/ by 118.70.13.36 on 20-Aug-2020
Dovepress non-constipated iBs subjects treated with rifaximin
well demonstrated in our study, but a significant difference in Archaea population among the subjects and during the study was not observed. This could be linked to several reasons: first, methanogenic Archaea are mainly known as insensi-tive to most of the antibiotics commonly used in human therapies49,50 because of the composition of their membrane and cell wall and, second, although methane is detected in 30%–50% of the healthy adult population worldwide, its production has been epidemiologically and clinically associ-ated with constipation relassoci-ated diseases such as constipation- predominant IBS and chronic constipation.
Our study was conducted on non-C IBS subjects; this could have deeply influenced the possibility to detect signifi-cant changes in the Archaea population. Moreover, the role of its members, beneficial or deleterious, is still remaining to be determined.
It could be concluded that rifaximin did not induce radical changes in the microbiota composition of the subjects, but stimulated microbial reorganization in some populations toward a more diverse composition in terms of species/OTUs, harbor-ing similar metabolic pathways or fillharbor-ing the same niche, in particular among short chain fatty acids producing bacteria.
In this regard, our findings on IBS subjects were in agree-ment with Maccaferri et al,51 who concluded that alternative mechanisms of action not involving a direct bactericidal activity could explain the efficacy of rifaximin: for example, the alteration of virulence factors of enteric bacteria and the reduction of pathogen adhesion and internalization to intes-tinal epithelium.52,53 Moreover, rifaximin activates the human pregnane X receptor, resulting in upregulation of host detoxi-fication mechanisms and regulation of inflammatory processes that may modulate host response to dysbiosis.54,55
A short course of rifaximin leads to sustained improve-ment of IBS symptoms; the antibiotic effect of rifaximin is the presumed mechanism for its sustained beneficial effects, even if the precise mechanism by which rifaximin is effective in the treatment of non-C IBS adults is unknown. However, based on current in vitro and in vivo data, there are some plausible explanations for rifaximin’s clinical efficacy in IBS.56
The response to rifaximin therapy was correlated with normalization of the results of lactulose hydrogen breath tests. Due to the limited sample size and the absence of a control group, it was not possible to speculate on differ-ences of fecal microbiota modification between responders vs non-responders and to correlate the quali-/quantitative modification of upper GI microbiota and clinical response. The culture and molecular analysis of jejunal aspirates, if
available, instead of fecal culture could probably have high-lighted a possible correlation between rifaximin efficacy on SIBO and a quali-/quantitative modification of upper GI microbiota. In spite of the small sample size and the high variability between subjects, this is one of the first studies evaluating the modifications of intestinal microbiota in IBS patients after an antibiotic treatment.
Our results are also in agreement with the preliminary data of Pimentel et al57 demonstrating, in a higher sample size that, during repeat treatment with rifaximin, no sus-tained disturbance of the stool microbiota was observed in non-C IBS subjects, who experienced persistent symptom improvement.58
Moreover, rifaximin acts similarly in other pathologies such as hepatic encephalopathy: in fact, it was effective in patients with hepatic encephalopathy, inducing only a modest change in stool microbiota composition.59–61
In conclusion rifaximin is efficacious without inducing dramatic shifts in the fecal microbiota composition.
Acknowledgments
This work was supported by Alfa Wassermann SpA. We wish to thank the staff of the Gemelli Hospital in Rome, the Microbiology Institute of Microbiology at the Catholic University in Piacenza and the sequencing center Fasteris SA, in Plan-les-Ouates, Switzerland. We also acknowledge Alfa Wassermann SpA. for its support to the whole study.
Disclosure
Dr Calanni, Dr Fogli, and Dr Grimaldi report being employ-ees of Alfa Wassermann SpA. The other authors report no conflicts of interest in this work.
References
1. Read NW. Irritable Bowel Syndrome. In: Feldman J, Friedman LS, Sleisenger MH, Sleisenger and Fordtran’s, editors. Gastrointestinal and
Liver Disease: Pathophysiology/Diagnosis/Management. Philadelphia:
Saunders; 2002:1794–1806.
2. Carroll IM, Ringel-Kulka T, Siddle JP, Ringel Y. Alterations in composi-tion and diversity of the intestinal microbiota in patients with diarrhea-predominant irritable bowel syndrome. Neurogastroenterol Motil. 2012;24(6):521–530.
3. Si JM, Yu YC, Fan YJ, Chen SJ. Intestinal microecology and quality of life in irritable bowel syndrome patients. World J Gastroenterol. 2004; 10(12):1802–1805.
4. Malinen E, Rinttilä T, Kajander K, et al. Analysis of the fecal microbiota of irritable bowel syndrome patients and healthy controls with real-time PCR. Am J Gastroenterol. 2005;100(2):373–382.
5. Bradley HK, Wyatt GM, Bayliss CE, Hunter JO. Instability in the faecal flora of a patient suffering from food-related irritable bowel syndrome.
J Med Microbiol. 1987;23(1):29–32.
Clinical and Experimental Gastroenterology downloaded from https://www.dovepress.com/ by 118.70.13.36 on 20-Aug-2020
Dovepress
soldi et al
6. Mättö J, Maunuksela L, Kajander K, et al. Composition and temporal stability of gastrointestinal microbiota in irritable bowel syndrome – a longitudinal study in IBS and control subjects. FEMS Immunol Med
Microbiol. 2005;43(2):213–222.
7. Kassinen A, Krogius-Kurikka L, Mäkivuokko H, et al. The fecal microbiota of irritable bowel syndrome patients differs significantly from that of healthy subjects. Gastroenterology. 2007;133(1):24–33. 8. Maukonen J, Mättö J, Satokari R, Söderlund H, Mattila-Sandholm T,
Saarela M. PCR DGGE and RT-PCR DGGE show diversity and short-term temporal stability in the Clostridium coccoides-Eubacterium rectale group in the human intestinal microbiota. FEMS Microbiol
Ecol. 2006;58(3):517–528.
9. Codling C, O’Mahony L, Shanahan F, Quigley EM, Marchesi JR. A molecular analysis of fecal and mucosal bacterial communities in irritable bowel syndrome. Dig Dis Sci. 2010;55(2):392–397. 10. Krogius-Kurikka L, Lyra A, Malinen E, et al. Microbial community
analysis reveals high level phylogenetic alterations in the overall gastrointestinal microbiota of diarrhoea-predominant irritable bowel syndrome sufferers. BMC Gastroenterol. 2009;9:95.
11. Lyra A, Rinttilä T, Nikkilä J, et al. Diarrhoea-predominant irri-table bowel syndrome distinguishable by 16S rRNA gene phylotype quantification. World J Gastroenterol. 2009;15(47):5936–5945. 12. Gillis JC, Brogden RN. Rifaximin. A review of its antibacterial
activity, pharmacokinetic properties and therapeutic potential in conditions mediated by gastrointestinal bacteria. Drugs. 1995;49(3): 467–484.
13. Pimentel M, Lembo A, Chey WD, et al. Rifaximin therapy for patients with irritable bowel syndrome without constipation. N Engl J Med. 2011;364(1):22–32.
14. Peralta S, Cottone C, Doveri T, Almasio PL, Craxi A. Small intes-tine bacterial overgrowth and irritable bowel-syndrome-related symptoms: experience with rifaximin. World J Gastroenterol. 2009; 15(21):2628–2631.
15. Yang J, Lee HY, Low K, Chatterjee S, Pimentel M. Rifaximin versus other antibiotics in the primary treatment and retreatment of bacterial overgrowth in IBS. Dig Dis Sci. 2008;53(1):169–174.
16. Scarpellini E, Gabrielli M, Lauritano CE, et al. High dose Rifaximin for the treatment of small intestinal bacterial overgrowth. Aliment
Pharmacol Ther. 2007;25(7):781–786.
17. Pimentel M, Park S, Mirocha J, Kane SV, Kong Y. The effect of a non-absorbed oral antibiotic (Rifaximin) on the symptoms of the irritable bowel syndrome: a randomized trial. Ann Intern Med. 2006; 145(8):557–563.
18. Sharara AI, Aoun E, Abdul-Baki H, Mounzer R, Sidani S, Elhajj I. A randomized double-blind placebo-controlled trial of Rifaximin in patients with abdominal bloating and flatulence. Am J Gastroenterol. 2006;101(2):326–333.
19. Di Stefano M, Strocchi A, Malservisi S, Veneto G, Ferrieri A, Corazza GR. Non-absorbable antibiotics for managing intestinal gas produc-tion and gas-related symptoms. Aliment Pharmacol Ther. 2000; 14(8):1001–1008.
20. Lauritano EC, Gabrielli M, Lupascu A, et al. Rifaximin dose-finding study for the treatment of small intestinal bacterial overgrowth. Aliment
Pharmacol Ther. 2005;22(1):31–35.
21. Lauritano EC, Gabrielli M, Scarpellini E, et al. Antibiotic therapy in small intestinal bacterial overgrowth: Rifaximin versus metronidazole.
Eur Rev Med Pharmacol Sci. 2009;13(2):111–116.
22. Rezaie A, Nikfar S, Abdollahi M. The place of antibiotics in management of irritable bowel syndrome: a systematic review and meta- analysis.
Arch Med Sci. 2010;6(1):49–55.
23. Thompson WG, Longstreth GF, Drossman DA, Heaton KW, Irvine EJ, Müller-Lissner SA. Functional bowel disorders and functional abdomi-nal pain. Gut. 2009;45 Suppl 2:II43–II47.
24. Haarman M, Knol J. Quantitative real-time PCR assays to identify and quantify fecal Bifidobacterium species in infants receiving a prebiotic infant formula. Appl Environ Microbiol. 2005;71(5): 2318–2324.
25. Bartosch S, Fite A, Macfarlane GT, McMurdo ME. Characterization of bacterial communities in feces from healthy elderly volunteers and hospitalized elderly patients by using real-time PCR and effects of antibiotic treatment on the fecal microbiota. Appl Environ Microbiol. 2004;70(6):3575–3581.
26. Guo X, Xia X, Tang R, Zhou J, Zhao H, Wang K. Development of a real-time PCR method for Firmicutes and Bacteroidetes in faeces and its application to quantify intestinal population of obese and lean pigs.
Lett Appl Microbiol. 2008;47(5):367–373.
27. Heilig HG, Zoetendal EG, Vaughan EE, Marteau P, Ahhermans AD, de Vos WM. Molecular diversity of Lactobacillus spp. and other lactic acid bacteria in the human intestine as determined by specific amplification of 16S ribosomal DNA. Appl Environ Microbiol. 2002; 68(1):114–123.
28. Maidak BL, Olsen GJ, Larsen N, Overbeek R, McCaughey MJ, Woese CR. The RDP (Ribosomal Database Project). Nucleic Acids Res. 1997;25(1):109–111.
29. Berry D, Mahfoudh KB, Wagner M, Loy A. Barcoded primers used in multiplex amplicon pyrosequencing bias amplification. Appl Environ
Microbiol. 2011;77(21):7846–7849.
30. Vasileiadis S, Puglisi E, Trevisan M, et al. Changes in soil bacterial communities and diversity in response to long-term silver exposure.
FEMS Microbiol Ecol. Epub 2015 Sep 20.
31. Masella A, Bartram A, Truszkowski J, Brown DG, Neufeld JD. PANDAseq: paired-end assembler for illumina sequences. BMC
Bioinformatics. 2012;13:31.
32. Schloss PD, Westcott SL, Ryabin T, et al. Introducing mothur: open-source, platform-independent, community-supported software for describing and comparing microbial communities. Appl Environ
Microbiol. 2009;75(23):7537–7541.
33. R Development Core Team. R: A language and environment for sta-tistical computing, reference index version 2.14.1. R Foundation for
Statistical Computing. 2011.
34. Dixon P. VEGAN, a package of R functions for community ecology.
J Veg Sci. 2003;14(6):927–930.
35. Gihring TM, Green SJ, Schadt CW. Massively parallel rRNA gene sequencing exacerbates the potential for biased community diversity comparisons due to variable library sizes. Environ Microbiol. 2011; 14(2):285–290.
36. Heip CHR, Herman PMJ, Soetaert K. Indices of diversity and evenness.
Oceanis. 1998;24(4):61–87.
37. White JR, Nagarajan N, Pop M. Statistical methods for detecting dif-ferentially abundant features in clinical metagenomic samples. PLoS
Comput Biol. 2009;5(4):e1000352.
38. Stamatakis A. RAxML-VI-HPC: maximum likelihood-based phyloge-netic analyses with thousands of taxa and mixed models. Bioinformatics. 2006;22(21):2688–2690.
39. Mariat D, Firmesse O, Levenez F, et al. The Firmicutes/Bacteroidetes ratio of the human microbiota changes with age. BMC Microbiology. 2009;9:123.
40. Spiller RC. Post infectious irritable bowel syndrome. Gastroenterology. 2003;124(6):1662–1671.
41. Lin HC. Small intestinal bacterial overgrowth: a framework for under-standing irritable bowel syndrome. JAMA. 2004;292(7):852–858. 42. Rajilić-Stojanović M, Biagi E, Heilig HG, et al. Global and deep
molecu-lar analysis of microbiota signatures in fecal samples from patients with irritable bowel syndrome. Gastroenterology. 2011; 141(5):1792–1801. 43. Lozupone CA, Stombaugh JI, Gordon JI, Jansson JK, Knight R.
Diversity, stability and resilience of the human gut microbiota. Nature. 2012;489(7415):220–230.
44. Sokol H, Pigneur B, Watterlot L, et al. Faecalibacterium prausnitzii is an anti-inflammatory commensal bacterium identified by gut microbiota analysis of Crohn disease patients. Proc Natl Acad Sci U S A. 2008; 105(43):16731–16736.
45. Jeffery IB, O’Toole PW, Öhman L, et al. An irritable bowel syndrome subtype defined by species-specific alterations in faecal microbiota.
Gut. 2012;61(70):997–1006.
Clinical and Experimental Gastroenterology downloaded from https://www.dovepress.com/ by 118.70.13.36 on 20-Aug-2020
Dovepress non-constipated iBs subjects treated with rifaximin
46. Gaci N, Borrel G, Tottey W, O’Toole PW, Brugére JF. Archaea and the human gut: new beginning of an old story. World J Gastroenterol. 2014;20(43):16062–16078.
47. Hoffmann C, Dollive S, Grunberg S, et al. Archaea and fungi of the human gut microbiome: correlations with diet and bacterial residents.
PLoS One. 2013;8(6):e66019.
48. Arumugam M, Raes J, Pelletier E, et al. Enterotypes of the human gut microbiome. Nature. 2011;473(7346):174–180.
49. Dridi B, Fardeau ML, Ollivier B, Raoult D, Drancourt M. The anti-microbial resistance pattern of cultured human methanogens reflects the unique phylogenetic position of archaea. J Antimicrob Chemother. 2011;66(9):2038–2044.
50. Kandler O, König H. Cell wall polymers in Archaea (Archaebacteria).
Cell Mol Life Sci. 1998;54(4):305–308.
51. Maccaferri S, Vitali B, Klinder A, et al. Rifaximin modulates the colonic microbiota of patients with Crohn’s disease: an in vitro approach using a continuous culture colonic model system. J Antimicrob Chemother. 2010;65(12):2556–2565.
52. Jiang ZD, Ke S, Dupont HL. Rifaximin-induced alteration of virulence of diarrhoea-producing Escherichia coli and Shigella sonnei. Int J
Antimicrob Agents. 2010;35(3):278–281.
53. Brown EL, Xue Q, Jiang ZD, Xu Y, Dupont HL. Pretreatment of epithe-lial cells with rifaximin alters bacterial attachment and internalization profiles. Antimicrob Agents Chemother. 2010;54(1):388–396. 54. Fiorucci S, Distrutti E, Mencarelli A, Barbanti M, Palazzini E, Morelli A.
Inhibition of intestinal bacterial translocation with Rifaximin modulates lamina propria monocytic cells reactivity and protects against inflam-mation in a rodent model of colitis. Digestion. 2002;66(4):246–256.
55. Cheng J, Shah YM, Ma X, et al. Therapeutic role of rifaximin in inflammatory bowel disease: clinical implication of human pregnane X receptor activation. J Pharmacol Exp Ther. 2010;335(1):32–41. 56. Calanni F, Renzulli C, Barbanti M, Viscomi GC. Rifaximin: beyond
the traditional antibiotic activity J. Antibiot (Tokyo). 2014;67(9): 667–670.
57. Pimentel M, Fodor AA, Golden P, Bortey E, Forbes WP. Mo1268 Characterization of Stool Microbiota in Subjects With IBS-D Receiving Repeat Treatments With Rifaximin in the TARGET 3 Study.
Gastroenterology. 2015;148(4) Suppl 1:S-655.
58. Lacy BE, Pimentel M, Chang L, et al. Mo1269 Enduring Effects Follow-ing a Course of Rifaximin Therapy in Patients With IBS-D: Incremental Benefit Upon Repeat Treatment. Gastroenterology. 2015;148(4) Suppl 1: S-655.
59. Bajaj JS, Heuman DM, Sanyal AJ, et al. Modulation of the metabiome by rifaximin in patients with cirrhosis and minimal hepatic encephalopathy.
PLoS One. 2013;8(4):e60042.
60. Kalambokis GN, Mouzaki A, Rodi M, et al. Rifaximin improves systemic hemodynamics and renal function in patients with alcohol-related cir-rhosis and ascites. Clin Gastroenterol Hepatol. 2012;10(7):815–818. 61. Kakiyama G, Pandak WM, Gillevet PM, et al. Modulation of the
fecal bile acid profile by gut microbiota in cirrhosis. J Hepatol. 2013; 58(5):949–955.
Clinical and Experimental Gastroenterology downloaded from https://www.dovepress.com/ by 118.70.13.36 on 20-Aug-2020