Clinical Pharmacology: Advances and Applications 2019:11 39–50
Clinical Pharmacology: Advances and Applications
Dove
press
submit your manuscript | www.dovepress.com 39
O r i g i n A l r e s e A r C h
open access to scientific and medical research
Open Access Full Text Article
Modeling and simulation of the endogenous
CYP3A induction marker 4
β
-hydroxycholesterol
during enasidenib treatment
Yan li1
Jamie n Connarn1
Jian Chen2
Zeen Tong2
Maria Palmisano1
simon Zhou1
1Translational Development and Clinical Pharmacology, Celgene Corporation, summit, nJ, UsA; 2non-Clinical Development, Celgene Corporation, summit, nJ, UsA
Background:Enasidenib (IDHIFA®, AG-221) is a first-in-class, targeted inhibitor of mutant IDH2
proteins for treatment of relapsed or refractory acute myeloid leukemia. This was a Phase I/II study evaluating safety, efficacy, and pharmacokinetics/pharmacodynamics (PK/PD) of orally admin-istered enasidenib in subjects with advanced hematologic malignancies with an IDH2 mutation. Methods: Blood samples for PK and PD assessment were collected. A semi-mechanistic non-linear mixed effect PK/PD model was successfully developed to characterize enasidenib plasma PK and to assess enasidenib-induced CYP3A activity.
Results: The PK model showed that enasidenib plasma concentrations were adequately described by a one-compartment model with first-order absorption and elimination; the PD model showed a high capacity to induce CYP3A (Emax=7.36) and a high enasidenib plasma concentration to produce half of maximum CYP3A induction (EC50=31,400 ng/mL). Monte Carlo simulations based on the final PK/PD model showed that at 100 mg once daily dose there was significant drug accumulation and a maximum of three-fold CYP3A induction after multiple doses. Although the EC50 value for CYP3A induction by enasidenib is high, CYP3A induction was observed due to significant drug accumulation.
Conclusion: CYP3A induction following enasidenib dosing should be considered when pre-scribing concomitant medication metabolized via this pathway.
Keywords:enasidenib, modeling and simulation, CYP3A induction, 4β-hydroxycholesterol
Introduction
Acute myeloid leukemia (AML) is the most common acute leukemia affecting adults. There were an estimated 21,380 new cases of AML in the United States in 2017, and the 5-year overall survival was 26.9%.1 The isocitrate dehydrogenase (IDH) protein is a
critical enzyme family in the citric acid cycle compromising of three enzymes (IDH1, IDH2, and IDH3), which catalyze the oxidative decarboxylation of isocitrate to produce carbon dioxide and alpha-ketoglutarate.2–4 IDH1 and IDH2 mutations have been found
in patients with both solid and liquid tumors.5–9 Enasidenib (IDHIFA®, AG-221; Celgene
Corporation, Summit, NJ, USA) is a first-in-class, targeted inhibitor of mutant IDH2 proteins for treatment of relapsed or refractory AML.1,10–12 In clinical trials, enasidenib
decreased the onco-metabolite 2-HG (formed after metabolism of isocitrate by the mutated IDH2 enzyme) by 90.6%,1,10–12 and the rate of complete response/complete
response with partial hematologic recovery for patients with relapse/refractory (R/R) AML was 23%.13 The most common treatment-related treatment emergent adverse events
were indirect hyperbilirubinemia and nausea. For patients who received enasidenib 100 mg/day, the most common side effects were increased bilirubin, IDH differentiation
Correspondence: simon Zhou Translational Development and Clinical Pharmacology, Celgene Corporation, 556 Morris Avenue, summit, nJ 07920, UsA Tel +1 908 673 9284
Fax +1 908 673 2842 email [email protected]
Journal name: Clinical Pharmacology: Advances and Applications Article Designation: Original Research
Year: 2019 Volume: 11
Running head verso: Li et al Running head recto: Li et al
DOI: http://dx.doi.org/10.2147/CPAA.S192687
Clinical Pharmacology: Advances and Applications downloaded from https://www.dovepress.com/ by 118.70.13.36 on 21-Aug-2020
For personal use only.
This article was published in the following Dove Medical Press journal:
Dovepress li et al
syndrome (IDH-DS), anemia, thrombocytopenia, and tumor lysis syndrome. Grade 3–4 enasidenib-related adverse events included indirect hyperbilirubinemia and IDH-DS.1,10–14
Enasidenib pharmacokinetics (PK) has been well character-ized both in healthy subjects and in subjects with R/R AML.13–15
After a single oral dose, the median time to Cmax was 4 hours. An extensive extravascular distribution of enasidenib was dem-onstrated by a large volume of distribution, ie, 55.8 L in healthy subjects after intravenous administration. Enasidenib was extensively metabolized prior to excretion and multiple CYP and UGT enzymes were involved in metabolism of enasidenib.13
Enasidenib had a small plasma clearance (CL/F) of ~0.74 L/ hour and a long terminal half-life (t1/2) of ~137 hours in subjects with R/R AML. In vitro studies have shown that enasidenib can inhibit multiple CYP enzymes and transporters; in addition, can also induce CYP3A4.13 Because of the potential induction or
inhibition of drug metabolizing enzymes and transporters by enasidenib, coadministration of enasidenib may increase or decrease the concentrations of combined medications.
CYP3A4 is the most abundant human CYP isoform that is involved in the metabolism of approximately half of all marketed drugs;16 understanding the magnitude of
enasidenib-induced CYP3A enzyme activity could be use-ful in aiding appropriate dosage adjustments of concomitant medications. Instead of dedicated clinical studies to assess CYP3A induction or inhibition, determining kinetics of the endogenous plasma marker 4β-hydroxycholesterol has been proposed as an alternative marker for CYP3A4/5 induction or inhibition assessment.17–19 The cholesterol metabolite
4β-hydroxycholesterol is formed by CYP3A4, and plasma 4β-hydroxycholesterol rises with increasing CYP3A4 activ-ity.20 Recent study has shown that 4β-hydroxycholesterol is a
comparable marker to the probe drug midazolam for CYP3A4 induction by rifampicin.21 Diczfalusy et al showed that
treat-ment of patients with strong inducers of CYP3A enzymes, eg, antiepileptic drugs, resulted in ten-fold increased concentra-tions of plasma 4β-hydroxycholesterol, while treatment with CYP3A inhibitors such as ritonavir or itraconazole resulted in decreased plasma concentrations.17,18 By using plasma
4β-hydroxycholesterol and 4β -hydroxycholesterol/choles-terol ratio as the endogenous CYP3A induction markers, Ngaimisi et al showed that efavirenz treatment resulted in appreciable gene- and dose-dependent induction of CYP3A4 activity during antiretroviral therapy.19 The adoption of
4β-hydroxycholesterol as an endogenous CYP3A4 induc-tion biomarker is valuable since as compared with tradiinduc-tional clinical drug–drug interaction (DDI) study designs, it avoids subjecting patients to pill burden. In addition, CYP3A
induction can be investigated in the earlier stages of clinical development, such as the multiple ascending dose study.
AG221-C-001 was a Phase I/II, multicenter, open-label, dose-escalation and expansion, safety, pharmacokinetic, pharmacodynamic, and clinical activity study of orally administered enasidenib in subjects with advanced hema-tologic malignancies with an IDH2 mutation. Character-izing the PK of enasidenib and its metabolite in subjects with advanced hematologic malignancies was one of the secondary study objectives and monitoring plasma cho-lesterol and 4β-hydroxycholesterol levels as a potential CYP3A4 induction marker was one of the exploratory study objectives. Herein, we built a semi-mechanistic PK/ pharmacodynamics (PD) model to characterize enasidenib plasma PK and to assess enasidenib-induced CYP3A activ-ity by describing kinetics of endogenous plasma markers 4β-hydroxycholesterol and cholesterol.
Methods
ethics
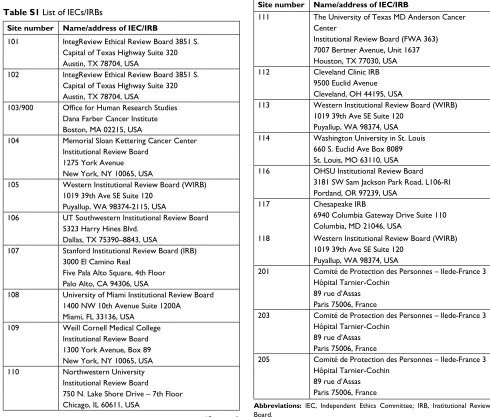
This study was conducted in accordance with the Sponsor’s standard operating procedures and working procedures, which are designed to ensure adherence to Good Clinical Practice (GCP), as denoted in the International Council for Harmonisation E6 requirements for GCP and in accordance with the ethical principles outlined in the Declaration of Helsinki. The investigator conducted all aspects of this study in accordance with applicable national, state, and local laws of the pertinent regulatory authorities. The protocol, amend-ments, and informed consent form (ICF) were reviewed and approved by each study site’s Institutional Review Board/ Independent Ethics Committee (Table S1) prior to the start of the study. Each subject was required to sign an ICF to participate in the study.
study design
Study AG221-C-001 was a Phase I/II, multicenter, open-label, three-part study which evaluated safety, efficacy, and PK/PD of orally administered enasidenib in subjects who had advanced hematologic malignancies with an IDH2 mutation. The study included three portions: a Phase I dose escalation portion, a Phase I expansion portion, and a Phase II expansion portion.
The Phase I dose escalation portion was designed to determine the maximum tolerated dose/recommended Phase II dose (MTD/RP2D) and evaluate clinical efficacy and safety of enasidenib in subjects with advanced hematologic malignancies. This portion utilized a standard “3+3” design
Clinical Pharmacology: Advances and Applications downloaded from https://www.dovepress.com/ by 118.70.13.36 on 21-Aug-2020
Dovepress li et al
and a dose of 100 mg once daily dose (QD) was selected for initial evaluation in the Phase I expansion portion. The Phase I expansion portion further evaluated the safety, tolerability, and efficacy of enasidenib in subjects with advanced hemato-logic malignancies. The Phase II expansion portion assessed efficacy of enasidenib at the RP2D and further evaluated safety in subjects with R/R AML carrying an IDH2 mutation.
In Phase I dose escalation portion, enasidenib was admin-istered orally QD at dose levels of 50, 75, 100, 150, 200, 300, 450, and 650 mg or orally twice daily (BID) at dose levels of 30, 50, 75, 100, and 150 mg on days 1–28 in 28-day cycles. In Phase I and II dose expansion portions, enasidenib was administered orally QD at a dose of 100 mg QD on Days 1–28 in 28-day cycles. Starting with Cycle 1 Day 1 (C1D1), dosing was continuous; there were no inter cycle rest periods. Phase I subjects underwent PK/PD assessments on protocol-specified study days for determination of enasidenib, 2-HG, and/or 4β-hydroxycholesterol, cholesterol concentrations. All enrolled subjects underwent safety assessments during the treatment period, including physical examination, vital signs, Eastern Cooperative Oncology Group performance status, 12 lead ECGs, evaluation of left ventricular ejection fraction, and clinical laboratory assessments (hematology, chemistry, coagulation, and pregnancy testing). Subjects continued treat-ment with enasidenib until disease progression, developtreat-ment of unacceptable toxicity, or confirmed pregnancy.
Blood collection for PK and PD analysis
To evaluate enasidenib plasma concentrations, blood samples were collected at 0, 0.5, 1, 2, 3, 4, 6, 8, 10, 24, 48, and 72 hours after single-dose administration on Day 3 (ie, 3 days prior to the start of daily dosing for safety and PK run-in) from the first 3 subjects enrolled in each dose level in Phase I dose escalation portion and the first 15 subjects enrolled in Phase I expansion portion. Blood samples were collected at 0, 0.5, 1, 2, 3, 4, 6, 8, and 10 hours after multiple-dose administration on C1D15, C2D1, C4D1, and/or C8D1 from all subjects in Phase I dose escalation and Phase I expansion portions. Predose (trough) PK samples were obtained from subjects in Phase I dose escalation and Phase I expansion portions on C1D1 (for those subjects who did not undergo the Day 3 sampling), C1D8, C1D22, C2D15, C3D1, C3D15, C5D1, and Day 1 of all cycles thereafter. Blood samples were collected on C1D1 and C2D1 at 0, 2, 4, 6, 8, and 24 hours post-dose from all subjects in Phase II expansion portion. Additional blood samples were obtained from subjects in Phase II expansion portion at predose (trough) on C3D1. In
addition, blood samples were also to be drawn at the End of Treatment (EOT) visit from all enrolled subjects.
To evaluate cholesterol and 4β-hydroxycholesterol plasma concentrations, serial blood samples were obtained at screening, at 0, 24, 48, and 72 hours post dose on Day 3; at predose on Days 1, 8, 15, and 22 of Cycle 1; at predose on Days 1 and 15 of Cycles 2 and 3; at predose on Day 1 of every cycle through at least Cycle 12, and at the EOT visit from subjects enrolled in the Phase I dose escalation and Phase I expansion portions.
Bioanalytical methodology
Enasidenib, 4β-hydroxycholesterol, and cholesterol concen-trations in the plasma samples were assessed by validated liquid chromatography–tandem mass spectrometry assays. The lower limit of quantification was 1.0, 5.0, and 25.0 ng/ mL for enasidenib, 4β-hydroxycholesterol, and cholesterol, respectively. Stable labeled enasidenib (Enasidenib-d6), 4β-hydroxycholesterol (4β-hydroxycholesterol-d7), and cholesterol (cholesterol-d7) were spiked into plasma samples as internal standards. These were subsequently processed by protein precipitation liquid–liquid extraction, and then analyzed using reverse-phase HPLC with electrospray MS/ MS detection. HPLC with a gradient of organic solvent and aqueous mobile phases was used to separate peaks.
semi-mechanistic PK/PD model
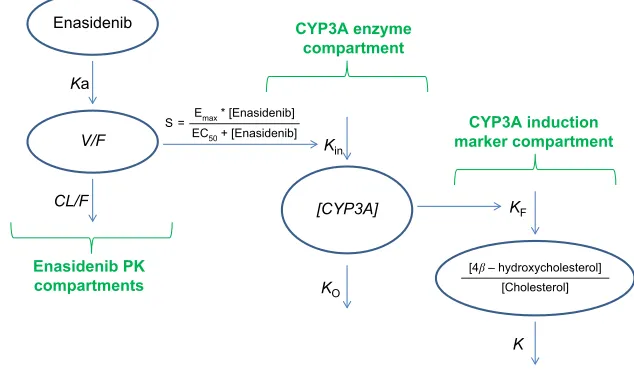
The semi-mechanistic PK/PD model characterizing ena-sidenib plasma concentrations and assessing the mag-nitude of enasidenib-induced CYP3A enzyme activity during enasidenib treatment by describing kinetics of plasma 4β-hydroxycholesterol and or 4β -hydroxycholesterol/cho-lesterol ratio is shown in Figure 1. This model consisted of three components: enasidenib plasma PK component; CYP3A enzyme component; and CYP3A induction marker (4β-hydroxycholesterol and cholesterol ratio) component.
As shown in Figure 1, a one-compartment structure PK model was fit to the enasidenib plasma concentration–time data, which included the following PK parameters: Ka (the first-order absorption rate constant), V/F (apparent central compartment volume of distribution), and CL/F (apparent plasma clearance). The final PK model was described by equations 2 and 3.
The PD model, previously proposed by Ngaimisi et al consisting of a CYP3A enzyme compartment and a CYP3A induction marker compartment to describe the CYP3A induction activity during efavirenz treatment and efavirenz/
Clinical Pharmacology: Advances and Applications downloaded from https://www.dovepress.com/ by 118.70.13.36 on 21-Aug-2020
Dovepress li et al
rifampicin co-treatment19 was tested in the present analysis
to describe the enasidenib-induced CYP3A activity during enasidenib treatment. Briefly, the CYP3A enzyme compart-ment model featured the zero-order CYP3A production rate constant (Kin) and the first-order CYP3A elimination rate constant (KO). Assuming equilibrium condition at baseline and a unit CYP3A amount at baseline, Kin was set to be equal to KO. An Emax model describing enasidenib drug effect on the CYP3A production rate constant was incorporated into the CYP3A enzyme turnover model. The final CYP3A enzyme turnover model was described by equation 4.
Similarly, the CYP3A induction marker compartment model featured the first-order 4β-hydroxycholesterol elimi-nation constant (K) and the rate of 4β-hydroxycholesterol production (d[4β-hydroxycholesterol]/dt) was dependent on the 4β-hydroxycholesterol formation rate constant (KF), the amount of the CYP3A enzyme ([CYP3A]), and the amount of cholesterol ([cholesterol]) at a given time point (described by equation 1).
d
dt K CYP A
K
F
[ ]
* *
* 4
3
4 b
b
− =
[
]
[
]
− −hydroxycholesterol
h
cholesterol
[
yydroxycholesterol]
(1)
Due to a high concentration of cholesterol compared to 4β-hydroxycholesterol and a very small rate constant of 4β-hydroxycholesterol formation, a stable cholesterol amount at a given time point was assumed. It was also assumed that cholesterol exchange between its central and peripheral pools had negligible influence on the [cholesterol] avail-able for conversion to 4β-hydroxycholesterol; therefore, the
cholesterol central pool volume was taken to be the volume of distribution for cholesterol and was assumed to be equal to the volume of distribution for 4β-hydroxycholesterol and the volume for the enzyme compartment.19 Therefore,
by dividing both sides of equation 1 with [cholesterol], an alternative simpler equation describing the rate of change in 4β-hydroxycholesterol/cholesterol ratio was obtained (described by equation 5).
Taken together, the final semi-mechanistic PK/PD model developments were based on equations 2–5.
d A
dt Ka A
( )
* 1
1
= − (2)
d A
dt Ka A
CL F
V F A
( )
* /
/ * 2
1 2
= − (3)
d CYP A
dt Kin
[ ]
* *
3
1
50
= +
[
]
+
[
]
−
E Enasidenbi EC enasidenib
max
K
KO*[CYP A3 ] (4)
d
dt K
CYP A K
F
([ ])
*
*[ 4
3 4
β
β −
=
[
]
− −hydroxycholesterol cholesterol
hyydroxycholesterol
cholersterol ]
(5)
Where
A1: the amount of enasidenib in the absorption PK compartment
A2: the amount of enasidenib in the central plasma PK compartment
Figure 1 semi-mechanistic PK/PD model.
Abbreviations:CL/F, apparent clearance; V/F, apparent volume of distribution; Ka, absorption rate constant; PD, pharmacodynamics; PK, pharmacokinetics.
Ka
CL/F V/F
KO
Kin
[CYP3A]
K KF
Enasidenib CYP3A enzyme
compartment
CYP3A induction marker compartment
Enasidenib PK compartments
S = Emax * [Enasidenib] EC50 + [Enasidenib]
[4b – hydroxycholesterol] [Cholesterol]
Clinical Pharmacology: Advances and Applications downloaded from https://www.dovepress.com/ by 118.70.13.36 on 21-Aug-2020
Dovepress li et al
Ka: the first-order enasidenib absorption rate constant
CL/F: enasidenib apparent plasma clearance
V/F: enasidenib apparent central compartment volume of distribution
[CYP3A]: amount of CYP3A enzyme (a unit CYP3A amount was assumed at the baseline)
[Enasidenib]: enasidenib plasma concentration
Emax: maximum enasidenib effect on the induction of CYP3A enzyme
EC50: the enasidenib plasma concentration to produce half of Emax effect on the induction of CY3A enzyme
Kin: the zero-order rate constant of enzyme CYP3A forma-tion (Kin was set to KO assuming equilibrium condition at the baseline and a unit CYP3A amount at the baseline)
KO: the first-order enzyme CYP3A turnover rate constant [4β-hydroxycholesterol/cholesterol]: 4β-hydroxycholesterol/ cholesterol plasma concentration ratio
KF: the rate constant of 4β-hydroxycholesterol/cholesterol ratio formation
K: the rate constant of 4β-hydroxycholesterol/cholesterol ratio elimination
non-linear mixed effect modeling and
simulation
The population PK analysis was performed using nonlinear mixed effects modeling (NONMEM) Version 7 with the first-order conditional estimation and the INTERACTION option (version 7.2; Icon Development Solutions, Ellicott City, MD, USA) was used to estimate the parameters of the semi-mechanistic PK/PD model. S-Plus (version 8.2; TIBCO Software Inc, Somerville, MA, USA) and R-based model-building aid Perl-Speaks-NONMEM (version 3.5.3; by Kajsa Harling and Andrew Hooker) software were used to perform graphic processing.
The between subject variability was modeled as an exponential random effect model to positively constrain the individual parameter values, which were thus assumed to follow a log normal distribution:
θi=θTypical • eηi
where θi is the estimated parameter for subject i, θTypical is the typical population value of the parameter, and ηi are individual-specific inter-individual random effects for individual i and assumed to be normally distributed according to h~N (0, ω2).
Residual variability was described using statistical model and the error model is described below:
ln(Cij)= ln(Cmij) +εij
with Cij and Cmij as the observed and model-predicted jth enasidenib plasma concentration or 4β-hydroxycholesterol/ cholesterol plasma ratio in the ith participant, respectively, and εij as the residual error with a mean of 0 and an SD=
sqrt(σ2).
A visual predictive check (VPC) was performed to allow visual comparison between the distributions of simulated dependent variables from the final model and those obtained from the original dataset. Based on the estimates of the final model, time profiles of enasidenib plasma concentrations or 4β-hydroxycholesterol/cholesterol ratios were simulated using 1,000 replicates. The median and 90% prediction inter-vals of the time course of enasidenib plasma concentrations or 4β-hydroxycholesterol/cholesterol ratios were computed and compared with the observed data.
In addition, a nonparametric bootstrap resampling analy-sis was performed to confirm the stability and robustness of the final population PK/PD parameters. The bootstrap technique involved resampling with replacement from the original data. Five hundred replicates of the data were gener-ated by bootstrap to obtain the median and 90% percentile of PK parameters and random effect parameters. The bias of each parameter was calculated by computing the difference between median value derived from the bootstrap and those derived with the final parameter estimate. There were an overall 99.8% of successful bootstrap runs (1 out 500 runs with minimization terminated was skipped when assessing the bootstrap evaluation).
Monte Carlo simulations
Base on the developed PK/PD structure and error model, Monte Carlo simulations were conducted to predict ena-sidenib plasma concentration and to investigate the magni-tude of enasidenib-induced CYP3A enzyme activity during enasidenib treatment after multiple 100 mg QD doses. The predicted mean and 90% CI of the mean were calculated from 500 Monte Carlo simulations.
The enasidenib-induced CYP3A activity vs time profiles at different dose levels based on the final developed PK/PD model and the efavirenz-induced CYP3A activity vs time profile under standard antiretroviral therapy based on litera-ture were simulated using Berkeley Madonna (version 8.3.18, University of California, Berkeley, CA, USA).
Results
summary of PK/PD analysis dataset
A total of 298 subjects enrolled in Phase I dose escalation, Phase I expansion, and Phase II expansion portions with 6,600 evaluable enasidenib plasma concentration records
Clinical Pharmacology: Advances and Applications downloaded from https://www.dovepress.com/ by 118.70.13.36 on 21-Aug-2020
Dovepress li et al
and a total of 36 subjects enrolled in Phase I dose escala-tion and Phase I expansion porescala-tions with 268 evaluable 4β-hydroxycholesterol and/or cholesterol plasma con-centration records were included in the final population PK/PD analysis dataset. The enasidenib, cholesterol, and 4β-hydroxycholesterol plasma concentration data collected from patients enrolled from 10 different dosing levels (30, 50, 60, 75, 100, 150, 200, 300, 450, and 650 mg) and from two different regimens (BID and QD) provided a wide PK/PD data range which enable the final PK/PD model appropriate for its intended simulation and prediction pur-pose. Table 1 summarizes the number of PK/PD subject in each dose cohort and regimen in the final PK/PD analysis population.
Time course plasma
4
β
-hydroxycholesterol and cholesterol
concentration profiles
Mean ± SD 4β-hydroxycholesterol and cholesterol plasma concentration vs time profiles are summarized in Figure 2. As shown in Figure 2, enasidenib treatment resulted in a significant increase in 4β-hydroxycholesterol plasma con-centrations from ~42.5 ng/mL at the baseline to ~300 ng/mL at the steady state, while there was no remarkable change of the cholesterol plasma concentrations during the enasidenib treatment (~822.5 and 837 µg/mL, at the baseline and at the EOT, respectively). This finding was consistent with the assumptions Ngaimisi et al made during the model building, that due to a high concentration of cholesterol compared
to 4β-hydroxycholesterol and a very small rate constant of 4β-hydroxycholesterol formation, a stable cholesterol amount at a given time point was assumed.19 Accordingly,
4β-hydroxycholesterol/cholesterol ratio was obtained and tested as one of the PD endpoints in the present analysis.
enasidenib PK model
Visual examination of the enasidenib concentration vs time profiles across different dose levels suggested that mono-exponential decline was adequate for most subjects; therefore, enasidenib concentration–time profiles were well characterized by a one-compartment model with first-order absorption and first-order elimination. Our population PK model showed that enasidenib was rapidly absorbed with a model predicted absorption rate constant of 22.10/day, a large apparent central volume of distribution (V/F) (97.7 L) indicating an extensive extravascular distribution, and a small apparent clearance of 9.39 L/day (Table 2).
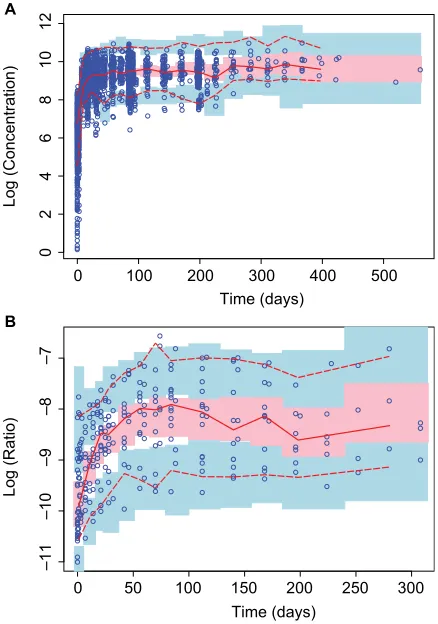
Overall, observed concentrations of enasidenib were well fitted with the population pharmacokinetics (PPK) model. This was demonstrated by the concordance between observed and predicted concentrations, which were tightly grouped along the identity line; furthermore, the distribution of conditional weighted residuals or the individually weighted residual was homogenously and evenly distributed around 0 across sampling times, the population predicted concentra-tions, or the individual predicted concentrations as depicted by the locally weighted scatterplot smoothing line, suggesting no relevant bias in the predictions of high and low concentra-tions of enasidenib (data not shown). In addition, as shown in Figure 3A, VPC evaluation demonstrated that observed median, lower 90% percentile, and upper 90th percentile of enasidenib concentrations were contained within the model-predicted ranges (shaded areas). Overall, these results confirmed the adequacy of the final population PK model in predicting enasidenib concentrations. A nonparametric boot-strap was conducted using 500 bootboot-strap samples (475 out of 500 bootstrap runs converged successfully). Results from bootstrap analyses are given in Table 2 along with NONMEM parameters. The primary PK parameters were similar between the NONMEM estimates and the bootstrap results. IIVs were similar as well. Overall, these above results (ie, VPC and bootstrap) confirm the adequacy of the final population PK model in characterizing enasidenib plasma concentrations.
Taken together, enasidenib concentrations in the natural logarithm range of 0.139–10.97 (ie, 1.15–58,400.0 ng/mL) were well characterized by the final PPK model.
Table 1 PK/PD analysis population Dose
regimen
Dose (mg) Number of PK subjects
Number of PD subjects
BiD 30 7
50 6
75 7
100 8
150 4 1
QD 50 8 4
75 7 2
100 210 15
150 6 5
200 16 4
300 9 2
450 5 3
650 5
Total 298 36
Abbreviations: BiD, twice daily dose; PD, pharmacodynamics; PK, pharmacokinetics; QD, once daily dose.
Clinical Pharmacology: Advances and Applications downloaded from https://www.dovepress.com/ by 118.70.13.36 on 21-Aug-2020
Dovepress li et al
Figure 2 Mean (± sD) 4β-hydroxycholesterol and cholesterol plasma concentration vs time profiles.
Notes: red lines and symbols represent 4β-hydroxycholesterol plasma concentration data; blue lines and symbols represent cholesterol plasma concentration data.
Time (days)
0 50 100 150
0
200
400
600
800
1,000
4
β
-hydroxycholesterol (ng/mL
)
400
600
800
1,000
1,200
1,400
1,600
Cholesterol (µg/mL
)
4β-hydroxycholesterol (ng/mL)
Cholesterol (µg/mL)
Table 2 Population pharmacokinetic estimates Population
pharmacokinetic parameters
Mean Median estimate from bootstrap
90% Bootstrap CIa
Ka (1/day) 22.10 22.13 17.37–27.34
V/F (l) 97.7 97.7 92.1–103.6
CL/F (l/day) 9.39 9.41 8.86–9.97
ω2 (Ka) 1.88 1.91 1.43–2.42
ω2 (V/F) 0.309 0.309 0.253–0.381
ω2 (Cl/F) 0.321 0.310 0.230–0.431
δ2 0.164 0.162 0.125–0.219
Note: aBootstrap Ci values were taken from bootstrap calculation.
Abbreviations: CL/F, apparent clearance; V/F, apparent volume of distribution;
Ka, absorption rate constant; σ2, variance of intra-subject variability; ω2, variance of
inter-subject variability.
enasidenib PD model
The PD model previously proposed by Ngaimisi et al,19
consisting of one CYP3A enzyme compartment and one CYP3A induction marker compartment (Figure 1), was tested in the present analysis to assess enasidenib-induced CYP3A activity during enasidenib treatment by describing kinetics of the endogenous plasma marker 4β-hydroxycholesterol/ cholesterol ratio. There were a total of six PD parameters in the PD model including two describing kinetics of CP3A enzyme (Kin and KO, assuming equilibrium condition and a unit CYP3A amount at baseline, Kin was set to be equal to KO), two describing kinetics of 4β-hydroxycholesterol/
Figure 3 Visual predictive checks for time profiles of (A) enasidenib concentrations and (B) 4β-hydroxycholesterol/cholesterol ratios.
Notes: Blue open circles represent observed data. lines represent the 5th (dashed), 50th (solid), and 95th (dashed) percentiles of the observed data. shaded areas represent nonparametric 95% Cis about the 5th (blue), 50th (pink), and 95th (blue) percentiles for the corresponding model-predicted percentiles.
Time (days)
Log (Concentration)
0 100 200 300 400 500
0
246
81
01
2
A
Time (days)
Log (Ratio)
0 50 100 150 200 250 300
–1
1–
10
–9
–8
–7
B
Clinical Pharmacology: Advances and Applications downloaded from https://www.dovepress.com/ by 118.70.13.36 on 21-Aug-2020
Dovepress li et al
cholesterol ratio (KF and K), and two describing the drug effect on CYP3A induction (Emax and EC50). Since CYP3A activity endpoint from the CYP3A enzyme compartment were not directly measured, identifiability tests of the PD model parameters using the Flexible Modeling Environment R package were previously conducted by Ngaimisi et al to avoid over-parameterization of the model.19,22 Briefly, during
NONMEM analyses, the base model was first fitted to the data. Then, further model sensitivity to the fixed parameters was tested by halving and doubling the initial fixed param-eter values. Assessments were done to see if such tweaking of model parameters resulted into any significant decrease in objective function. Since no decreases were observed, parameters for KO and KF were fixed to those obtained from literature. Consistently, the same fixed KO and KF values from literature were incorporated in our present modeling process.
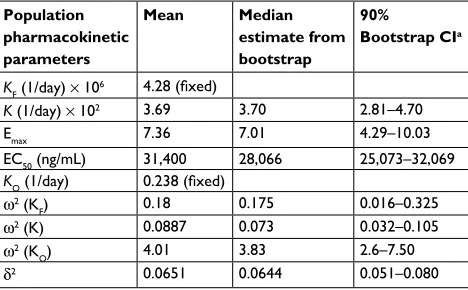
As summarized in Table 3, the identifiable PD parameters of K (4β-hydroxycholesterol/cholesterol elimination rate constant) was 0.0369 (1/day), Emax (maximum fold CYP3A induction by enasidenib) was 7.36 and EC50 (enasidenib plasma concentration to produce half of maximum CYP3A induction) was 31,400 ng/mL. Unidentifiable parameters were fixed to values reported in the literature (KO [enzyme turnover constant] was set to 0.238 [1/day] and KF [rate constant of 4β-hydroxycholesterol/cholesterol formation] was set to 4.28×10⁻⁶ [1/day]).
As shown in Figure 3B, VPC evaluation demonstrated observed median, lower 90% percentile, and upper 90th percentile of 4β-hydroxycholesterol/cholesterol ratio were contained within the model-predicted ranges (shaded areas).
Overall, these results confirmed the adequacy of the final population PD model in predicting 4β-hydroxycholesterol/ cholesterol ratio. Similarly, a nonparametric bootstrap was conducted using 500 bootstrap samples (453 out of 500 boot-strap runs converged successfully). Results from bootboot-strap analyses are given in Table 3 along with NONMEM param-eters. The primary PD parameters were similar between the NONMEM estimates and the bootstrap results. IIVs were similar as well. Overall, the above results (ie, VPC and boot-strap) confirm the adequacy of the final population PK model in characterizing 4β-hydroxycholesterol/cholesterol ratio.
Taken together, 4β-hydroxycholesterol/cholesterol ratio in the natural logarithm range of –11.001 to –6.567 (ie, 1.66×10⁻⁵ to 1.40×10⁻³) were well characterized by the final
population pharmacodynamics model.
Monte Carlo simulation
To assess the time course and the magnitude of CYP3A induction at the approved clinical daily dose of 100 mg, Monte Carlo simulation based on the final PK/PD model was conducted. Results from multiple daily doses of 100 mg enasidenib are presented in Figure 4. Figure 4A showed the simulated enasidenib plasma concentration vs time profile. The simulated concentration profile covered the observed data appropriately. After multiple 100 mg QD doses, ena-sidenib plasma concentration reached steady state with a Cmax of ~11,000 ng/mL, which is ~35% of model estimated EC50. Figure 4B showed CYP3A induction vs time profile. A maximum of approximately three-fold CYP3A induction was observed at the steady state after 100 mg daily enasidenib treatment.
To compare the relative magnitude of CYP3A induc-tion between enasidenib and efavirenz treatments and to assess the impact of different enasidenib doses on the maximum magnitude CYP3A induction, simulation of dose-dependent CYP3A induction by enasidenib or by standard efavirenz treatment was conducted. As shown in Figure 5, 2.1- to 6.1-fold of CYP3A induction by ena-sidenib was obtained in the dose range of 50–650 mg. In addition, 100 mg daily dose of enasidenib provided similar magnitude of CYP3A induction as compared to that from standard efavirenz treatment.
Discussion
Evaluation of DDI is an important part in drug development since patients; especially cancer patients frequently use more than one medication at a time. PK evaluation of DDI is primarily focused on the CYP family of enzymes due to
Table 3 Population pharmacodynamic estimates Population
pharmacokinetic parameters
Mean Median estimate from bootstrap
90%
Bootstrap CIa
KF (1/day) × 106 4.28 (fixed)
K (1/day) × 102 3.69 3.70 2.81–4.70
emax 7.36 7.01 4.29–10.03
eC50 (ng/ml) 31,400 28,066 25,073–32,069
KO (1/day) 0.238 (fixed) ω2 (K
F) 0.18 0.175 0.016–0.325
ω2 (K) 0.0887 0.073 0.032–0.105
ω2 (K
O) 4.01 3.83 2.6–7.50
δ2 0.0651 0.0644 0.051–0.080
Note: aBootstrap Ci values were taken from bootstrap calculation.
Abbreviations: emax, maximum enasidenib effect on the induction of CYP3A
enzyme; eC50, the enasidenib concentration producing half of emax effect on the induction of CY3A enzyme; K, rate constant of 4β-hydroxycholesterol/cholesterol ratio elimination; KF, rate constant of 4β-hydroxycholesterol/cholesterol ratio
formation; KO, first-order enzyme CYP3A turnover rate constant; σ2, variance of
intra-subject variability; ω2, variance of inter-subject variability.
Clinical Pharmacology: Advances and Applications downloaded from https://www.dovepress.com/ by 118.70.13.36 on 21-Aug-2020
Dovepress li et al
their prevalence in drug metabolism and their inducibility by drugs and other xenobiotics. Among the CYP superfamily, the isoform CYP3A is one of the most common routes of metabolism and is the primary route for 40%–60% of all marketed drugs. In vivo expression of CYP3A4/5 varies substantially between individuals.23,24 As a result,
adminis-tration of a drug that is a CYP3A inducer to patients under multiple medications can predispose patients to subthera-peutic dosing leading to significant loss of clinical efficacy for substrates of the enzyme. Intake of CYP3A inhibitors may lead to dangerously high blood levels of drug. This becomes especially critical for oncology drugs since they are typically administered at or close to the maximum tolerated dose.25
Traditional clinical DDI studies for CYP3A induction can be challenging, especially in cancer patients who are on mul-tiple therapies, and conducting a dedicated DDI study may not be feasible given the risk/benefit profile.26 Thus,
consid-erable efforts have been made in identifying an endogenous CYP3A probe that could diminish the need for dedicated DDI studies and facilitate assessment in special patient (eg, oncology) groups. It has been reported that the formation of 4β-hydroxycholesterol is selectively catalyzed by CYP3A from cholesterol.27 Enabled by the development of sensitive
bioanalytical methods,28 there is an increasing recognition of
the potential of 4β-hydroxycholesterol to be used as a metric to assess CYP3A activity.29 In the case of strong CYP3A
induction, the response of 4β-hydroxycholesterol levels showed a good dynamic response range and was comparable
Figure 4 Monte Carlo simulations of enasidenib plasma concentrations (A) and CYP3A induction (B) at clinical dose of 100 mg QD.
Notes: red lines represent the median from 500 Monte Carlo simulations. shaded
areas represent nonparametric 90% confidence of the median from 500 Monte
Carlo simulations.
Abbreviation: QD, once daily dose.
Time (days)
Enasidenib concentration (ng/mL
)
0 20 40 60 80 100
02
,000
4,00
06
,000
8,000
10,000
12,000
A
Time (days)
CYP3A induction (fold change)
0 20 40 60 80 100
1.
01
.5
2.
02
.5
3.
0
B
Figure 5 simulations of CYP3A induction kinetics.
Notes: Black dotted line represents CYP3A induction kinetics by efavirenz treatment (simulated from literature); solid lines and texts with different colors represent CYP3A induction kinetics by enasidenib treatment under different doses.
Time (day)
CYP3A Induction (fold change)
0 20 40 60
123456
50 mg [2.1 X fold]
75 mg [2.5 X fold] 100 mg [2.9 X fold] 150 mg [3.5 X fold] 200 mg [4 X fold] 300 mg [4.7 X fold]
450 mg [5.4 X fold]
650 mg [6.1 X fold]
Clinical Pharmacology: Advances and Applications downloaded from https://www.dovepress.com/ by 118.70.13.36 on 21-Aug-2020
Dovepress li et al
with index substrates making it an adequate endogenous biomarker to assess CYP3A induction.30,31
Enasidenib was approved recently by US Food and Drug Administration to treat R/R AML patients with specific IDH2 mutation. In vitro hepatocyte data suggest that enasidenib was a moderate CYP3A inducer.13 A dedicated enasidenib
DDI evaluation in healthy human subject is challenging due to a long half-life and a small apparent plasma clear-ance leading to approximately ten-fold drug accumulation at steady state and a disease-dependent PK with higher exposures in patients. Based on FDA’s guidance on clinical drug interaction studies, the dose regimen of a perpetrator drug should maximize the possibility of identifying a DDI, ie, DDI assessment should be conducted after administra-tion of perpetrator drug to steady state. Human steady-state exposure of enasidenib at therapeutic dose was much higher than no-observed-adverse-effect-level exposures obtained from toxicity study species. Therefore, DDI study evaluated with healthy volunteers is not feasible. A dedicated DDI study in AML patients is challenging because concomitant medications would need to be restricted for a long period to minimize their confounding impact on a DDI assessment. As an alternative approach, we conducted a quantitative assessment of enasidenib-induced CYP3A activity using 4β-hydroxycholesterol as an endogenous biomarker.
Ngaimisi et al proposed the first PK/PD model to describe 4β-hydroxycholesterol kinetics which adequately character-ized efavirenz-induced CYP3A activity during the standard antiretroviral therapy.19 In our present study, a similar
semi-mechanistic PK/PD model was built to characterize ena-sidenib plasma PK and to assess enaena-sidenib-induced CYP3A activity during enasidenib treatment (Figure 1).
A major assumption in this model was a stable cho-lesterol amount at a given time point. Our data (Figure 2) showed that cholesterol plasma concentrations were much higher than 4β-hydroxycholesterol plasma concentrations, which supported the assumption of a very small rate con-stant of 4β-hydroxycholesterol formation. In addition, only small percentage of patients were on the chronic usage of cholesterol-lowering drugs, and consistently, the cholesterol concentrations were stable with minor fluctuation dur-ing the whole enasidenib treatment (Figure 2); therefore, 4β-hydroxycholesterol and cholesterol ratio was used as the dependent variable in the modeling process. Of note, 4β-hydroxycholesterol and cholesterol ratio at the baseline was ~4.52×10⁻⁵ in R/R AML patients from our present study,
which is comparable to that reported from HIV patients by Ngaimisi et al (3.07×10⁻⁵) suggesting a stable baseline value
of 4β-hydroxycholesterol and cholesterol ratio between dif-ferent disease populations.
Efavirenz plasma concentration was not directly incor-porated in Ngaimisi et al’s model, instead, drug effect on CYP3A induction was indirectly characterized by incorpo-rating CYP2B6 (major enzyme responsible for efavirenz metabolism and its three different genotypes are responsible for the wide inter-individual variation in efavirenz plasma concentration) genetic polymorphism as a categorical covari-ate on the maximum fold CYP3A induction. Ngaimisi et al’s model showed that efavirenz treatment resulted in 1.74, 3.3, and 4.0 average fold induction of CYP3A for extensive (CYP2B6*1/*1), intermediate (CYP2B6*1/*6), and slow (CYP2B6*6/*6) efavirenz metabolizers, respectively. Since intensive enasidenib plasma concentration data were avail-able, a stimulatory direct effect (Emax) model describing enasidenib drug effect (enasidenib plasma concentration) on the rate constant of CYP3A formation was incorporated into the CYP3A enzyme compartment model in our pres-ent study. Our PD model suggested enasidenib can greatly induce CYP3A (Emax=7.36), while a high enasidenib plasma concentration is needed to produce a half of maximum fold CYP3A induction (EC50=31,400 ng/mL).
Monte Carlo simulations based on the final PK/PD model showed a significant drug accumulation (Figure 4A), and a maximum of approximately three-fold CYP3A induction after multiple 100 mg daily doses (Figure 4B). Even though the EC50 value of CYP3A induction by enasidenib is high, due to the high capacity on CYP3A induction by enasidenib (Emax of 7.36) and significant drug accumulation after multiple daily doses, high CYP3A induction was still achieved dem-onstrated by a 2.1- to 6.1-fold CYP3A induction at clinical relevant dose range of 50–650 mg by simulation (Figure 5). In addition, simulation showed that a clinical daily dose of 100 mg enasidenib can produce a similar maximum CYP3A induction as compared to the antiretroviral drug efavirenz. Efavirenz treatment appeared to take shorter time to reach the maximum CYP3A induction effect as compared to ena-sidenib treatment (Figure 5).
Conclusion
A semi-mechanistic PK/PD model has been successfully developed to characterize enasidenib plasma PK and to assess enasidenib-induced CYP3A activity by describing kinetics of the endogenous plasma biomarkers (4β-hydroxycholesterol and cholesterol). Our results indicate that enasidenib plasma concentrations were adequately characterized by a one-com-partment model with first-order absorption and elimination.
Clinical Pharmacology: Advances and Applications downloaded from https://www.dovepress.com/ by 118.70.13.36 on 21-Aug-2020
Dovepress li et al
Although the EC50 value for CYP3A induction by enasidenib is high, CYP3A induction was observed due to significant drug accumulation. CYP3A induction following enasidenib dosing should be considered when prescribing concomitant medication metabolized via this pathway.
Disclosure
All authors are employees of and hold equity ownership in Celgene Corporation. The authors report no other conflicts of interest in this work.
References
1. Dugan J, Pollyea D. Enasidenib for the treatment of acute myeloid leukemia. Expert Rev Clin Pharmacol. 2018;11(8):755–760. 2. Geisbrecht BV, Gould SJ. The human PICD gene encodes a cytoplasmic
and peroxisomal NADP(+)-dependent isocitrate dehydrogenase. J Biol Chem. 1999;274(43):30527–30533.
3. Wang F, Travins J, Delabarre B, et al. Targeted inhibition of mutant IDH2 in leukemia cells induces cellular differentiation. Science. 2013;340(6132):622–626.
4. Yoshihara T, Hamamoto T, Munakata R, Tajiri R, Ohsumi M, Yokota S. Localization of cytosolic NADP-dependent isocitrate dehydrogenase in the peroxisomes of rat liver cells: biochemical and immunocytochemical studies. J Histochem Cytochem. 2001;49(9):1123–1131.
5. Welch JS, Ley TJ, Link DC, et al. The origin and evolution of mutations in acute myeloid leukemia. Cell. 2012;150(2):264–278.
6. Gross S, Cairns RA, Minden MD, et al. Cancer-associated metabo-lite 2-hydroxyglutarate accumulates in acute myelogenous leuke-mia with isocitrate dehydrogenase 1 and 2 mutations. J Exp Med. 2010;207(2):339–344.
7. Showalter MR, Hatakeyama J, Cajka T, et al. Replication study: the common feature of leukemia-associated IDH1 and IDH2 mutations is a neomorphic enzyme activity converting alpha-ketoglutarate to 2-hydroxyglutarate. Elife. 2017;6:e2603027.
8. Fiehn O, Showalter MR, Schaner-Tooley CE; Reproducibility Project: Cancer Biology. Registered report: the common feature of leukemia-associated IDH1 and IDH2 mutations is a neomorphic enzyme activity converting alpha-ketoglutarate to 2-hydroxyglutarate. Elife. 2016;5:e12626.
9. Ward PS, Patel J, Wise DR, et al. The common feature of leukemia-associated IDH1 and IDH2 mutations is a neomorphic enzyme activity converting alpha-ketoglutarate to 2-hydroxyglutarate. Cancer Cell. 2010;17(3):225–234.
10. Dogra R, Bhatia R, Shankar R, Bansal P, Rawal RK. Enasidenib: first mutant IDH2 inhibitor for the treatment of refractory and relapsed acute myeloid leukemia. Anticancer Agents Med Chem. Epub 2018 Oct 24. 11. Abou Dalle I, Dinardo CD. The role of enasidenib in the treat-ment of mutant IDH2 acute myeloid leukemia. Ther Adv Hematol. 2018;9(7):163–173.
12. Enasidenib SE. A targeted inhibitor of mutant IDH2 proteins for treat-ment of relapsed or refractory acute myeloid leukemia. Future Oncol. 2018;14(1):23–40.
13. IDHIFA® (enasidenib) PI [package insert]. Celgene Corporation:
Sum-mit, NJ, USA: 2017.
14. Stein EM, Dinardo CD, Pollyea DA, et al. Enasidenib in mutant IDH2
relapsed or refractory acute myeloid leukemia. Blood. 2017;130(6): 722–731.
15. Tong Z, Atsriku C, Yerramilli U, et al. Absorption, distribution, metabo-lism and excretion of an isocitrate dehydrogenase-2 inhibitor enasidenib in rats and humans. Xenobiotica. 2018:1–11.
16. Frye RF. Probing the world of cytochrome P450 enzymes. Mol Interv. 2004;4(3):157–162.
17. Diczfalusy U, Kanebratt KP, Bredberg E, Andersson TB, Böttiger Y, Bertilsson L. 4beta-hydroxycholesterol as an endogenous marker for CYP3A4/5 activity. Stability and half-life of elimination after induction with rifampicin. Br J Clin Pharmacol. 2009;67(1):38–43.
18. Diczfalusy U, Nylén H, Elander P, Bertilsson L. 4β-hydroxycholesterol, an endogenous marker of CYP3A4/5 activity in humans. Br J Clin Pharmacol. 2011;71(2):183–189.
19. Ngaimisi E, Minzi O, Mugusi S, et al. Pharmacokinetic and pharmacoge-nomic modelling of the CYP3A activity marker 4β-hydroxycholesterol during efavirenz treatment and efavirenz/rifampicin co-treatment.
J Antimicrob Chemother. 2014;69(12):3311–3319.
20. Bodin K, Andersson U, Rystedt E, et al. Metabolism of 4β-hydroxycholesterol in humans. J Biol Chem. 2002;277(35): 31534–31540.
21. Björkhem-Bergman L, Bäckström T, Nylén H, et al. Comparison of endogenous 4β-hydroxycholesterol with midazolam as mark-ers for CYP3A4 induction by rifampicin. Drug Metab Dispos. 2013;41(8):1488–1493.
22. Soetaert K, Petzoldt T. Inverse modelling, sensitivity and Monte Carlo analysis in R using package FME. J Stat Softw. 2010;33(3):1–25. 23. Roussel F, Khan KK, Halpert JR. The importance of SRS-1 residues
in catalytic specificity of human cytochrome P450 3A4. Arch Biochem Biophys. 2000;374(2):269–278.
24. Zhou S, Yung Chan S, Cher Goh B, et al. Mechanism-based inhibition of cytochrome P450 3A4 by therapeutic drugs. Clin Pharmacokinet. 2005;44(3):279–304.
25. Jansman FG, Reyners AK, van Roon EN, et al. Consensus-based evaluation of clinical significance and management of anticancer drug interactions. Clin Ther. 2011;33(3):305–314.
26. Goodenough AK, Onorato JM, Ouyang Z, et al. Quantification of 4-beta-hydroxycholesterol in human plasma using automated sample preparation and LC-ESI-MS/MS analysis. Chem Res Toxicol. 2011;24(9):1575–1585.
27. Bodin K, Bretillon L, Aden Y, et al. Antiepileptic drugs increase plasma levels of 4beta-hydroxycholesterol in humans: evidence for involvement of cytochrome P450 3A4. J Biol Chem. 2001;276(42):38685–38689. 28. Honda A, Yamashita K, Hara T, et al. Highly sensitive quantification of
key regulatory oxysterols in biological samples by LC-ESI-MS/MS. J Lipid Res. 2009;50(2):350–357.
29. Josephson F, Bertilsson L, Böttiger Y, et al. CYP3A induction and inhibition by different antiretroviral regimens reflected by changes in plasma 4beta-hydroxycholesterol levels. Eur J Clin Pharmacol. 2008;64(8):775–781.
30. Björkhem-Bergman L, Bäckström T, Nylén H, et al. Quinine compared to 4β-hydroxycholesterol and midazolam as markers for CYP3A induc-tion by rifampicin. Drug Metab Pharmacokinet. 2014;29(4):352–355. 31. Dutreix C, Lorenzo S, Wang Y. Comparison of two endogenous bio-markers of CYP3A4 activity in a drug-drug interaction study between midostaurin and rifampicin. Eur J Clin Pharmacol. 2014;70(8):915–920.
Clinical Pharmacology: Advances and Applications downloaded from https://www.dovepress.com/ by 118.70.13.36 on 21-Aug-2020
Dovepress
Clinical Pharmacology: Advances and Applications
Publish your work in this journal
Submit your manuscript here: https://www.dovepress.com/clinical-pharmacology-advances-and-applications-journal Clinical Pharmacology: Advances and Applications is an international,
peer-reviewed, open access journal publishing original research, reports, reviews and commentaries on all areas of drug experience in humans. The manuscript management system is completely online and includes a very quick and fair peer-review system, which is all easy to use.
Visit http://www.dovepress.com/testimonials.php to read real quotes from published authors.
Dove
press
li et al
Supplementary material
Table S1 list of ieCs/irBs
Site number Name/address of IEC/IRB
101 integreview ethical review Board 3851 s. Capital of Texas highway suite 320 Austin, TX 78704, UsA
102 integreview ethical review Board 3851 s. Capital of Texas highway suite 320 Austin, TX 78704, UsA
103/900 Office for Human Research Studies Dana Farber Cancer institute Boston, MA 02215, UsA
104 Memorial sloan Kettering Cancer Center institutional review Board
1275 York Avenue new York, nY 10065, UsA
105 Western institutional review Board (WirB) 1019 39th Ave se suite 120
Puyallup, WA 98374-2115, UsA
106 UT southwestern institutional review Board 5323 harry hines Blvd.
Dallas, TX 75390–8843, UsA
107 stanford institutional review Board (irB) 3000 el Camino real
Five Pala Alto square, 4th Floor Palo Alto, CA 94306, UsA
108 University of Miami institutional review Board 1400 nW 10th Avenue suite 1200A Miami, Fl 33136, UsA
109 Weill Cornell Medical College institutional review Board 1300 York Avenue, Box 89 new York, nY 10065, UsA 110 northwestern University
institutional review Board
750 n. lake shore Drive – 7th Floor Chicago, il 60611, UsA
Site number Name/address of IEC/IRB
111 The University of Texas MD Anderson Cancer Center
institutional review Board (FWA 363) 7007 Bertner Avenue, Unit 1637 houston, TX 77030, UsA 112 Cleveland Clinic irB
9500 euclid Avenue Cleveland, Oh 44195, UsA
113 Western institutional review Board (WirB) 1019 39th Ave se suite 120
Puyallup, WA 98374, UsA 114 Washington University in st. louis
660 s. euclid Ave Box 8089 st. louis, MO 63110, UsA 116 OhsU institutional review Board
3181 sW sam Jackson Park road, l106-ri Portland, Or 97239, UsA
117 Chesapeake irB
6940 Columbia gateway Drive suite 110 Columbia, MD 21046, UsA
118 Western institutional review Board (WirB) 1019 39th Ave se suite 120
Puyallup, WA 98374, UsA
201 Comité de Protection des Personnes – ilede-France 3 hôpital Tarnier-Cochin
89 rue d’Assas Paris 75006, France
203 Comité de Protection des Personnes – ilede-France 3 hôpital Tarnier-Cochin
89 rue d’Assas Paris 75006, France
205 Comité de Protection des Personnes – ilede-France 3 hôpital Tarnier-Cochin
89 rue d’Assas Paris 75006, France
Abbreviations: ieC, independent ethics Committee; irB, institutional review Board.
Table S1 (Continued)
(Continued)
Clinical Pharmacology: Advances and Applications downloaded from https://www.dovepress.com/ by 118.70.13.36 on 21-Aug-2020