Copyright1998 by the Genetics Society of America
Constrained Disequilibrium Values and Hitchhiking in a Three-Locus System
Mark N. Grote,* William Klitz
†and Glenys Thomson
‡*Section of Evolution and Ecology, University of California, Davis, California 95616,†School of Public Health, University of California, Berkeley, California 94720 and‡Department of Integrative Biology, University of California, Berkeley, California 94720
Manuscript received February 6, 1998 Accepted for publication August 7, 1998
ABSTRACT
Positive selection on a new mutant allele can increase the frequencies of closely linked alleles (through hitchhiking), as well as create linkage disequilibrium between them. Because this disequilibrium is induced by the selected allele, one may be able to identify loci under selection by measuring the influence of a candidate locus on pairwise disequilibrium values at nearby loci. The constrained disequilibrium values (CDV) method approaches this problem by examining differences in pairwise disequilibrium values, which have been normalized for two- and three-locus systems, respectively. We have investigated in detail the reliability of inferences based on CDV, using simulation and analytical methods. Our main results are (i) in some circumstances, CDV may not distinguish well between a selected locus and a neighboring neutral locus, but (ii) CDV seldom indicates “selection” in neutral haplotypes with moderate to large 4Nc. We conclude that, although the CDV method does not appear to precisely locate selected alleles, it can be used to screen for regions in which hitchhiking is a plausible hypothesis. We present a microsatellite data set from human chromosome 6, in which constrained disequilibrium values suggest the action of selection in a region containing the human leukocyte antigen (HLA)-A and myelin oligodendrocyte glycoprotein (MOG) loci. The connection between hitchhiking and disequilibrium has received relatively little attention, so our investigation presents opportunities to address more general issues.
I
N the genetic hitchhiking model, positive selection existing disequilibrium, if selection in favor of the new mutant is strong enough relative to the recombination on a new mutant allele increases the frequencies ofother alleles physically linked to the mutant, skewing rate with linked loci. Hitchhiking can also create signifi-cant disequilibrium between nonselected alleles if they the frequency distributions at the linked loci.
Theoreti-cal and empiriTheoreti-cal studies of hitchhiking generally focus are closely linked to the selected allele (Thomson
1977); here, disequilibrium between neutral alleles is on the reduction in variation at linked neutral loci that
can result if the recombination rate is low and the se- induced by mutual association with the selected allele. These associations are expected to decline in strength lected mutant is quickly fixed in the population (
May-nard-SmithandHaigh1974;OhtaandKimura1975; as recombination breaks up haplotypes bearing the
se-lected mutant.
Aguade´ et al. 1989; Kaplan et al. 1989; Stephan and
Langley1989; and many more recent studies). Rela- Robinsonet al. (1991a,b) introduced the constrained
disequilibrium values (CDV) method as a means of iden-tively fewer studies have focused on linkage
disequilib-rium (gametic phase disequilibdisequilib-rium) in haplotypes sub- tifying loci that may have been subject to recent hitch-hiking. Inference with the CDV method depends on ject to hitchhiking (Thomson 1977; Robinson et al.
1991a;BegunandAquadro1994, 1995). Our concerns comparisons between pairwise disequilibrium measures,
which have been normalized according to different con-in the present study are the nature of lcon-inkage
disequilib-rium created by hitchhiking, and the extent to which straints imposed by two- and three-locus systems. A famil-iar two-locus linkage disequilibrium measure is certain patterns of disequilibrium can be used to make
inferences about hitchhiking. In a wider sense, our aim
Dab5fab2papb 5fabfAB2faBfAb, (1)
is to investigate a particular method that uses linkage
disequilibrium to physically locate genes of interest. where f
abis the frequency of the ab haplotype and pa, pb
Relatively insignificant linkage disequilibrium is al- are the corresponding one-locus allele frequencies. The ways created by the appearance of a new mutant, be- value of D
abdepends strongly on the magnitudes of pa
cause initially the mutant is found only on an “ancestral” and p
b, so Dabis commonly normalized using upper and
haplotype of closely linked alleles. Thomson (1977)
lower bounds imposed by pa and pb (Lewontin 1964,
showed that hitchhiking can noticeably increase this 1988;Hedrick1987).Robinsonet al. (1991b) showed
that a third locus imposes further bounds on Dab, and
showed how to normalize Dab using these additional
Corresponding author: Mark N. Grote, Section of Evolution and
Ecol-constraints (described below). Differences in pairwise ogy, University of California, Davis, CA 95616.
E-mail: [email protected] disequilibria, normalized in the two different ways,
light the influence that a third locus may exert on the pairwise measure, D″ab, which incorporates futher
con-straints imposed on Dab by a third locus. For a
three-pairwise measure. On the basis of deterministic
simula-tions of a three-locus hitchhiking model,Robinson et locus diallelic haplotype, where the C locus plays the
role of the “constraining” locus,
al. (1991a) proposed that differences in the normalized
measures could indicate which of the three loci has the selected mutant. The method for making such infer-ences was termed the CDV method.
Our purpose is to present some recent results that bear upon the use and interpretation of CDV. First,
we summarize further simulations of the deterministic D″ab(c)5
Dab
max*Dab
if Dab.0 and min* Dab#0
Dab2min*Dab
max*Dab2min*Dab
if Dab.0 and min* Dab.0
0 if Dab50
Dab
2min*Dab
if Dab,0 and max* Dab$0
Dab2max*Dab
max*Dab2min*Dab
if Dab,0 and max*Dab,0,
model, describing some circumstances under which CDV does, or does not, lead to reliable inferences about the position of the selected locus. In connection with this, we analyze the normalized disequilibrium measures
under a selection model with simplifying assumptions (3)
and show that inferences with CDV are especially
sensi-where tive to allele frequencies at neutral loci closely linked
to the selected locus. Second, we apply the CDV method min*Dab5 max(2papb,2qaqb,2m1,2m2) to data sets generated under a stochastic model of neu- max*Dab5 min(paqb, qapb, M1M2)
tral haplotypes, using a simulation program ofHudson
and (1983, 1985), to assess the performance of CDV under
a finite-population “null” model. In our discussion, we m
1 5papbpc1qaqbqc1 Dac1 Dbc
reexamine the types of inferences that can be made m
2 5papbqc1 qaqbpc2 Dac2 Dbc
with CDV and address some conceptual and practical M
1 5paqbpc1 qapbqc1 Dac2 Dbc
issues. Finally, we apply the CDV method to marker M
2 5paqbqc1qapbpc2 Dac1 Dbc.
haplotypes from human chromosome 6, to illustrate
one use of CDV. The associations between a and c, and between b and
c, enter the calculation of Dab″through m1, m2, M1, and
M2.
METHODS Like D9ab, Dab″lies between 11 and21, where the
ex-treme values indicate the strongest possible positive or Measures of disequilibrium and hitchhiking:Our
at-negative association between alleles a and b, within the tention centers on two normalized measures of pairwise
constraints imposed by the allele frequencies and pair-linkage disequilibrium, D9and D″, and in particular on
wise disequilibria of the three-locus system. We write the difference in their magnitudes,
Dab(c)″ because Dab″is calculated with reference to a
particu-d 5|D9| 2|D″|. lar allele at the third locus, but in a diallelic system, one can show Dab(c)″ 5Dab(C)″ . Moreover, as with D9abin a diallelic D9is the familiar normalized pairwise linkage disequilib- system, D″
ab5 DAB″ 5 2DaB″ 5 2DAb″.
rium measure (Lewontin 1964, 1988;Hedrick1987;
Assuming Dab.0 for the moment,d 5|D9|2|D″|is
Robinson et al. 1991b), where for alleles a and b at
greater than zero when the pairwise measure Dabis more
distinct loci,
extreme relative to its two-locus maximum, than to its positive range in the three-locus system; in this case the pairwise association between a and b appears to be rela-tively weaker when all of the pairwise associations of the three-locus system are taken into account. Loosely
D9ab5
Dab
min(paqb, qapb)
if Dab.0
0 if Dab5 0
Dab
2max(2papb,2qaqb)
if Dab,0,
speaking, whend .0, the association between a and b is said to be partly accounted for by their mutual associa-tion with c. Assuming further that c is a selected mutant, (2)
this property ofdis the primary reason for treatingd . 0 as the “footprint” of a hitchhiking event, in which the with Dab, pa, and pb as in (1), qa5 12paand qb5 12
pb. D9abis calculated from Dabvia division by an appro- neutral a and b alleles have hitchhiked with c (Robinson et al. 1991a).
priate upper or lower bound. The extreme values of
D9abreflect the complete association of the a or b allele Although the normalized measure D9 may change
during a hitchhiking event (Thomson1977), D9alone
with the ab haplotype (D9ab5 11), or the absence of any
ab haplotypes when in fact the constituent alleles are does not distinguish between loci that may be under
positive selection and linked neutral loci that are only present (D9ab5 21).
single measure of third-order disequilibrium, Dabc, which initial allele frequencies pa(0), pb(0), pc(0), and a single
initial disequilibrium value [e.g., D9ab(0) when c is the
can also be normalized appropriately (Geiringer1944; ThomsonandBaur1984), but D
abcalso makes no dis- new mutant]. In addition, we assume that the haplotype
bearing the new mutant has not experienced mutation tinction between selected and hitchhiking loci. The
main claim ofRobinsonet al. (1991a) is thatd values, or recombination before the simulation begins at
gener-ation zero [for example, if c is the new mutant, this when interpreted appropriately, can make this
distinc-tion. implies fabc(0) 5 pc(0)]. The frequency dynamics of a
strongly selected allele, once it has left the zero-fre-For a given three-locus haplotype, each locus may
play the role of the constraining locus, and there are quency boundary, are commonly modeled as a deter-ministic process (e.g.,Kaplan et al. 1989). For
conve-threedvalues:dab(c),da(b)c, andd(a)bc. Using deterministic
simulations,Robinson et al. (1991a) found thatd was nience, we have assumed that the time spent close to
the boundary is small relative to recombination and often large and positive when the “constraining” allele
was increasing in frequency due to positive selection, mutation rates near the selected locus.
Fitnesses at the selected locus (using genotypes at the but the linked alleles were selectively neutral. When a
nonselected allele played the “constraining” role,Rob- C locus for illustration) are given by wcc512sc, wCc5
1, and wCC512sC. We have adopted a general
frame-insonet al. (1991a) found thatdtended to be zero or
negative. Based on their observations,Robinson et al. work for hitchhiking studies, as our selection model
encompasses both directional selection leading to fixa-(1991a) proposed the following criteria for inferring
selection based ond values: tion of the new mutant (e.g., sc # 0 and 0 , sC # 1)
and balancing selection (0, {sC,sc} , 1). Mutation is
1. If one of the three d values is positive and the
re-unidirectional at ratesma5 mb5 mc51025per
genera-maining two are zero or negative, the constraining
tion from alleles a, b, and c to A, B, and C, respectively, allele that gives the positive d is the one that may
so that the alleles of interest are transient. We use terms have experienced recent selection.
like “equilibrium frequency” loosely, referring to the 2. If more than one of thedvalues is positive, but one
relatively fast adjustment of allele frequencies that re-is much larger than the rest (for thre-is study, more
sults from the appearance of a new selected mutant. than double the next largest), the constraining allele
For completeness, we have included the recursion equa-that gives the largedis the one that may have
experi-tions in theappendix.
enced recent selection.
Scope of the deterministic simulations:The parame-3. If all threed values are#0, or two are positive but
ter space for the deterministic model is large and multi-close in value, no conclusion about selection can be
dimensional, so we limit our investigation to a relatively drawn.
narrow subset of parameter values under which measur-able linkage disequilibrium is likely to be present. Using
Robinsonet al. (1991a) paid considerable attention to
the magnitudes ofdvalues under various scenarios, but simple frequency arguments, one can conclude that most new mutants arise on relatively common haplo-we first focus simply on which loci the CDV method
identifies as candidates for selection, in a large series types; but more unusual events, in which mutants appear on rare haplotypes, are actually of greater interest in of deterministic simulations.
A deterministic hitchhiking model:The deterministic hitchhiking studies. Thomson (1977) showed that
hitchhiking will only noticeably perturb allele frequen-simulations are based on a three-locus, diallelic model
that evolves via a standard system of algebraic recursions cies and disequilibria when at least one of the neutral alleles initially linked to the mutant is rare. The pairwise (Feldmanet al. 1974;Thomson1977;HartlandClark
1989). For purposes of the CDV method, we are inter- disequilibrium value Dabis only large when alleles a and b are at intermediate frequencies and strongly associated
ested in a single new mutant allele and the closely linked
alleles of the ancestral haplotype on which the mutant in the “coupling” (ab) phase. An initially rare ab haplo-type, on which a strongly selected mutant happens to first appeared. The alleles of interest, in their order on
the chromosome, are a, b, and c, one of which will occur, is in a primary position to pass through this range of intermediate frequencies in strong coupling. be the new mutant and the others linked alleles. By
convention, A, B, and C may be taken to represent all In the following simulations, we have (somewhat arbi-trarily) set the initial frequency of at least one of the other alleles at their respective loci.
The recursion equations describing changes in the neutral alleles at p(0)50.05, to ensure that the ancestral haplotype is sufficiently rare. Table 1 shows parameter haplotype frequencies can be specified by selection and
mutation parameters described immediately below, the values that are typical of the simulations. Here, c is the selected mutant and pa(0) and pb(0) are treated in a
recombination rates r1and r2between the A and B loci
and the B and C loci, respectively (where r11r222r1r2 symmetric fashion, each assuming the value p(0)50.05 while the other takes values between 0.05 and 0.9 in gives the recombination rate between A and C for the
“no-interference” model), and a set of initial haplotype successive runs. Some values of the initial pairwise dis-equilibrium D9ab(0) rule out certain combinations of
pa(0), pb(0), and pc(0) in Table 1, but the same
treat-ments are always applied to the a and b alleles. Values of the remaining parameters were guided by a few basic rules. Hitchhiking is thought to be a weak force unless selective values are roughly an order of magnitude greater than recombination rates ( May-nard-SmithandHaigh1974;Thomson1977;Kaplan
et al. 1989), so we have chosen selection and
recombina-tion parameters accordingly. Generally, for each setting of pa(0), pb(0), pc(0), D9ab(0), r1, and r2that was investi-gated, we examined a basic series of runs formed by 7310570 pairs of selection coefficients (for example,
sCand scas shown in Table 1). Combinations of
parame-ter values that involved inparame-teractions beyond those of primary interest [for example, D9ab(0)5 20.25 and r1?
r2in Table 1] were left unexamined to keep the number of runs reasonable. More detailed tables are inGrote
(1996) and are available upon request.
Within these guidelines, our first objectives are to significantly enlarge upon the number of deterministic cases examined inRobinsonet al. (1991a), and to
inves-tigate some cases where the relationship between thed values is inconsistent with correct inference of the se-lected locus.
CDV in a stochastic neutral model:Our second aim is to study the performance of CDV in a neutral, finite-population model, to determine whether or not genetic drift and sampling effects can produce patterns of
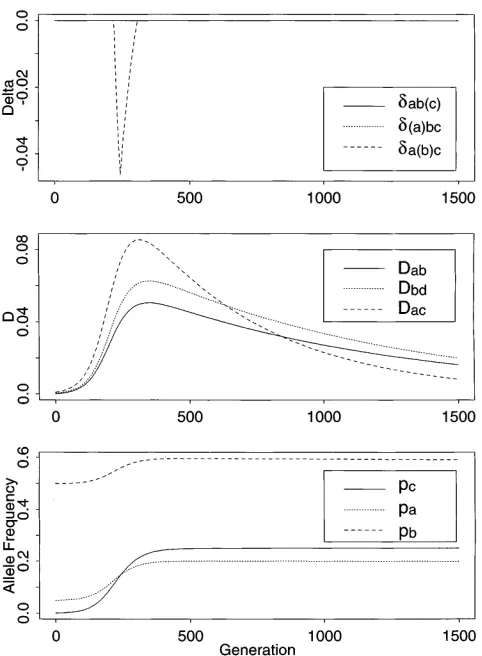
link-Figure1.—Deterministic simulation for selection at c, with
age disequilibrium conforming to criteria 1 or 2 above.
Dab9(0)50.0, r15r250.001, pa(0)50.05, pb(0)50.1, pc(0)5
Robinsonet al. (1991a) used an ad hoc method to study
0.001, sC50.025, sc50.075.
d values under genetic drift.
We have modified a computer program of Hudson
(1983, 1985) to study d values in the neutral model. d
a(b)c, anddab(c)in each accepted sample. For each of three
The program simulates random samples of three-locus levels of recombination 4Nc, we generated independent haplotypes, generated under the neutral “infinite al- samples until 1000 samples had met the screening crite-leles” model with recombination at equilibrium. The ria; our stochastic simulation results are based on these program requires the following input parameters: n, groups of 1000 samples.
the number of haplotypes per sample; 4Nc, the scaled recombination rate between the A and C loci (the B
locus is assumed to be halfway between A and C); ua, RESULTS
ub, anduc(with, e.g.,ua54Nma, where N is the effective
Deterministic simulations: Figures 1–3 show sample population size and ma is the mutation rate to new
runs of a deterministic model in which c is the selected A-locus alleles). We used the valueu 50.2 at each locus,
mutant and the A and B loci are neutral. In Figures corresponding to the approximate numerical solution
1–3, recombination rates, initial allele frequencies at of
the A and C loci, and mutation and selection parameters are the same; only the initial frequency of the b allele
E[Kn]5 u
u 1 u
(u 11) 1· · · 1 u
(u 1n 21)5 2 varies between the figures.
In the allele frequency plots, pc(t) approaches the
(Ewens1979), with E[Kn] the expected number of al- equilibrium value s
C/(sc 1 sC)5 0.25, then slowly
de-leles (per locus) in the sample and n 5 100. As one clines due to mutation (not evident in these plots). would expect, not all samples generated at u 5 0.2 Frequencies of the a and b alleles both increase due to were segregating exactly two alleles at each locus, so hitchhiking with the selected mutant c. The frequencies we screened each sample and retained only those with ultimately attained by a and b depend on their initial diallelic loci. We further required in each sample a frequencies, Dab(0), the strength of selection on c, and
standard minimum level of heterozygosity, H$ 0.095 the recombination rates between these loci ( Maynard-Smith and Haigh1974; Thomson 1977). The initial
Figure3.—Deterministic simulation for selection at c, the Figure2.—Deterministic simulation for selection at c, the
same as Figure 1 except pb(0)50.05.
same as Figure 1 except pb(0)50.5.
Figure 3 of Robinson et al. 1991a). Inferences about
value of Dabis zero in each of the runs, and initial values the selected allele based on disequilibrium values at a
of Dacand Dbcare small positive numbers reflecting the single time-point could indeed be misleading in Figure
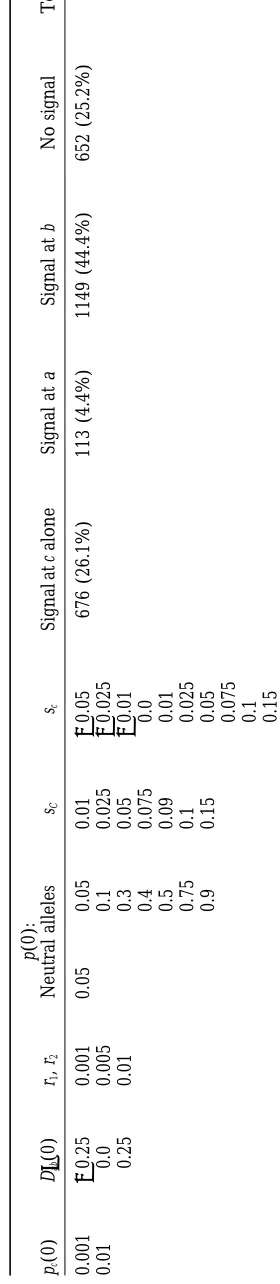
associations of a and b with the new mutant c. All three 3, where knowledge of the whole history of the selective values of D increase with the hitchhiking effect, then event might seem necessary for correct inference. slowly decrease. Because there is only a single selected The performance of the CDV criteria in a large series locus in these runs, the equilibrium value of all disequi- of deterministic runs is summarized in Tables 1 and 2. libria D and eachdis zero. In the deterministic model Following the discussion above, we have classified each without selection on c, Dabwould remain at zero, whereas run by determining which alleles, if any, the CDV crite-Dac and Dbc would decline from their initial values to ria would indicate as “selected.” The run of Figure 1
zero without a transient increase. In these runs, it is shows a correct signal at the C locus for 100 # t # only after the disequilibrium measures D have attained 300 but gives no signal for selection otherwise, and is relatively large values that deviations from d 5 0 are counted under the column “signal at c alone” in Table
observed. 1. Sampling such a run at an arbitrary time, we might
TA BL E 2 b is the new mutant under selection: pc (0) 5 0.05, r2 5 0.001 pb (0) D 9ac (0) r1 pa (0) sB , sb Signal at b alone Signal at a Signal at c No signal Total runs 0.001 2 0.25 0.001 0.05 (Same as sC , sc in Table 1) 979 (70.0%) 0 (0%) 194 (13.9%) 227 (16.2%) 1400 0.01 0.0 0.005 0.1 0.25 0.01
0.3 0.4 0.5 0.75 0.9
Deterministic runs for selection at b, with the A and C loci neutral. TA BL E 1 c is the new mutant under selection p (0): pc (0) D 9ab (0) r1 , r2 Neutral alleles sC sc Signal at c alone Signal at a Signal at b No signal Total runs 0.001 2 0.25 0.001 0.05 0.05 0.01 2 0.05 676 (26.1%) 113 (4.4%) 1149 (44.4%) 652 (25.2%) 2590 0.01 0.0 0.005 0.1 0.025 2 0.025 0.25 0.01 0.3 0.05 2 0.01 0.4 0.075 0.0 0.5 0.09 0.01 0.75 0.1 0.025 0.9 0.15
0.05 0.075 0.1 0.15
trends and give some breakdowns of the runs that would in which the neutral allele frequencies pa(0) and pc(0)
differ widely [i.e., pa(0)50.75 or 0.9 and pc(0)50.05].
not be evident by examining Tables 1 and 2 alone. We
use percentages in the tables and text as convenient The role of allele frequencies at a closely linked neu-tral locus: The most problematic observation in the summaries, but do not view these as probabilities.
In 26.1% (676/2590) of the runs in Table 1, the simulations above was a strong tendency for the CDV method to indicate selection at the B locus when c was only signal identifying an allele under selection correctly
points to c as the selected mutant. The CDV criteria the new selected mutant. Using some mathematics and general aspects of the hitchhiking model, it is possible identify the selected locus most reliably when the b allele
is initially of moderate frequency: 50.5% (283/560) of to show that a rare neutral allele on the ancestral haplo-type can easily be mistaken for the selected allele, when the runs in Table 1 with pb(0) 5 0.3, 0.4, or 0.5 and
pa(0) 5 0.05 resulted in the c allele being correctly using the CDV method. The analysis requires some
sim-plifying assumptions, but gives some generality to the identified, 35.5% (199/560) led to a possible
misidenti-fication of the b allele, and the remaining 14.0% (78/ results of the deterministic simulations, showing that our observations do not depend strongly on particular 560) gave no signal for selection. CDV also performs
well when the initial disequilibrium between the neutral choices of parameter values.
An overdominance model: We examine the behavior of
alleles is negative: 46.7% (294/630) of the runs with
D9ab(0)5 20.25 correctly identified the c allele and only da(b)c, thedvalue that indicates selection at the B locus,
during the rapid increase of a new, strongly overdomi-20.8% (131/630) gave false signals at a or b. CDV
per-forms poorly when the initial frequencies of the neutral nant c allele. To avoid dealing with the time component explicitly, we focus on da(b)c at t 5 0, t “small” (a few
loci differ widely, resulting in a false signal for selection
at the rarer of the two neutral alleles: 52.1% (219/420) generations) and t “moderate” (on the order of 100 to a few hundred generations). We assume that r1and r2 of the runs with pa(0)5 0.75 or 0.9 and pb(0) 5 0.05
gave a false signal at b, and 33.3% (140/420) of the are small enough so that recombination in the ancestral haplotype abc can be practically ignored when t is near runs with pa(0)5 0.05 and pb(0) 5 0.75 or 0.9 gave a
false signal at a. In general, CDV does a poor job identi- zero, and further assume that pb(0) is small enough so
that b and c are in strong coupling for small-to-moderate fying the selected allele when the b allele is rare: 62.1%
(956/1540) of the runs with pb(0)5 0.05 gave a false t. Low recombination and strong coupling of b and c
imply that fab(t), fac(t), and fbc(t) are all approximately
signal for selection at the b allele. When the b allele is
initially rare, the CDV criteria do not distinguish well equal to pc(t) for small-to-moderate t. We finally assume Dab5 0, but due to hitchhiking, all of Dab, Dac, and Dbc
between the new selected mutant c and its closest
neu-tral neighbor. are positive after a few generations of selection.
To characterize da(b)c, we must study the relationship
In these simulations, when sc#0.0 and sC.0.0, the
new mutant c will be transiently fixed in the population between D9acand D″a(b)cfor t50, t small and t moderate.
For convenience, the required definitions when Dac$
(often called a “selective sweep”). In the selective-sweep
runs, 24.8% (257/1036) gave a correct signal from the 0 are
c allele, 50.5% (523/1036) led to a possible
misidentifi-cation of the b allele, and 4.2% (43/1036) to a possible D9ac5
Dac
min(paqc, qapc)
misidentification of the a allele. In the next section, we
will examine why CDV may not perform especially well and in a selective sweep.
As one might imagine, there is a trend in the reliability of inferences associated with the ratio sc/sC: for fixed
values of the remaining parameters, with both sc, sC. Da(b)c″ 5
Dac
max*Dac
if min*Dac# 0
Dac2 min*Dac
max*Dac2min*Dac
if min*Dac. 0,
0, runs with larger values of sc/sCtend to have no signal,
those with smaller values of sc/sCtend to have incorrect
signals from the b allele, and those with intermediate
where values of sc/sCallow the CDV method to perform best.
The critical values of the ratio sc/sCdepend in a complex min*Dac5 max(2papc,2qaqc,2m1,2m2)
way on the remaining parameters and appear to be max*D
ac5 min(paqc, qapc, M1, M2) different in each series of runs.
and Table 2 is similar in structure to Table 1, except now
b is the new selected mutant and the A and C loci are m
15papbpc1qaqbqc1Dab1 Dbc
neutral. Here, by symmetry, there is no need to switch m
25paqbpc1 qapbqc2Dab2 Dbc
the roles of the neutral loci, and we use pc(0)5 0.05, M
15papbqc1 qaqbpc1Dab2 Dbc
r2 5 0.001 throughout. When b is the new mutant, a M
25paqbqc1qapbpc2Dab1 Dbc.
relatively small number of runs have a potentially
the sign of min*Dacis determined entirely by the relative Dac
max Dac
2 Dac2 min*Dac
max*Dac2min*Dac
.0, sizes of the positive and negative terms in m2. When the
disequilibria Daband Dbc in m2are small relative to the
orda(b)c.0. Putting the above together, we have shown
third-order products of allele frequencies (as they will
thatda(b)c≈ 0 for t 5 0 and t small, but da(b)c . 0 for t
tend to be for t near zero), m2$ 0 and min*Dac# 0.
moderate. When the disequilibria are large relative to the
third-Using very similar arguments, it is possible to show order products (as they tend to be for moderate t),
thatdab(c)$0 during the same time interval, so that the
m2,0 and min*Dac.0.
same general mechanisms give the “correct” signal at At t 5 0, fac 5 pc, and because the new mutant c is
the C locus. The constrasting result d(a)bc ≈ 0 can be found only with a, Dac5max Dac. Further, the inequality
obtained using the same detailed arguments, or more
Dac#max*Dac#max Dac easily can be obtained by noting that Dbc remains very
close to max Dbc during the time interval of interest.
must hold, because the set (paqc, qapc, M1, M2) that deter- Taken together, these arguments suggest that under our mines max*Daccontains the set that determines max Dac. assumptions the CDV criteria could indicate selection at Dac 5 max Dac then implies max*Dac 5 max Dac, and either the B or C loci, but not at the A locus.
therefore
A selective sweep model: A second basic model may be
handled without doing any further analysis. For the da(b)c5
Dac
max Dac
2 Dac
max*Dac
50 selective sweep case, we assume sc#0 and sC.0, so that
the selected mutant c will be fixed, but the remaining assumptions are the same. The transient dynamics of for t5 0.
allele and haplotype frequencies are the same as in the For small t, with the disequilibria of m2 still small
overdominance model, with perhaps minor differences relative to the third-order products, the reasoning is
in time scale; the main difference is in the endpoint very similar. Because the new mutant c is still found
of the selection process.Maynard-Smith and Haigh
almost exclusively on the ancestral haplotype, Dac ≈
(1974) showed that an allele at a polymorphic locus max Dac to a good approximation, so it also must be
closely linked to a new favored mutant may readily fix true that max*Dac≈max Dac. We then haveda(b)c≈0 for
with the selected mutant. In our model, if the c allele small t.
fixes in a small number of generations, the time during The situation changes when the disequilibria of m2
which Dac and Dbc are positive will be very short, since
are large relative to the third-order products, so that
these equal zero once the C locus has become
mono-m2,0 and min*Dac.0; here, we must use the second
morphic. If there has been very little recombination case in the definition of D″ac above. We further observe
with A- or B-bearing haplotypes by the time c fixes, Dab
that when the loci are evenly spaced, recombination
will also depart only transiently from zero, because a begins relatively soon to reduce Dacbelow its two-locus
and b will then nearly fix with c. There appears to be maximum (compared to Daband Dbc), although all of
only a small time frame in which we could observe any the disequilibria may have dropped below earlier large
disequilibrium, hence any change in d values, in the values due to allele frequency constraints. Now consider
sweep model. The basic reasoning of the previous
sec-t moderasec-te, wisec-th min*Dac . 0 and Dac , max Dac. To
tion again suggests that during this time, a signal for determine the sign ofda(b)c, we must examine as before
apparent selection is possible from either the selected the relative magnitudes of max Dac and max*Dac. It is
locus or a nearby neutral locus carrying a rare allele. convenient to use algebraically equivalent expressions
Stochastic simulations: We have calculated d values for the terms M1and M2in max*Dac:
in simulated random samples from a stochastic, neutral
M15qapc1 fab2 fbc diallelic model, to informally investigate the “type I”
M25paqc2 fab1 fbc. error in the CDV method. The three-locus neutral
model is perhaps the simplest null-model that would be Under our assumptions, fab≈fbc≈pcfor small-to-moderate
considered for data of the type used for CDV.Hudson
t to a reasonable approximation, and therefore M1 ≈
(1985) investigated the sampling distribution of the
qapc, M2≈paqc. We then may write
pairwise disequilibrium D using a similar approach. Pair-wise D have been treated analytically under the neutral max*Dac5 min(qapc, paqc, M1, M2)
model byHill(1975),Golding(1984), andHilland
≈ min (qapc, paqc)5max Dac.
Weir(1988).
Along with Dac, max Dac, this implies Distributions of the threedvalues in samples of size
n 5 100 are shown in Figure 4 for 4Nc5 10, 25, and max Dacmin*Dac. Dac
100. The histograms of Figure 4 show only the univariate 3 (min*Dac1 max Dac2 max*Dac),
TABLE 3
Frequency of signal for apparent selection:
neutral samples (n5100)
Locus
A B C Total
4Nc510 0.02 0.051 0.014 0.085
4Nc525 0.009 0.016 0.006 0.031
4Nc5100 0.0 0.002 0.002 0.004
Frequency of signals for apparent selection at each locus using the CDV criteria for the neutral diallelic samples of Figure 4. Because only one locus per sample may satisfy the CDV criteria for selection, we have added the frequencies of per-locus signals to obtain the totals.
the deterministic simulations, although here there is no selection, we obtain false signals for selection at the B locus more often than at A or C (as expected, the A and C loci give similar results). We take this as further evidence of a “position” effect that favors the middle locus.
Marker haplotypes from human chromosome 6: To illustrate one use of the CDV method, we have calcu-lated d values in a series of three-locus microsatellite haplotypes in the 6p21.3-22.1 region of human chromo-some 6 (see Figure 5). We do not presume any of these marker loci are selected, but suppose instead that per-haps one or more markers could be closely linked to a selected gene.
Figure4.—Distributions ofdvalues under a stochastic
neu-We used a “sliding window” approach, examining in
tral model for three values of 4Nc (where c is the recombina- turn each of the five groups of three adjacent markers
tion rate per generation between the A and C loci and N is
among the seven markers shown in Figure 5. Human
the effective population size). Each individual data set consists
leukocyte antigen (HLA)-F39and myelin
oligodendro-of n5100 three-locus haplotypes, having exactly two alleles
segregating at each locus, with per-locus heterozygosities of cyte glycoprotein (MOG)c are dinucleotide repeats
at least 0.095. The distributions are based on 1000 indepen- closely linked to the HLA F locus and the MOG locus,
dent data sets, generated using a modified program of
Hud-respectively. HLA-A, a major histocompatibility complex
son(1983, 1985). Bars above d 50 are not drawn to scale
class I locus, is located between the D6S265 and HLA-F39
with the remaining bars; instead the frequencies atd 50 are
markers shown in Figure 5 (Laueret al. 1997;Mosseret
indicated in the figure.
al. 1997). This region contains other loci of biological
and evolutionary interest and has been the focus of recent intensive efforts to map the hereditary hemo-threed values. At each value of 4Nc, thed 50 class is
chromatosis locus, now known to bez2.2 Mb telomeric by far the most common for each ofd(a)bc,da(b)c, anddab(c),
to D6S464 (Federet al. 1996;Laueret al. 1997;Mosser
with d $0 relatively uncommon. Negative values of d
et al. 1997). The data we used are from a sample of 70
are more common than positive values whenddeparts
randomly ascertained ethnic Germans and were gener-from zero. Relative tod(a)bcanddab(c),da(b)cis more often
ously provided by L. Calandro and G. F. Sensabaugh different from zero.
(seeSensabaughet al. 1996). We used an
expectation-The frequencies of apparent “hitchhiking” events,
ob-maximization (EM) algorithm to estimate haplotype fre-tained by applying the CDV criteria to the samples in
quencies from multilocus genotypes (Baurand
Dani-Figure 4, are shown in Table 3. For 4Nc510, each locus
lovs1980), working separately with each group of three
satisfies the criteria for selection in a small percentage of
adjacent markers. The EM algorithm provides haplo-cases: here one can expect to find a signal for selection
type frequency estimates for all possible combinations at some locus perhaps 8 to 9% of the time, using the
of alleles at the three loci, some of which have very low CDV criteria in a neutral sample. With 4Nc$25,
how-estimates and are unlikely to actually be in the sample. ever, any apparent signal for “selection” based on the
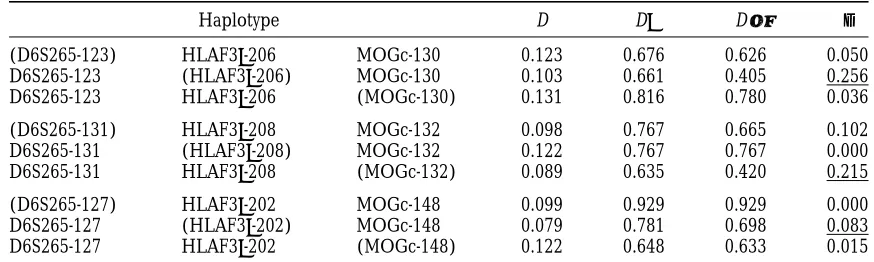
three-locus haplotypes in which the constituent two-three-locus esti-mates were at least 0.05. Seventeen three-locus haplo-types in all met this minimum frequency threshold: 3 haplotypes of the D6S265/HLA-F39/MOGc loci, 5 hap-lotypes of the HLA-F39/MOGc/D6S258 loci, 3 haplo-types of the MOGc/D6S258/D6S306 loci, 4 haplohaplo-types of the D6S258/D6S306/D6S105 loci, and 2 haplotypes of the D6S306/D6S105/D6S464 loci. All are combina-tions of the few most common alleles at each locus. We calculateddvalues in each of these 17 haplotypes, converting to dialleles by combining the alleles not un-der consiun-deration into a single class. All 3 haplotypes of the D6S265/HLA-F39/MOGc loci had disequilibrium patterns conforming to criteria 1 or 2 (Table 4), but none of the remaining 14 haplotypes met these criteria.
DISCUSSION
Inferences with CDV: In the deterministic runs, where the new selected mutant appeared at a terminal locus (the C locus), the CDV method did not distinguish well between the selected locus and a neutral neighbor, especially when a relatively rare allele of the neutral locus was initially linked with the selected mutant. In this case a signal for apparent selection could either be detected from the selected locus or the neutral locus. This situation is unfortunate and somewhat paradoxical, because we have argued that selected mutants that form on rare haplotypes create the most significant linkage disequilibrium in a hitchhiking scenario. To some ex-tent, the CDV method is sensitive to each of the parame-ters of the model, but we discovered in particular a sensitivity to allele frequencies at the middle locus (the B locus). We showed, using an analytical approach un-der the assumption of strong selection and tight linkage, that a rare neutral allele at the B locus may easily be
mistaken by the CDV criteria for the selected mutant c. Figure5.—Physical map of seven dinucleotide repeat
mark-Lewontin(1988) showed that the normalized pair- ers in the 6p21.3-22.1 region of human chromosome 6.
Ap-wise measure D9aband other related measures are not in proximate intermarker distances are based on the YAC contig
and STS maps ofMosseret al. (1997). Allele frequency
distri-any general sense independent of the underlying allele
butions are for the sample of 70 ethnic Germans provided by
frequencies pa and pb, although they are routinely
L. Calandro and G. F. Sensabaugh (Sensabaughet al. 1996).
treated as such. The CDV method uses both D9 and The x and y axes of the histograms are labeled according to
D″ at each pair of the three-locus system, where D″ repeat number and frequency in the sample, respectively. incorporates further one- and two-locus frequency
con-straints. In light ofLewontin’s (1988) results, it is not
unexpected that CDV shows a sensitive dependence on ences to terminal loci, perhaps obtaining additional markers that could place any locus of interest at the “A” allele and haplotype frequencies, as well as on other
parameters of the model. or “C” positions of our model. This assumes we could
be virtually certain about inferences at terminal loci, an In our deterministic simulations, when the middle
locus (the B locus) had the new selected mutant, the assertion that is contradicted by the fraction of deter-ministic runs of Tables 1 and 2 in which a signal appears CDV method gave correct inferences in a large majority
of runs. It is difficult to put this attractive result into at an unselected terminal locus. It further seems possible that a generalization of our analytical approach, which practice in the inference setting, because a signal for
apparent selection at the B locus could indeed reflect relaxes assumptions about position, could show that inferences about terminal loci may not be reliable in selection at the locus or could be a false signal of the
infer-TABLE 4
Ethnic German sample haplotypes with signal for selection
Haplotype D D9 D″ d
(D6S265-123) HLAF39-206 MOGc-130 0.123 0.676 0.626 0.050
D6S265-123 (HLAF39-206) MOGc-130 0.103 0.661 0.405 0.256
D6S265-123 HLAF39-206 (MOGc-130) 0.131 0.816 0.780 0.036
(D6S265-131) HLAF39-208 MOGc-132 0.098 0.767 0.665 0.102
D6S265-131 (HLAF39-208) MOGc-132 0.122 0.767 0.767 0.000
D6S265-131 HLAF39-208 (MOGc-132) 0.089 0.635 0.420 0.215
(D6S265-127) HLAF39-202 MOGc-148 0.099 0.929 0.929 0.000
D6S265-127 (HLAF39-202) MOGc-148 0.079 0.781 0.698 0.083
D6S265-127 HLAF39-202 (MOGc-148) 0.122 0.648 0.633 0.015
Three-locus haplotypes of the ethnic German sample (2n5140) that satisfy criteria 1 or 2. Pairwise D and
D9are given for the two-locus haplotype in each row composed of the alleles not in parentheses. D″is calculated
for the same haplotype under the constraints imposed by the allele in parentheses.dis the difference|D9|2
|D″|. Thedfor each haplotype that indicates possible hitchhiking, according to the CDV method, is underlined.
inferences about the location of selected mutants; on nance mode tends to preserve extant variation). Two such loci will return to neutral frequency and phase this point we depart fromRobinsonet al. (1991a).
The stochastic simulations showed that patterns of equilibria, respectively, at rates 12 1/2N, the rate of loss of heterozygosity at either locus (with N the effective linkage disequilibrium conforming to criteria 1 or 2 are
uncommon for 4Nc$10 and highly unusual for 4Nc as population size; see, e.g.,CrowandKimura1970), and
12c21/2N, the rate of decay of linkage disequilibrium large as 100. Here, we think there is potential inference
value in the CDV method, because a simple neutral between the loci (for the random union of gametes model, where c is the recombination rate;Hill1974).
model can apparently be ruled out if either criteria 1
or 2 is met in a moderate-sized sample, with 4Nc on the In the selective sweep case, if a neutral allele fixes with the new mutant, the time until polymorphism could be order of 100. At this point, other nonselective alternative
hypotheses (such as the neutral model with population reestablished at the neutral locus is on the order of 1/m, wheremis the neutral mutation rate (Crowand
structure or migration) cannot immediately be ruled
out; this requires work beyond our current scope. Kimura1970). If either overdominant or favored
mu-tants reoccur in a particular region over relatively short Although we do not think that CDV can very
accu-rately distinguish the particular locus that has the se- time scales, and the recovery of linkage equilibrium or polymorphism is inadequate, reperturbation by succes-lected allele, we do think that CDV can be used to screen
for fairly localized regions that may have a recent history sive hitchhiking events may not be detectable. Even if selected mutants appear only rarely, the availability of of hitchhiking (in general agreement withRobinsonet
al. 1991a). The basic requirements appear to be that adequate polymorphism at closely linked sites, on which
linkage disequilibrium could be recorded, may be in the terminal loci span at least a distance of 4Nc5 10
(with the third locus roughly intermediate), that there question; for ifu 5 4Nmis small, a majority of linked neutral sites will be monomorphic. We have further is a standard minimum level of heterozygosity H$0.095
at each locus, and that there is moderately strong, but claimed that disequilibrium created by hitchhiking is primarily connected to rare events in which selected not complete, linkage disequilibrium in the region.
Selected mutations and linked markers at equilib- mutants appear on low-frequency haplotypes. In partic-ular, these impediments suggest that in chromosomal rium: We now describe a simple model of recurrent
selected mutations and address some implications for regions thought to be subject to recurrent selective sweeps (Aguade´et al. 1989;BegunandAquadro1994,
CDV and similar methods. The simplest model assumes
that selected alleles arise at random points in the ge- 1995), the linkage disequilibrium that is indeed ob-served is primarily the result of mutational or other nome. If such events are rare, the influence of new
selected alleles on linked loci is transient: eventually the events that occurred since the most recent sweep. For tightly linked loci, patterns of linkage disequilib-new mutant reaches equilibrium, and recombination,
mutation, and genetic drift again dominate the dynam- rium conforming to criteria 1 or 2 persist approximately as long as the time required for the new mutant to reach ics of linked loci. Under this simple model, neutral
alleles linked to a new overdominant mutant will in- equilibrium (Thomson1977, and our deterministic
sim-ulations). If we assume strong selection and large N, crease in frequency and may reach high levels of
the population, the expected time until the new mutant not apply to microsatellite loci (see, e.g.,Valdeset al.
1993). However, the role of the mutation model, espe-fixes in the selective sweep model is approximately
cially given the time scale for mutational events relative to the duration of hitchhiking events, should be minor.
#
121/2N1/2N
2/sx(12 x) dx≈4
s ln(2N )
Finally, if the scaling of 4Nc is approximately correct, the chances under the neutral model that even one of
generations (Ewens 1973, 1979, p. 149). Here,
the D6S265/HLA-F39/MOGc haplotypes would meet
sx(1 2 x)/2 is the approximate deterministic change
the CDV criteria appear to be small. per generation in the frequency of a favored allele a,
We conclude that hitchhiking with one or more se-where fitnesses are wAA512 s/2, wAa 51, waa5 11
lected alleles, closely linked to the D6S265/HLA-F39/
s/2. Using the same reasoning in the symmetric
over-MOGc loci, is a plausible explanation for the patterns dominance model, with fitnesses wAA5 12s, wAa5 1,
of linkage disequilibrium observed in these haplotypes.
waa512s (so that the fitness differential between the
Three apparently distinct haplotypes meet criteria 1 or most extreme genotypes is s in both cases), the expected
2, suggesting that hitchhiking with overdominant alleles time for the new mutant to reach the interior
polymor-is the more likely scenario: the data would seem to phism is approximately
require otherwise that several favored alleles in the re-gion are simultaneously being selected for, or that an
#
1/221/2N1/2N
1/sx(12x)(122x) dx ≈3
s ln(22
1/3N )
ancestral haplotype bearing a favored allele has experi-enced several mutation events. We have also argued that generations. These persistence times can be small
rela-the loss of variation under rela-the selective sweep model tive to the times required for the recovery of linkage
poses a serious problem for observing disequilibrium, equilibrium or neutral levels of polymorphism. For
ex-making it unlikely that disequilibrium created specifi-ample, if N is 105, s50.01, andm 51025, the persistence
cally by selectively favored alleles would ever be ob-time for CDV-type patterns of linkage disequilibrium is
served. While we have scaled back previous efforts to ,5000 generations in the selective sweep model,
infer the precise location at which selection has acted, whereas if most extant variation is lost during the sweep,
our results are consistent with other work on selection in 105generations on average are required to reestablish
this region of the human genome (KlitzandThomson
polymorphism at monomorphic sites, and during this
1987;Sattaet al. 1994;ParhamandOhta1996). Our
period no new CDV-type patterns could be observed.
main intention in this example is to demonstrate that Human chromosome 6 haplotypes: In Table 4, we
evidence for historical selection processes may indeed showed three haplotypes of the D6S265/HLA-F39/
be found in the patterns of linkage disequilibrium we MOGc loci that met the CDV criteria for hitchhiking.
have focused on, in our investigation of the CDV HLA-F39 and MOGc are physically close, so we must
method. make a rough assessment of 4Nc between these loci if
we wish to compare the data with the neutral simulations We thank C. H. Langley, who read an earlier draft of the manuscript and made suggestions that led to substantial revisions. The human of Figure 4 and Table 3. Although there is apparently
chromosome 6 haplotypes were collected by L. Calandro and G. F. no family data that give precise estimates of the
recombi-Sensabaugh, who generously allowed us to use them here. We thank D. nation fraction between HLA-F39and MOGc, the physi- Cutler and A. D. Long for discussion and suggestions. An anonymous cal distance between these loci is known to be approxi- reviewer made suggestions that improved the presentation. This work mately 100–150 kb, based on YAC contig and STS maps was supported by National Institutes of Health grants HD-12731,
GM-56688, and 5 T32 GM-07127. (Mosseret al. 1997;Human Genome Data Base1997).
For estimation purposes, we will assume the distance is 100 kb and use N52000, perhaps a conservatively low
LITERATURE CITED
value for a modern European population. If we use the
crude conversion 1 Mb≈1.16 cM [obtained by observ- Aguade´ , M., N. MiyashitaandC. H. Langley,1989 Reduced
varia-tion in the yellow-achaete-scute region in natural populavaria-tions of ing that the genome size is equivalently 3200 Mb or
Drosophila melanogaster. Genetics 122: 607–615. 3702 cM in human females (The Human Transcript
Baur, M. P., and J. A. Danilovs, 1980 Population analysis of
Map 1996)], we conclude that 4Nc between HLA-F39 HLA-A, B, C and DR and other genetics markers, pp. 955–993 in Histocompatibility Testing 1980, edited byP. Terasaki.University
and MOGc is z9. Thus, the D6S265/HLA-F39/MOGc
of California, Tissue Typing Laboratory, Los Angeles. haplotype appears to span a distance over which criteria
Begun, D. J.,andC. F. Aquadro,1994 Evolutionary inferences from
1 or 2 are not commonly met in the simple neutral DNA variation at the 6-phosphogluconate dehydrogenase locus in natural populations of Drosophila: selection and geographic model. The setting here is not directly analogous to the
differentiation. Genetics 136: 155–171. null-model calculations of Figure 4 and Table 3 for two
Begun, D. J.,andC. F. Aquadro,1995 Evolution at the tip and
main reasons: (i) different three-locus marker haplo- base of the X chromosome in an African population of Drosophila melanogaster. Mol. Biol. Evol. 12: 382–390.
types may share an allele at one or more loci,
introduc-Crow, J. F.,andM. Kimura,1970 An Introduction to Population
Genet-ing dependencies not present in the simulated neutral
ics Theory. Burgess Publishing Co., Minneapolis.
haplotypes; (ii) it is well known that the “infinite alleles” Ewens, W. J.,1973 Conditional diffusion processes in population
Ewens, W. J.,1979 Mathematical Population Genetics. Springer-Verlag, Thomson, G.,1977 The effect of a selected locus on linked neutral
loci. Genetics 85: 753–788. Berlin.
Feder, J. N., A. Gnirke, W. Thomas, Z. Tsuchihashi, D. A. Ruddy Thomson, G.,andM. P. Baur,1984 Third order linkage
disequilib-rium. Tissue Antigens 24: 250–255. et al., 1996 A novel MHC class I-like gene is mutated in patients
with hereditary haemochromatosis. Nat. Genet. 13: 399–408. Valdes, A. M., M. SlatkinandN. B. Freimer,1993 Allele
frequen-cies at microsatellite loci: the stepwise mutation model revisited.
Feldman, M. W., I. FranklinandG. J. Thomson,1974 Selection
in complex genetic systems I. The symmetric equilibria of the Genetics 133: 737–749.
three-locus symmetric viability model. Genetics 76: 135–162. Communicating editor:G. B. Golding Geiringer, H.,1944 On the probability theory of linkage in
Mende-lian heredity. Ann. Math. Stat. 15: 25–57.
Golding, G. B.,1984 The sampling distribution of linkage
disequi-APPENDIX: THREE-LOCUS
librium. Genetics 108: 257–274.
DETERMINISTIC RECURSIONS
Grote, M. N.,1996 Models of genetic selection and the Human
Leukocyte Antigen loci. Ph.D. Thesis, University of California,
In the three-locus diallelic model, the eight haplotypes Berkeley.
(gametes) are ABC, ABc, AbC, Abc, aBC, aBc, abC, abc,
Hartl, D. L.,andA. G. Clark,1989 Principles of Population Genetics.
Sinauer Associates, Inc., Sunderland, MA. and their respective frequencies in a given generation
Hedrick, P. W.,1987 Gametic disequilibrium measures: proceed
are x1, . . . x8,
o
8i51xi 51. Letwith caution. Genetics 117: 331–341.
Hill, W. G., 1974 Disequilibrium among several linked neutral
genes in finite population I. Mean changes in disequilibrium. wi 5
o
8j51
wijxj i5 1, . . . 8,
Theor. Pop. Biol. 5: 366–392.
Hill, W. G.,1975 Linkage disequilibrium among multiple neutral
where wij is the fitness of the genotype formed from
alleles produced by mutation in finite populations. Theor. Pop.
Biol. 8: 117–126. haplotypes i and j, and let w5
o
8i51 wixi. After selection
Hill, W. G.,andB. S. Weir, 1988 Variances and covariances of
and recombination, the haplotype frequencies are given squared linkage disequilibria in finite populations. Theor. Pop.
Biol. 33: 54–78. by
Hudson, R. R.,1983 Properties of a neutral allele model with
intra-genic recombination. Theor. Pop. Biol. 23: 183–201. wx91 5w1x12r1a12r2b11r1r2g1
Hudson, R. R.,1985 The sampling distribution of linkage
disequilib-wx92 5w2x21r1a21r2b12r1r2g1 rium under an infinite allele model without selection. Genetics
wx93 5w3x31r1a31r2b21r1r2g2
109:611–631.
Human Genome Data Base, 1997 http://www.gdb.org wx9
4 5w4x41r1a42r2b22r1r2g2
The Human Transcript Map, 1996 http://www.ncbi.nlm.nih.gov/
wx95 5w5x51r1a11r2b32r1r2g1 SCIENCE96
wx96 5w6x62r1a22r2b31r1r2g1
Kaplan, N. L., R. R. HudsonandC. H. Langley,1989 The
“hitch-hiking effect” revisited. Genetics 123: 887–899. wx97 5w7x72r1a31r2b42r1r2g2
Klitz, W.,andG. Thomson,1987 Disequilibrium pattern analysis.
wx98 5w8x82r1a42r2b41r1r2g2, II. Application to Danish HLA-A and B locus data. Genetics 116:
633–643. where
Lauer, P., N. C. Meyer, C. E. Prass, S. M. Starnes, R. K. Wolffet
al., 1997 Clone-contig and STS maps of the hereditary hemoch- a
15w16x1x61w17x1x71w18x1x82w25x2x52w35x3x52w45x4x5
romatosis region on human chromosome 6p21.3-p22. Genome
a25w16x1x62w25x2x52w27x2x72w28x2x81w36x3x61w46x4x6
Res. 7: 457–470.
Lewontin, R. C.,1964 The interaction of selection and linkage. I. a
35w17x1x71w27x2x72w35x3x52w36x3x62w38x3x81w47x4x7
General considerations; heterotic models. Genetics 49: 49–67.
a45w18x1x81w28x2x81w38x3x82w45x4x52w46x4x62w47x4x7
Lewontin, R. C.,1988 On measures of gametic disequilibrium.
Ge-netics 120: 849–852. b15w14x1x41w16x1x61w18x1x82w23x
2x32w25x2x52w27x2x7
Maynard-Smith, J.,andJ. Haigh,1974 The hitch-hiking effect of
b25w14x1x42w23x2x32w36x3x62w38x3x81w45x4x51w47x4x7
a favourable gene. Genet. Res. 23: 23–35.
Mosser, J., A. M. Jouanolle, G. Gandon, N. Andrieux, A. Hampe b
35w16x1x62w25x2x51w36x3x62w45x4x52w58x5x81w67x6x7
et al., 1997 A YAC contig and an STS map spanning at least 3.9 b
45w18x1x82w27x2x71w38x3x82w47x4x71w58x5x82w67x6x7
megabasepairs telomeric to HLA-A. Immunogenet. 45: 447–451.
g152w16x1x61w18x1x822w25x2x52w27x2x71w36x3x62w45x4x5
Ohta, T.,andM. Kimura, 1975 The effect of a selected linked
locus on heterozygosity of neutral alleles (the hitchhiking effect). g
25w18x1x82w27x2x71w36x3x612w38x3x82w45x4x522w47x4x7.
Genet. Res. 25: 313–325.
Parham, P.,andT. Ohta,1996 Population biology of antigen
pre-To complete one generation, we need only introduce sentation by MHC class-I molecules. Science 272: 67–74.
mutation, which is unidirectional from a, b, and c to A,
Robinson, W. P., A. Cambon-Thomsen, N. Borot, W. Klitzand
G. Thomson,1991a Selection, hitchhiking and disequilibrium B, and C, respectively, all at ratemper generation. After
analysis at three linked loci with application to HLA data. Genetics
mutation, the haplotype frequencies are 129:931–948.
Robinson, W. P., M. A. AsmussenandG. Thomson,1991b
Three-x″1 5 x911 m(x92 1x93 1x95)1 m2(x94 1x96 1x97)1 m3x98 locus systems impose additional constraints on pairwise
disequi-x″2 5 (12 m)x92 1 m(12 m)(x94 1 x96)1 m2(1 2 m)x98 libria. Genetics 129: 925–930.
Satta, Y., C. O’huigen, N. TakahataandJ. Klein,1994 Intensity x″
3 5 (12 m)x93 1 m(12 m)(x491 x97)1 m2(1 2 m)x98
of natural selection at the major histocompatibility complex loci.
x″4 5 (12 m)2x94 1 m(12 m)2x98 Proc. Natl. Acad. Sci. USA 91: 7184–7188.
x″5 5 (12 m)x95 1 m(12 m)(x96 1 x97)1 m2(1 2 m)x98
Sensabaugh, G.F., L.Calandro, T. Thorsen, L.Barcellos, J.
Griggset al., 1996 Commentary. Blood Cells Mol. Dis. 22: 194a– x″
6 5 (12 m)2x691 m(12 m)2x98
194b.
x″7 5 (12 m)2x97 1 m(12 m)2x98
Stephan, W.,andC. H. Langley,1989 Molecular genetic variation
x″8 5 (12 m)3x98. in the centromeric region of the X chromosome in three
Drosoph-ila ananassae populations. I. Contrasts between the vermillion and