ABSTRACT
ABBASIAN HOSSEINI, SEYED ALIREZA. Social and Engineering Aspects of
Construction Site Management using Simulation and Social Network Analysis. (Under the direction of Dr. Min Liu and Dr. Simon Hsiang.)
The crews/actors/subs during a construction project make relationship and communicate with each other on the jobsite primarily when they work in a task sequence or when they work in the same working area at the same time. These interdependencies can have various impacts on their performance, the decisions their supervisor make and their action from both engineering and social aspects. The main focus of the past research is on the project parties’ relationship based on the information exchange and formal communication, while the research pertaining to the interpretation and investigation of the construction crews/trades’ interdependencies during the construction project is very limited. How are the construction jobsite actors connected in a construction jobsite? How do the existing interdependencies among them affect their performance? And how can understanding these interdependencies be beneficial for construction site managers? The primary goal of this research is to better understand the existing interdependencies among the construction crews/trades/subs and its impact. Particularly, the objectives of this research are to: 1) develop the jobsite social network of construction crews/trades and quantify its impact, 2) investigate the impact of social conformity on the performance of construction crews/trades, 3) identify the improvement direction (benchmarks) for inefficient construction crews/trades, and 4) investigate the cost/benefit of low or high reliable construction crews/trades and to develop a new educational version of Parade Game.
ii
impact through the network centrality analysis. The results of a case study are presented. Then, SNA and social norm analysis are combined as a method to measure conformity, one of the main social network influences types that results in a change of performance/behavior in order to fit in a group, at construction crew/trade level and demonstrate how it can play role in the performance of crews/trades/subs particularly in their work plan reliability through two case studies. Then, inspired by social learning phenomenon, data envelopment analysis and SNA is combined to develop a procedure that can identify the improvement direction for the inefficient crews/trades/subs in a construction project. At the end, the research concentrates on the engineering aspects of the jobsite interdependencies by developing a simulation model, as a new educational version of Parade Game, that uses different variability levels and the corresponding costs at different work stations to investigate the relationship between the interdependencies and crews/trades’ variability/reliability.
Results demonstrate that the performance of construction crews/trades is under the influence of the social aspect of the interdependencies as well as the engineering aspect. They show that there is an association between influences a crew/trade/sub receives from the network and his/her performance. Results of case studies show that the subcontractors follow the performance norm in the project and their tendency to follow the norms of their neighborhood is higher than their willingness to follow the project norm. Parade Game simulation results also show that the production will enhance if the reliability increases and the investment made to improve reliability will return in most of the scenarios.
iii
ii
Social and Engineering Aspects of Construction Site Management using Simulation and Social Network Analysis
by
Seyed Alireza Abbasian Hosseini
A dissertation submitted to the Graduate Faculty of North Carolina State University
in partial fulfillment of the requirements for the Degree of
Doctor of Philosophy
Civil Engineering
Raleigh, North Carolina
2015
APPROVED BY:
_______________________________ ______________________________
Dr. Min Liu Dr. Simon M. Hsiang
Committee Co-Chair Committee Co-Chair
________________________________ ________________________________
ii
DEDICATION
iii BIOGRAPHY
iv
ACKNOWLEDGMENTS
There are several individuals I would like to acknowledge. First and foremost, I want to acknowledge my two advisors, Dr. Min Liu and Dr. Simon M. Hsiang for their guidance, patience, motivation, encouragement, and immense knowledge not only on my research but also on my life and mental growth. Secondly, I would like to thank my committee members, Prof. Michael L. Leming, and Prof. Edward J. Jaselskis for their invaluable recommendations.
Part of this dissertation research was conducted with the financial support of the Lean Construction Institute (LCI). LCI is a non-profit organization operates as a catalyst to transform the industry through lean project delivery with the goal of increasing owner and construction supply chain satisfaction. I wish to acknowledge LCI and its founder, Prof. Gregory Howell for their support and collaboration.
Next, I would like to thank the other staff and faculty members of the North Carolina State University Civil, Construction, and Environmental Engineering Department who have taught and assisted me in various ways during my studies. I also extend my thanks to the current and former colleagues: Dr. Marion (Mark) Russell, Ashtad Javanmardi, and Rabia Omer. I also appreciate the help from my friends in Mann Hall, Dr. Amirhossein Norouzi, Behrooz Keshavarzi, and Mehdi Mashayekhi.
i
TABLE OF CONTENTS
LIST OF TABLES...... iv
LIST OF FIGURES ...... vi
INTRODUCTION ... 1
CHAPTER 1 1.1 Introduction ... 1
1.2 Research Objectives... 6
1.2.1 Research Objective 1: To Develop the Jobsite Social Network of Construction Crews and Quantify its Impact on Performance (a Case Study) ... 7
1.2.2 Research Objective 2: To Investigate the Impact of Social Conformity on the Performance of Construction Crews. ... 8
1.2.3 Research Objective 3: To Identify the Improvement Direction (Benchmarks) for Inefficient Construction Crews ... 9
1.2.4 Research Objective 4: To Investigate the Cost/Benefit of Low or High Reliable Construction Crews and Develop a New Educational Version of Parade Game ... 11
1.3 Research Scope ... 13
1.4 Research Significance ... 14
1.5 Research Outline ... 15
RESEARCH BACKGROUND ... 17
CHAPTER 2 2.1 Social Network Analysis... 17
2.1.1 Social Conformity: Tendency to Match Group Norm... 18
2.1.2 Social Learning: Learning from Others ... 19
2.1.3 Construction Research Pertaining to Social Network Analysis ... 20
2.2 Benchmarking through Data Envelopment Analysis (DEA) ... 26
2.2.1 DEA in Construction Industry: Identify Performance Benchmarks (Role Model) ... 27
2.3 Production Capacity Variability/Reliability and Construction Work Plan Variation/Reliability ... 28
2.3.1 Unstable Work Flow, Consequence of Work Plan Variation and Production Capacity Variability ... 28
2.3.2 Parade Game: Demonstrate the Impact of Variability in Construction Project.. 29
2.3.3 Investment on Planning to Improve Construction Work Plan Reliability and Consequence ... 31
2.4 Identified Gaps in the Body of Knowledge ... 32
2.4.1 Identified Gaps in Construction Research Pertaining to SNA Application ... 32
ii
2.4.3 Identified Gaps in Construction Research Pertaining to Capacity
Variability/Reliability and Work Plan Variation/Reliability ... 34
2.4.4 Addressing the Identified Gaps ... 35
RESEARCH METHODOLOGY ... 36
CHAPTER 3 3.1 Methodology to Achieve Research Objective 1, To Develop the Jobsite Social Network of Construction Crews and Quantify its Impact on Performance (a Case Study) ... 36
3.2 Methodology to Achieve Research Objective 2, To Examine the Impact of Social Conformity on the Performance of Construction Crews ... 43
3.3 Methodology to Achieve Research Objective 3, To Identify the Improvement Direction (Benchmarks) for Inefficient Construction Crews ... 51
3.3.1 Conventional DEA Benchmarking ... 54
3.3.2 Social Network based DEA Benchmarking ... 55
3.4 Methodology to Achieve Research Objective 4, To Investigate the Cost/Benefit of Low or High Reliable Construction Crews and Develop a New Educational Version of Parade Game ... 59
RESEARCH EXECUTION AND ANALYSIS RESULTS ... 74
CHAPTER 4 4.1 Analysis Results and Discussion pertaining to Research Objective 1, To Develop the Jobsite Social Network of Construction Crews and Quantify its Impact on Performance (a Case Study) ... 74
4.1.1 Summary and Conclusion (Objective 1) ... 90
4.2 Analysis Results and Discussion pertaining to Research Objective 2, To Examine the Impact of Social Conformity on the Performance of Construction Crews .... 93
4.2.1 Results of First Case Study (Case Study 2) ... 93
4.2.2 Results of Second Case Study (Case Study 3) ... 105
4.2.3 Summary and Conclusion (Objective 2) ... 109
4.3 Analysis Results and Discussion pertaining to Research Objective 3, To Identify the Improvement Direction (Benchmarks) for Inefficient Construction Crews 112 4.3.1 Results of Conventional DEA benchmarking ... 115
4.3.2 Results of Social Network based DEA benchmarking... 118
4.3.3 Summary and Conclusion (Objective 3) ... 124
4.4 Analysis Results and Discussion pertaining to Research Objective 4, To Investigate the Cost/Benefit of Low or High Reliable Construction Crews and Develop a New Educational Version of Parade Game ... 126
4.4.1 Production Output... 126
4.4.2 Cost Output ... 138
4.4.3 Summary and Conclusion (Objective 4) ... 143
SUMMARY... 145
CHAPTER 5 5.1 Intellectual Merit and Broader Impact ... 148
FUTURE RESEARCH ... 150
iii
APPENDICES ... 164
APPENDIX A – ADJACENCY MATRICES OF CASE STUDY 1 ... 165
APPENDIX B – ADJACENCY MATRICES OF CASE STUDY 2 ... 221
APPENDIX C – ADJACENCY MATRICES OF CASE STUDY 3 ... 225
iv
LIST OF TABLES
Table 1.1. Tasks and responsible crews ... 2
Table 2.1. Summary of previous construction research pertaining to social network analysis ... 22
Table 3.1: Schematic adjacency matrix (ASN) for relationships of subcontractor crews... 38
Table 3.2. sub-scenarios based on the Arrangement and Cost Scenarios for Parade Game model ... 68
Table 3.3. A brief description of ARENA modules ... 70
Table 4.1. Centrality analysis results for the jobsite social network in Week 18... 82
Table 4.2. Work plan variation Analysis results for the Week 18 ... 83
Table 4.3. Correlation analysis results - weekly Centrality Ranks (CRs) versus weekly Variation Ranks (VRs) ... 89
Table 4.4. Correlation analysis results - monthly Centrality Ranks (CRs) versus monthly Variation Ranks (VRs) ... 90
Table 4.5. WPRI measurements for drywall subcontractor crew – Case Study 2 ... 94
Table 4.6. Adjacency matrix of Month 4 – Case Study 2 ... 96
Table 4.7. Correlation analysis results for the relationship between DFNN/DFPN and project time – Case Study 2... 104
Table 4.8. Correlation analysis results for the relationship between DFNN/DFPN and project time – Case Study 3... 108
Table 4.9. Summary of the Raw Data ... 113
Table 4.10. Eigenvalues and corresponding eigenvectors of the selected PCs ... 114
Table 4.11.The New Set of Data based on PCA ... 115
Table 4.12. Conventional benchmarks for the inefficient crews ... 117
Table 4.13. ASN of the specialty crews... 118
Table 4.14. Results of Conventional DEA versus SN-based DEA Benchmarking ... 123
Table 4.15. Comparison between the nine Parade Game Arrangement Scenarios – Completion Time (week) ... 137
v
vi
LIST OF FIGURES
Figure 1.1. A typical building project at construction phase (Tekla 2015) ... 2
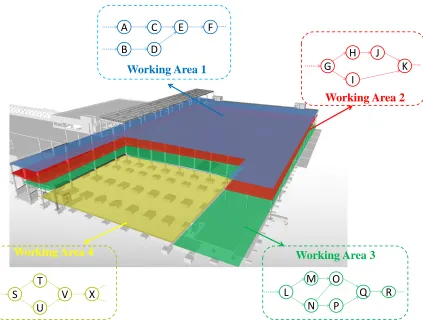
Figure 1.2. Dividing the project into different working areas and assign the tasks ... 3
Figure 1.3. Interdependencies among crews based on tasks sequence (engineering aspect) .... 3
Figure 1.4. Interdependencies among crews based on sharing the working area (social aspect) ... 4
Figure 1.5. Research design flow chart ... 16
Figure 3.1. Methodology steps to achieve Research Objective 1... 37
Figure 3.2. Schematic jobsite social network based on working space ... 40
Figure 3.3. Methodology steps to achieve Research Objective 2... 44
Figure 3.4. Methodology steps to achieve Research Objective 3... 52
Figure 3.5. Methodology steps to achieve Research Objective 4... 60
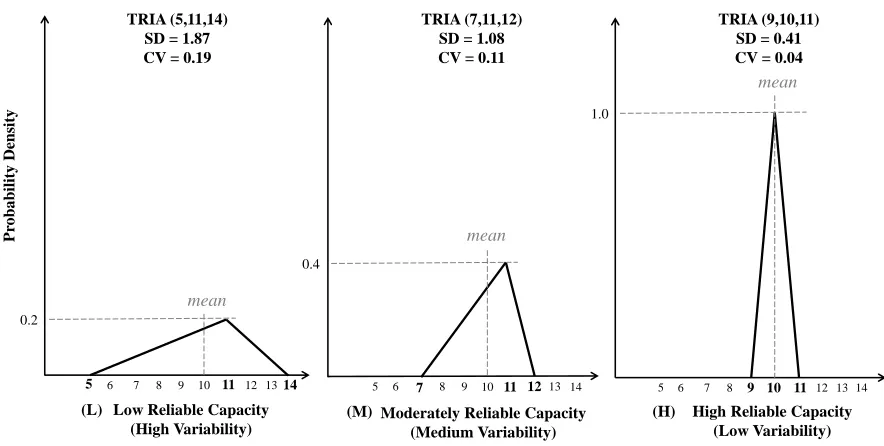
Figure 3.6. Triangular PDFs used to reflect various production capacity reliability (variability) levels in the model... 61
Figure 3.7. 9 Arrangement Scenarios for the Parade Game model ... 66
Figure 3.8. Parade Game (new version) simulation model by ARENA ... 69
Figure 3.9. The graphic animation screen of the Parade Game model ... 71
Figure 3.10. The graphic animation screen of the Parade Game model (Zoom in to Stations 1 and 2)... 72
Figure 4.1. Jobsite social network in Week 18 based on frequency ... 75
Figure 4.2. Jobsite social network in Week 18 based on severity ... 76
Figure 4.3. Jobsite social network topology over the course of the project (28 weeks) ... 78
Figure 4.4. Week-by-week consistency between Centrality and Variation Ranks for the “Painting” Crew ... 85
Figure 4.5. Week-by-week consistency between Centrality and Variation Ranks for the “Electrical” Crew ... 86
Figure 4.6. Month-to-month consistency between Centrality and Variation Ranks for the “Painting” Crew ... 87
vii
Figure 4.8. WPRI4 and ProjectNorm4 over time for drywall subcontractor crew – Case Study
2 ... 95
Figure 4.9. Social networks of the subcontractor crews over the course of the project – Case Study 2 ... 97
Figure 4.10. Deviation from project norms over time – Case Study 2 ... 101
Figure 4.11. Deviation from neighborhood norms over time – Case Study 2 ... 103
Figure 4.12. Trends of DFPN and DFNN over time – Case Study 2 ... 105
Figure 4.13. Social networks of the subcontractor crews over the course of the project – Case Study 3 ... 107
Figure 4.14. Trends of DFPN and DFNN over time – Case Study 3 ... 109
Figure 4.15. The specialty crews organized by social network ... 119
Figure 4.16. Steps of SN-based DEA benchmarking procedure for the “Finishing” crew (FI): (a) FI sub-SN; (b) FI sub-SN showing Relationship Score (RS); (c) FI sub-SN showing efficiency level; and (d) FI sub-SN showing Relative Efficiency Distance (RED)... 121
Figure 4.17. Practical benchmarks for the “Finishing” crew (FI) ... 122
Figure 4.18. Parade Game simulation model results – Replacing first station by a crew with a low/high reliable capacity ... 128
Figure 4.19. Parade Game simulation model results – Replacing middle station by a crew with a low/high reliable capacity ... 130
Figure 4.20. Parade Game simulation model results – Replacing last station by a crew with a low/high reliable capacity ... 132
1
INTRODUCTION
CHAPTER 1
1.1 Introduction
Research on the decision making process in construction has focused at the project level, where the contract documents specifying the responsibility and risk of each participant are the main basis for consideration. Although this formal decision making usually comes with clear objectives and boundaries, in practice, strict adherence to the formal procedures and chains of command would not always be possible without an unacceptable expenditure of time and money. In reality, it is the informal day-to-day or moment-to-moment decision making at the site level, usually led by a foreman/supervisor (the leader of a specialty trade, crew or subcontractor), that plays a key role in keeping a project’s tasks going without undue delay or the generation of undesirable cost.
2
for each of the areas describing the project tasks, their logical relationships and the crews responsible to perform them. Note that “crews” in this document refer to construction working crews that can belong to general contractor (GC), specialty trades, working parties or subcontractors of project. Table 1.1 and Figure 1.2 demonstrate a simplified version of this process. The interdependencies among the trades come from the task dependencies in each working area. These interdependencies among crews can be based on the tasks sequence, when they work in a task sequence with the production output of one being a prerequisite to the activity of another, that is the engineering aspect (see Figure 1.3), or based on sharing the working area, when they are supposed to work in the same working area at the same time, that is the social aspect (see Figure 1.4).
Figure 1.1. A typical building project at construction phase (Tekla 2015) Table 1.1. Tasks and responsible crews
Trades/Crews/Subs Tasks
Electrical A, H, K, V, N
Mechanical B, E, G, T, L, R
Plumbing D, F, J, U, O
Fire Protection I, X, P
3
Figure 1.2. Dividing the project into different working areas and assign the tasks
Figure 1.3. Interdependencies among crews based on tasks sequence (engineering aspect) Working Area 1
Working Area 2
Working Area 3
Working Area 4
S T
U
V X L
M
N O
Q P
R G
H
I J
K
A C
B
E F
D
Working Area 1
Working Area 3 Task Sequence Dependencies
Elec. Dryw. Mech. Plum.
Mech. Plum. Mech. Plum.
Working Area 2 Task Sequence Dependencies
Mech. Elec. Plum. Elec.
Mech. Fire P. Elec.
Mech. Dryw. Plum. Dryw. Mech.
Mech. Elec. Fire P. Dryw. Mech.
Mech. Elec. Plum. Dryw. Mech.
Task Sequence Dependencies Working Area 4
Task Sequence Dependencies
Dryw. Mech. Elec.
Plum.
Fire P.
4
Figure 1.4. Interdependencies among crews based on sharing the working area (social aspect)
The interdependencies of construction crews can impact their performance, the decisions their supervisors make and their action in various ways. For instance, when one crew fails to complete a task based on the schedule, follow-on crews in the task schedule are delayed in starting their portions of the project (Thomas and Flynn 2011). Or when two or more crews are supposed to work in the same working area at the same time, there would be a potential of conflict due to inadequate working spaces or work area access, overcrowding jobsite, safety hazards, etc. and subsequently loosing productivity (Gou 2002, Thomas et. al.
Working Area 1
Working Area 3 Working area Dependencies
Working Area 2 Working area Dependencies
Working area Dependencies
Working Area 4
Working area Dependencies
Mech. Dryw.
Dryw.
Plum. Elec.
Fire P. Elec.
Dryw.
Mech.
Plum. Elec.
Plum.
Fire P.
Project
Working area Dependencies
Dryw.
Plum. Elec.
Fire P.
5
2006, Watkins et al. 2009). This impact can easily go beyond the project task and space dependencies in large and complex construction projects, especially when there are several independent subcontractors working on a jobsite at the same time. For instance, when a subcontractor finds a project unreliable (for example when he/she sees that other subcontractors are not going to finish their tasks on time), he/she ma y decide to take his/her resources to another job, since subcontractors work often on multiple projects simultaneously to keep their workload at the maximum level in order to have a supply of available work and maximize profitability at any given time (Sacks 2004, Thomas and Flynn 2011, Freeman and Seppanen 2014).
Social Network Analysis (SNA), introduced by Moreno (1960) is a methodology to determine the conditions of social structures by investigating the relations and interrelationships of a set of actors (De Nooy et al. 2005). The interdependencies between crews in a construction project constitute a social network, which can be analyzed and interpreted via SNA (refer to Figure 1.4). It is arguable that understanding the jobsite social network can help the construction site managers to coordinate the crews more effectively and succeed in the challenging environment of projects; however, achieving this skill takes years of experience and few superintendents could articulate it (Wambeke et al. 2012 & 2014).
6
interpretation of the dependencies among the construction crews during construction has not been well documented in industry handbooks or academic research work. Specifically, 1) How are the construction site actors connected in a construction jobsite? 2) How much do the existing interdependencies among them affect their performance? 3) Which crews influence the others more and which are more under the influence of the others? 4) How can knowing the jobsite social network be beneficial for construction site managers? Answering these questions requires understanding the interdependencies of construction crews and analyzing their underlying jobsite social network during construction projects. This research contributes to the body of knowledge as it uses systematic and applicable approaches/procedures to quantify the jobsite social network impact and demonstrate how the interdependencies play a role in the performance of the construction crews over the course of a project. The results of a few case studies are also discussed.
1.2 Research Objectives
7
Research Objective 1: To develop the jobsite social network of construction crews and quantify its impact on performance (a case study)
Research Objective 2: To examine the impact of social conformity on the performance of construction crews.
Research Objective 3: To identify the improvement direction (benchmarks) for inefficient construction crews.
Research Objective 4: To investigate the cost/benefit of low or high reliable construction crews and develop a new educational version of Parade Game.
1.2.1 Research Objective 1: To Develop the Jobsite Social Network of Construction Crews and Quantify its Impact on Performance (a Case Study)
8
time difference between what was planned and what occurred), is explored through a case study.
1.2.2 Research Objective 2: To Investigate the Impact of Social Conformity on the Performance of Construction Crews.
9
most unreliable party in the project because of fear of being punished (or sued) by the GC or other subs. To summarize, it can be argued that a subcontractor usually decides to slow down or speed up their pace based on the interdependencies he/she has with other subcontractors, and therefore, as the project proceeds, he/she tries to sync up with the project norm.
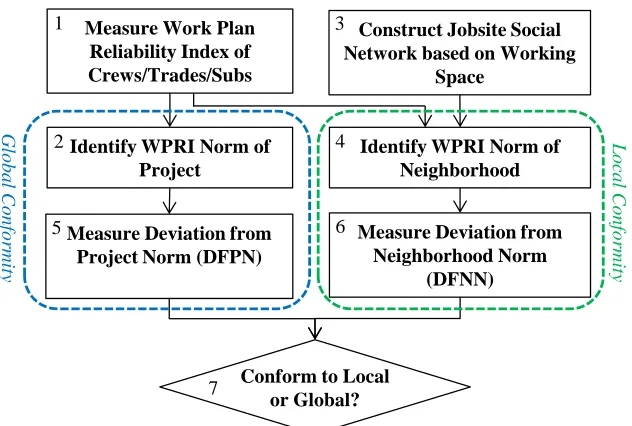
Conformity, also known as herding behavior, is one of the influences of being in a social network. It refers to the tendency of changing behavior (or performance) in order to fit in a group and converge to the group norms (Asch 1951). To reach the second objective, this research develops an analytical approach to 1) measure the performance norm (particularly their work plan reliability (WPR) norm) of a project and neighborhood combining SNA and conformity concept, 2) demonstrate how conformity impacts the performance of crews through their relationships, and 3) identify the role of social network in conformity occurrence in construction projects. The results of two case studies are also discussed.
1.2.3 Research Objective 3: To Identify the Improvement Direction (Benchmarks) for Inefficient Construction Crews
10
hotel can utilize the experience of other hotels to increase its knowledge of effective customer service (Argote et al. 2000).
Learning from others can happen in any small or large social context (such as organization or workplace) through observation and socialization; a construction project is not an exception. Besides the inherent tendency of humans to learn from others’ experiences (Bikhchandani et al. 1998), two more specific reasons can be identified for the construction crews to sometimes learn from each other’s practices. First, they need to continually improve their management skills and performance to exist and emulate in the dynamic market of construction (Luu et al. 2008). Second, to achieve the highest performance level by a crew, learning the best practices from the best-performing crews can be a quicker, simpler, and often more reliable way compared with the traditional way (utilizing its own experience, identification of problems, analyzing the available solutions, investigating the right possible practices). Learning from others reduces the cost of individual learning and avoids the risk of false identifications of problems and effort and risk of trial-and-error learning.
11
performance, making a weekly work plan, controlling cost and time estimation, training the workers, and preparing reports. The similarities of the crews’ objectives and challenges in one hand and the previously mentioned reasons on the other hand bring about the opportunity for the crews to observe, learn from, and implement the other crews’ practices in their own decisions and practices. Selecting a proper method for safety enhancement or implementing a low-cost strategy to meet the equipment emission standards of the EPA can be the examples of those decisions made based on the practices of other good performers.
Based on social learning phenomenon, this research proposes a procedure that combines DEA (assessing the relative efficiency of DM units) and SNA to identify the improvement direction (called benchmarks in this research) for the inefficient crews in a construction project. The procedure is called Social Network based Data Envelopment Analysis (DEA) Benchmarking Procedure (SDBP). The implementation of the proposed procedure is shown through a case study.
1.2.4 Research Objective 4: To Investigate the Cost/Benefit of Low or High Reliable Construction Crews and Develop a New Educational Version of Parade Game
12
without variation. A work flow can be managed effectively by promoting work plan reliability through better planning strategies (Tommelein et al. 1999, Ballard 2000, Thomas et al. 2002, Liu et al. 2011).
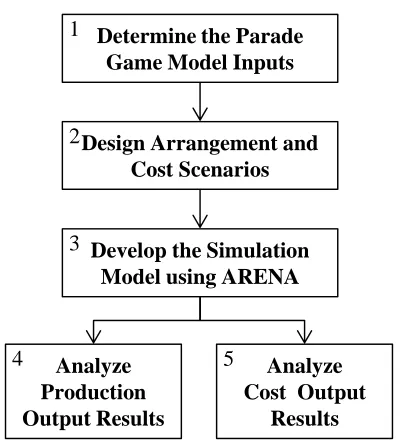
Variability in this study is defined as the deviation of production capacity from an expected average. When a production capacity is reliable, it means that it is within the expected range (no variability). The Parade Game is a construction management educational tool demonstrating the effects of interdependency and variability in construction projects. This research extends the original version of the Parade Game by developing a simulation model that uses probability distribution functions (PDFs) instead of the die to determine the variability level, is able to get different variability levels at different stations, and analyze the outcome from cost standpoint (in addition to the production standpoint). The aim is to first identify the consequence of having crews with high or low reliable capacity at early, middle or late stations and then, explore how the capacity reliability improvement (variability reduction) can benefit the production and cost of the trades and project.
13
the relationships of the crews with different variability levels and its impact on project production and cost.
1.3 Research Scope
In construction there exist multiple participants from the beginning to the completion of a project. Owners, architects and engineers, general contractors, sub or trade contractors, suppliers and all their project managers, superintendents, and foremen/supervisors contribute to complete a project. During construction, many official/unofficial relationships are made among these actors. In addition, the complex nature of construction processes involves the actors in many inevitable interdependencies. Although they are all important areas for research, the concentration of this research is on the existing interactions/relationships/interdependencies among the various specialty crews in a construction jobsite.
14
1.4 Research Significance
Illustration and analysis of social network of construction crews during construction has not been well documented in industry handbooks or academic research work. This research looks at interdependencies and relationships of construction crews from an exclusively new analytical perspective. Understanding the underlying social network of the construction site will help project managers to control it through better planning and leadership, consequently increasing the jobsite productivity. The process of network development and analysis is explained step by step, so it can be repeated in any project.
The construction industry lacks a sound understanding of the social aspect of work plan reliability. All the previous research focused on the task-dependency impact of the reliability. This research, for the first time, proposes social network based approaches to quantify two of the most important social network influences, i.e. social conformity (Objective 2) and social learning (Objective 3).
Some research exists on benchmarking in the construction industry, most of the researchers attempted to find the best improvement direction at the level of construction companies (companies learn from each other) while less attention has been paid to the topic of benchmarking at the level of construction site crews in a single project. The combination of the Data Envelopment Analysis (DEA) and SNA is discussed for the first time (Objective 3) as a network-based benchmarking procedure for construction crews.
15
educators/students to help them comprehensively understand all the aspects of variability, variation and reliability in a construction production system. The simulation model inputs (like cost and variability inputs) are adjustable, so the model provides the opportunity to the construction educators/students to create and examine their own scenario(s) and explore the outputs.
1.5 Research Outline
16
Figure 1.5. Research design flow chart
Identify WPRI Norm of Project
Construct Jobsite Social Network based on Working
Space Measure Work Plan
Reliability Index of Crews/Trades/Subs
Identify WPRI Norm of Neighborhood
1 3
2
Measure Deviation from Project Norm (DFPN)
4
5 Measure Deviation from Neighborhood Norm
(DFNN)
Conform to Local or Global?
6
7
Principal Component Analysis on Inputs and Outputs Determine Data of Inputs/Outputs
Run basic DEA
Construct Jobsite Social Network of Crews/Trades/Subs based on Communication
Measure Relative Efficiency Distances by DEA on sub-SNs
Measure Relationship Scores
based on sub-SNs
Identify Practical Benchmark(s) Identify DEA Benchmark(s)
Research Objective 1
1 2 3 4 5 6 7 8
Calculate the Variation Ranks for each of Crews/Trades/Subs Construct Jobsite Social Network
of Crews/Trades/Subs based on Working Space
Measure Work Plan Variation of Crews/Trades/Subs
Conduct Centrality Analysis to Calculate Network Frequency and Severity Centrality Ranks
3 1
4
Run Correlation Analysis between Variation Ranks and
Centrality Ranks
2
5
Develop the Simulation Model using ARENA Determine the Parade
Game Model Inputs
1
3
Design Arrangement and Cost Scenarios 2 Analyze Production Output Results 4 Analyze
Cost Output Results
5
Research Objective 2
Research Objective 3 Research Objective 4
Literature Review
Construction Research Pertaining to Social Network Analysis, Benchmarking (DEA), Variability/Reliability and Dependency of crews, and Parade Game
Data Collection
Collect general project information, crews/trades/subcontractor performance report and work plan progress report in case studies Collect feedback from construction experts
17
RESEARCH BACKGROUND
CHAPTER 2
2.1 Social Network Analysis
SNA is a mixture of sociology, IT, and mathematics (Pryke 2012). SNA, introduced by Moreno (1960), has been known as a methodology to determine the conditions of social structures by investigating the interactions, relations and interrelationships of a set of actors (nodes) (De Nooy et al. 2005, Park et al. 2011). A social network refers to a pattern of ties that exist among different entities (nodes) such as countries, states, organizations, etc. The ties matters in social network studies, because they can affect the entities (nodes) as they transmit behavior, information, attitude, etc. SNA provides the methodology to analyze the relationship and conceptualize the social networks (De Nooy et al. 2005). While classic SNA research has concentrated on sociological networks, it has been applied to many research fields (such as aerospace equipment, automotive bodies, and computer and office equipment) with the goal of investigating various relationships among organizations and individuals (Park et al. 2011).
18
visualization techniques is providing researchers with the ability to isolate relationships and visualize network principles such as dominance, centrality, and egocentricity, and graphically present results that were previously limited to mathematical matrices (Chinowsky et al. 2011).
2.1.1 Social Conformity: Tendency to Match Group Norm
Conformity, also known as herding behavior, is one of the important influences of being in a social network. It refers to the tendency of changing behavior (or performance) in order to fit in a group and converge to the group norms (Asch 1951). The group norms emerge out of interaction with the others in the social network. A wide variety of research shows that the behavior of others in our social environment shapes our response to a situation. Indeed, watching others in the social network provides information about the normal behavior in different novel or ambiguous situations (Cialdini and Trost 1998, Javarone 2014, Buechel et al. 2015).
19
According to the best of our knowledge in the relevant literature, there is not any research found on exploring the social conformity impact in construction project.
2.1.2 Social Learning: Learning from Others
Social learning, as one of the important social network influences, focuses on the learning that occurs within a social context. It considers how people learn from one another, encompassing such concepts as observational learning, imitation, and modeling (Vives 1996, Banerjee 1992, Gubanov et al. 2011). Indeed, people do learn from other people in the network, most particularly from their actions to avoid the costs, in terms of effort and risk, of trial-and-error learning and leapfrog directly to adaptive behaviors (Vives 1996, Henrich and Boyd 2001). Buying the most popular brands, patronizing well-attended restaurants by tourists, and purchasing bestsellers by readers are examples of social learning (Vives 1996).
20
Thompson (2001) studied learning from other’s experiences in World War II shipbuilding. Lamberson (2010) analyzed a model of social learning in a social network in the case of deciding whether or not to adopt a new technology. McFadden and Train (1996) investigated the implications of learning from others on the sales of new products and the impact of advertising.
According to the best of our knowledge in the relevant literature, there is not any construction research found on social learning in construction projects.
2.1.3 Construction Research Pertaining to Social Network Analysis
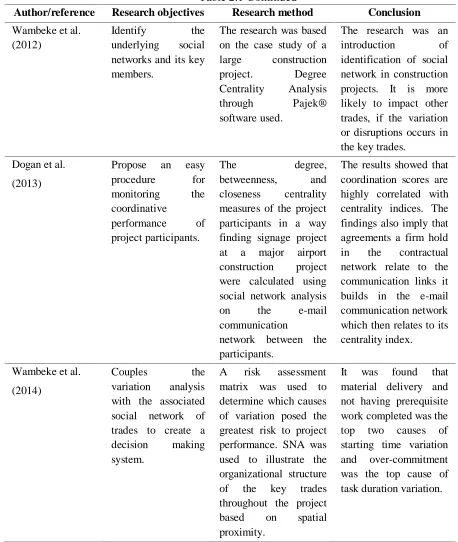
SNA has become important within the engineering and construction field recently due to significant attention to some concepts such as trust and communication between project participants (Chinowsky et al. 2008). Wambeke et al. (2012) believed that an underlying social network of trades exists in a construction project and its recognition can contribute to project success by helping the construction site managers to coordinate the trades effectively. Pryke et al. (2011) believed that although project management research increasingly turns to the social sciences for the interpretation of issues related to construction, SNA’s use in construction research is still rather limited.
21
other research endeavor, SNA is suggested for use with learning dynamics and building information modeling (BIM) (Taylor et al. 2009). Chinowski et al. (2010), through some case studies, demonstrates the need to introduce the social network model into project organization development. Chinowski et al. (2011) used SNA to assess project effectiveness by focusing on the alignment of actual stakeholder knowledge exchange with knowledge exchange requirements defined by task relationships. Park et al. (2011) investigated the formation and impact of construction firms’ collaborative networks for performing international projects, using an SNA approach. Dogan et al. (2013) attempted to assess the coordination performance of a construction project based on the centrality measures of e-mail communication network.
22
management problems and potential technology interfaces by analyzing job-site social networks and found that the order-management network has the highest degree of social density. Priven and Sacks (2015) explored how Last Planner system strengthens the project social network by building relationships among construction teams.
Table 2.1 summarizes the main social network research done in construction project management field.
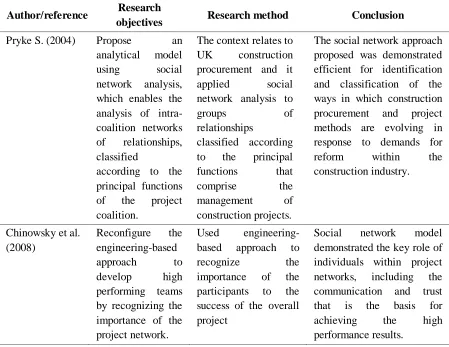
Table 2.1. Summary of previous construction research pertaining to social network analysis
Author/reference Research
objectives Research method Conclusion
Pryke S. (2004) Propose an
analytical model
using social
network analysis, which enables the analysis of intra-coalition networks of relationships, classified
according to the principal functions of the project coalition.
The context relates to
UK construction
procurement and it
applied social
network analysis to
groups of
relationships
classified according to the principal
functions that
comprise the
management of
construction projects.
The social network approach proposed was demonstrated efficient for identification and classification of the ways in which construction procurement and project methods are evolving in response to demands for
reform within the
construction industry.
Chinowsky et al. (2008)
Reconfigure the engineering-based
approach to
develop high
performing teams by recognizing the importance of the project network.
Used
engineering-based approach to
recognize the
importance of the participants to the success of the overall project
Social network model
demonstrated the key role of individuals within project networks, including the communication and trust that is the basis for
achieving the high
23
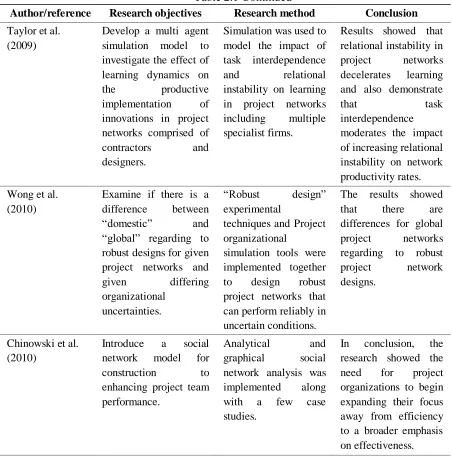
Table 2.1 Continued
Author/reference Research objectives Research method Conclusion
Taylor et al. (2009)
Develop a multi agent simulation model to investigate the effect of learning dynamics on
the productive
implementation of
innovations in project networks comprised of
contractors and
designers.
Simulation was used to model the impact of task interdependence
and relational
instability on learning in project networks including multiple specialist firms.
Results showed that relational instability in
project networks
decelerates learning and also demonstrate
that task
interdependence moderates the impact of increasing relational instability on network productivity rates.
Wong et al. (2010)
Examine if there is a difference between
“domestic” and
“global” regarding to robust designs for given project networks and
given differing
organizational uncertainties.
“Robust design”
experimental
techniques and Project organizational
simulation tools were implemented together to design robust project networks that can perform reliably in uncertain conditions.
The results showed
that there are
differences for global
project networks
regarding to robust
project network
designs.
Chinowski et al. (2010)
Introduce a social network model for
construction to
enhancing project team performance.
Analytical and
graphical social
network analysis was implemented along with a few case studies.
24
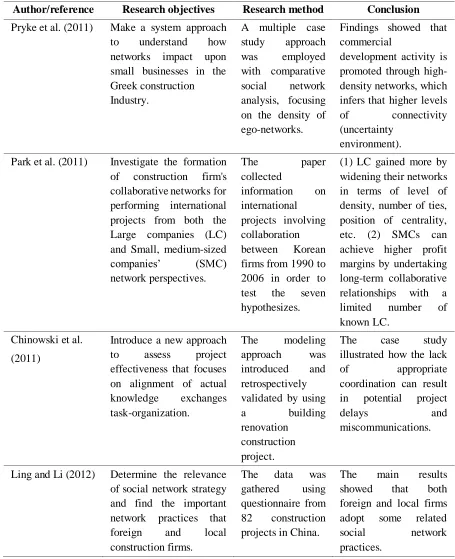
Table 2.1 Continued
Author/reference Research objectives Research method Conclusion
Pryke et al. (2011) Make a system approach
to understand how
networks impact upon small businesses in the Greek construction Industry.
A multiple case study approach
was employed
with comparative social network analysis, focusing on the density of ego-networks.
Findings showed that commercial
development activity is promoted through high-density networks, which infers that higher levels
of connectivity
(uncertainty environment).
Park et al. (2011) Investigate the formation of construction firm's collaborative networks for performing international projects from both the Large companies (LC) and Small, medium-sized
companies’ (SMC)
network perspectives.
The paper
collected
information on international projects involving collaboration between Korean firms from 1990 to 2006 in order to test the seven hypothesizes.
(1) LC gained more by widening their networks in terms of level of density, number of ties, position of centrality, etc. (2) SMCs can achieve higher profit margins by undertaking long-term collaborative relationships with a limited number of known LC.
Chinowski et al.
(2011)
Introduce a new approach
to assess project
effectiveness that focuses on alignment of actual
knowledge exchanges
task-organization.
The modeling
approach was
introduced and retrospectively validated by using
a building
renovation construction project.
The case study
illustrated how the lack
of appropriate
coordination can result in potential project
delays and
miscommunications.
Ling and Li (2012) Determine the relevance of social network strategy and find the important network practices that
foreign and local
construction firms.
The data was
gathered using questionnaire from 82 construction projects in China.
The main results
showed that both
foreign and local firms adopt some related
social network
25
Table 2.1 Continued
Author/reference Research objectives Research method Conclusion
Wambeke et al. (2012)
Identify the
underlying social networks and its key members.
The research was based on the case study of a large construction
project. Degree
Centrality Analysis
through Pajek®
software used.
The research was an
introduction of
identification of social network in construction projects. It is more likely to impact other trades, if the variation or disruptions occurs in the key trades.
Dogan et al.
(2013)
Propose an easy
procedure for
monitoring the
coordinative
performance of
project participants.
The degree,
betweenness, and
closeness centrality measures of the project participants in a way finding signage project at a major airport construction project were calculated using social network analysis
on the e-mail
communication
network between the participants.
The results showed that coordination scores are highly correlated with centrality indices. The findings also imply that agreements a firm hold in the contractual network relate to the communication links it builds in the e-mail communication network which then relates to its centrality index.
Wambeke et al.
(2014)
Couples the
variation analysis with the associated social network of trades to create a
decision making
system.
A risk assessment matrix was used to determine which causes of variation posed the greatest risk to project performance. SNA was used to illustrate the organizational structure of the key trades throughout the project
based on spatial
proximity.
26
Table 2.1 Continued
Author/reference Research objectives Research method Conclusion
Lin (2014) Discover the
underlying job-site management
problems and
potential technology
interfaces by
analyzing three job-site social networks.
Establish the order-management,
technical-consultation, and interpersonal-social networks of site engineers using a questionnaire that surveyed a dam project in Taiwan.
It was found that the
order-management network,
which is a goal-directed
and hierarchical
architecture, has the highest degree of social density among the three
because of abundant
resource infusion and institutional enforcement.
Priven and Sacks
(2015)
Test the hypothesis
that the LPS
engenders a social network among the subcontractors,
which enhances
coordination.
Twelve residential construction projects were studied using action research over periods from 7 to 16 months to measure the impact of the
LPS on social
networks.
Centrality degrees of trade crews rose significantly and the number of active essential communication channels roughly doubled when comparing projects
with low and high
planning best-practice index scores, showing that where the LPS is more thoroughly implemented,
social networks are
strengthened.
2.2 Benchmarking through Data Envelopment Analysis (DEA)
27
improved (Lai et al. 2011). One of the common techniques of benchmarking, introduced by Charnes et al. (1978), is DEA, which measure the productivity by the ratio between a weighted sum of inputs and a weighted sum of outputs. It uses operations research techniques to automatically calculate the weights assigned to the inputs and outputs of the production units being assessed (Kabnurkar 2001). DEA generates a surface, called “empirical frontier”, which connects the relatively best decision making units (DMUs) (the most efficient ones). The empirical frontier can be used as a reference for efficiency improvement.
2.2.1 DEA in Construction Industry: Identify Performance Benchmarks (Role Model)
28
2.3 Production Capacity Variability/Reliability and Construction Work
Plan Variation/Reliability
This section review the previous research studies on the production capacity variability and work plan variation.
2.3.1 Unstable Work Flow, Consequence of Work Plan Variation and Production Capacity Variability
Production capacity reliability simply means to make sure that adequate production capacities (resources such as labor, equipment and material) are available at the right time and the right place based on the planned task schedule (Thomas et al. 2002). A reliable production capacity means that there is no variability. When the production capacity of a crew is not reliable, the variability spreads out through the project work flow in the form of variation and increase instability of the work flow. Studies showed that unstable work flow has negative impact on labor productivity, schedule control, and project cost (Ballard 1993; Tommelein et al. 1999; Alarcón and Ashley 1999; Thomas et al. 2002; Linhard 2014 among others). Unforeseen conditions, lack of labor, equipment, or material, or under/overestimate the amount of work that is required to complete the tasks are common factors reducing the reliability of a work plan (increasing the variation) (Thomas and Flynn 2011, Hsieh 1998).
29
increase. Ballard (1994), by focusing on reliability improvement of construction work plans, created Last Planner System® (LPS), which is successfully implemented in construction project (Ballard 2000, Ballard and Howell 1998, Kim and Jang 2005, Liu and Ballard 2008)). Howell et al. (2001) suggested that productivity can increase up to 30% when reliability of work plan improves from 50 to 70%. Thomas et al. (2003) examined whether improving the reliability of the work plan improves the construction productivity. They concluded that more effort devoted to improving the reliability affects cost and schedule performance positively. González et al. (2007) conducted a research to understand how changes in work plan reliability levels impact the project performance during construction phase. They, throu gh statistical analysis, found that performance will improve when reliability is enhanced. Liu and Ballard (2008), through a pipe installation case study, demonstrated that reducing variability enhances labor productivity significantly.
2.3.2 Parade Game: Demonstrate the Impact of Variability in Construction Project
30
activity of processing units repetitively (totally 100 units need to be processed). Players are given a similar die, and the capacity of each crew in each week is determined by rolling the die. After the capacity of a crew is determined by rolling the die, it will pass the number of units equal to the number on the rolled die. If the crew does not receive enough units from its predecessor (i.e. player does not have enough units in his/her buffer), it passes whatever exists there (the smaller number of units passed along). The project (game) is complete when all 100 units pass the last player. The game shows that it is possible to shorten project duration and increase the throughput by reducing the variability in production capacity of crews.
31
Game enhancement, a few studies were also conducted attempting to increase the usability and increase the features of the Parade Game using computer modeling techniques (for example see Senior 2011).
2.3.3 Investment on Planning to Improve Construction Work Plan Reliability and Consequence
32
research using artificial neural networks, Wang and Gibson (2010) found that projects with better pre-project planning are more likely to have a better project performance at completion. Most of studies focused on the impact of planning at the preconstruction stage and the research addressing the consequence of additional planning efforts carried out during construction is limited.
2.4 Identified Gaps in the Body of Knowledge
2.4.1 Identified Gaps in Construction Research Pertaining to SNA Application
The following gaps have been identified in using SNA to resolve the construction related issues:
1. The basic definition of the term “relationship” in sociology refers to information exchange; most of the previous construction research with regard to social network focused on the information exchange or communication (see Table 2.1). There is also some research focused on the formal (contractual) relationships of the parties in the project (for example, West 2014). However, the research pertaining to the spatial social network of the crews in the jobsite during construction, as an informal underlying structure of construction project, is very limited. The construction industry lacks an appropriate method to quantify the influence of jobsite network on the project actors.
33
Since the frequency and severity of their relationship fluctuate over the course of the project, there is a need to consider the dynamic aspect of social network.
These gaps are addressed through Research Objectives 1 and 2.
2.4.2 Identified Gaps in Construction Research Pertaining to Benchmarking via DEA
The following gaps have been identified in construction research pertaining to benchmarking via DEA:
1. Although there are some research studies on “benchmarking” in the construction industry, most of the researchers attempted to find the best benchmarks at the level of construction companies (project manager level) while less attention has been paid to the issue of benchmarking and finding the improvement direction at the level of construction crews.
34
is much easier for it to traverse this way step by step and through setting reasonable targets.
These gaps are addressed through Research Objective 3.
2.4.3 Identified Gaps in Construction Research Pertaining to Capacity Variability/Reliability and Work Plan Variation/Reliability
The following gaps have been identified in construction research pertaining to capacity variability/reliability and work plan variation/reliability:
1. The previous research examined the impact of different levels of work plan reliability on project performance, mostly measuring the impact on the subsequent crews in the project task sequence (for example, see Tommelein 1999, Ballard 2000, Thomas et al. 2003, Gonzalez 2007 and 2010). The research pertaining to the social aspect of crews’ work plan variation/reliability is very limited. The impact of social network influences such as conformity and social learning on the work plan reliability and variation of crews in the scope of a construction project was not found in industry handbooks or publications.
35
Howell and Liu 2012). Furthermore, the consequence of variability reduction, or in other words, production capacity reliability improvement, by making additional effort on planning has not been studied in the previous research.
These gaps are addressed through Research Objectives 2 and 4.
2.4.4 Addressing the Identified Gaps
36
RESEARCH METHODOLOGY
CHAPTER 3
This chapter of the dissertation details the design of the work effort undertaken to deliver those objectives. Different case studies, data collection, analysis and modeling techniques are used to achieve each of the objectives of this research. Therefore, this chapter is divided into the four sections corresponding to the four research objectives.
3.1 Methodology to Achieve Research Objective 1, To Develop the Jobsite
Social Network of Construction Crews and Quantify its Impact on
Performance (a Case Study)
37
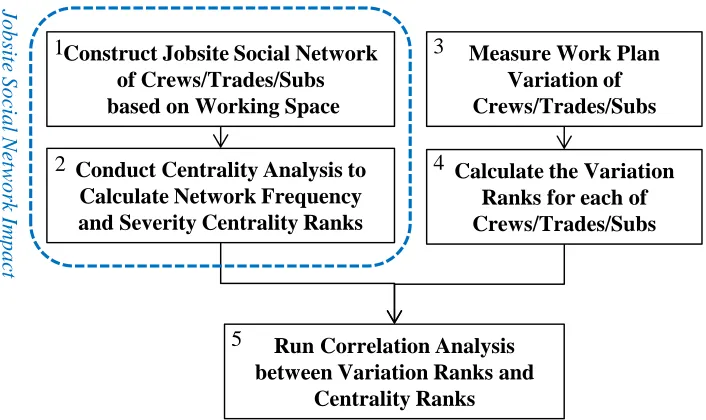
Figure 3.1. Methodology steps to achieve Research Objective 1
1. Construct jobsite social network of subcontractors based on working space: The social networks are constructed based on spatial proximity due to the desire to examine which crews were physically working together in a shared physical space. A social network consists of a set of vertices and ties between them. The crews are defined as the vertices and the ties among them indicate that if they are going to work in the same space at the same time. The required data for constructing a social network is collected and tabulated by an adjacency matrix (ASN). Two subcontractor crews are called adjacent/neighbor if they are connected by a tie in the network. Table 3.1 shows a schematic ASN. ASN represents the existing relationships, where the elements “aij“ and “aji“, called “line value”, indicates how
frequent the relationship or how strong the social network tie is between Subcontractor Crews i and j. ASN can be symmetric (aij = aji) or asymmetric (aij ≠ aji) depending on the
Calculate the Variation Ranks for each of Crews/Trades/Subs Construct Jobsite Social Network
of Crews/Trades/Subs based on Working Space
Measure Work Plan Variation of Crews/Trades/Subs
Conduct Centrality Analysis to Calculate Network Frequency and Severity Centrality Ranks
3 1
4
Run Correlation Analysis between Variation Ranks and
Centrality Ranks
2
5
Jobs
ite
Soci
al
N
et
w
ork
I
m
38
purpose of social network development. In the methodology implemented for the first objective, the networks are assumed to be asymmetric, because it is assumed that the influence of Crew i on j may not be necessarily as the same as the influence Crew j has on i.
Table 3.1: Schematic adjacency matrix (ASN) for relationships of subcontractor crews
Sub 1 Sub 2 … Sub j … Sub n
Sub 1 0 a12 … a1j … a1n
Sub 2 a21 0 … a2j … a2n
… … … … … … …
Sub i ai1 ai2 … aij … ain
… … … … … … …
Sub n an1 an2 … anj … 0
In the proposed method, instead of making a single social network for all the existing special relationships of the project, several networks are created; each represents the crews’ interferences for a time interval. Since the construction managers usually make their work plan on a weekly basis, a network is made for each week of the project to track the interdependencies with more accuracy. Thus, if two crews are supposed to work in the same working area in a week, there will be a tie between them in the jobsite social network cr eated for that week.
39
40
maximum cost of $10,000. These kinds of boundaries/scopes in defining the tasks lighten, if not eliminate, the inequality impacts of the crews’ operation. When there are no boundaries/scopes for making work plan, the weights can be adjusted according to the tasks’ characteristics to balance the inequality of the crews’ operation.
a. Frequency network b. Severity network
Figure 3.2. Schematic jobsite social network based on working space
41 𝐶𝐷−(𝑖) = ∑ 𝑥𝑖𝑗−
𝑁
𝑗
(3.1)
In Equation 3.1, 𝐶𝐷−(𝑖) is the node in-degree centrality for a binary network (the strength of all ties is assumed to be equal), i is the focal node, j shows all other nodes, N is the total number of nodes in the network, and x is the adjacency matrix of a binary network (𝑥𝑖𝑗− is 1 if there is a tie from Node j to i).
𝐶𝐷𝑤−(𝑖) = ∑ 𝑤
𝑖𝑗−
𝑁
𝑗
(3.2)
In Equation (3.2), 𝐶𝐷𝑤−(𝑖) is the weighted in-degree centrality for a weighted network, and w is the weighted adjacency matrix (𝑤𝑖𝑗− is greater than 0 if here is a tie from Node j to i and the value indicates the tie strength).
The weighted In-degree centrality of a crew represents the frequency and severity of the tasks performed by the other crews (neighbors) in the working area(s) the crew works (i.e., workload in the neighborhood). It indicates how much influence the crew receives from the network. For the frequency network shown in Figure 3.2.a, the weighted in-degree value is 2 for Crew A and 4 (=3+1) for Crew B. These numbers are 10 and 7 (=5+2) for the severity network (Figure 3.2.b) respectively.
42
Ballard et al. 2005, Wambeke et al. 2011, Hajifathalian et al. 2012). Four variables (Equations 3.3 to 3.6) are measured for each of the crews at each week over the course of the project as the indices of work plan variation (showed by “V” in the equations). By measuring
these four variation variables the performance level of crews was measured from both variation frequency and severity standpoints.
𝑉1: 𝑆𝑡𝑎𝑟𝑡 𝑇𝑖𝑚𝑒 𝑉𝑎𝑟𝑖𝑎𝑡𝑖𝑜𝑛 𝐹𝑟𝑒𝑞𝑢𝑒𝑛𝑐𝑦
= 𝑁𝑢𝑚𝑏𝑒𝑟 𝑜𝑓 𝑡𝑎𝑠𝑘𝑠 𝑛𝑜𝑡 𝑠𝑡𝑎𝑟𝑡𝑖𝑛𝑔 𝑜𝑛𝑡𝑖𝑚𝑒
𝑇𝑜𝑡𝑎𝑙 𝑛𝑢𝑚𝑏𝑒𝑟 𝑜𝑓 𝑝𝑙𝑎𝑛𝑛𝑒𝑑 𝑡𝑎𝑠𝑘 (3.3)
𝑉2: 𝑆𝑡𝑎𝑟𝑡 𝑇𝑖𝑚𝑒 𝑉𝑎𝑟𝑖𝑎𝑡𝑖𝑜𝑛 𝑆𝑒𝑣𝑒𝑟𝑖𝑡𝑦
= 𝑆𝑢𝑚𝑚𝑎𝑡𝑖𝑜𝑛 𝑜𝑓 𝑑𝑒𝑙𝑎𝑦𝑠 𝑖𝑛 𝑠𝑡𝑎𝑟𝑡𝑖𝑛𝑔 𝑡ℎ𝑒 𝑡𝑎𝑠𝑘𝑠 (𝑑𝑎𝑦𝑠)
𝑆𝑢𝑚𝑚𝑎𝑡𝑖𝑜𝑛 𝑜𝑓 𝑝𝑙𝑎𝑛𝑛𝑒𝑑 𝑡𝑎𝑠𝑘𝑠′𝑑𝑢𝑟𝑎𝑡𝑖𝑜𝑛 (𝑑𝑎𝑦𝑠) (3.4)
𝑉3: 𝐶𝑜𝑚𝑝𝑙𝑒𝑡𝑖𝑜𝑛 𝑇𝑖𝑚𝑒 𝑉𝑎𝑟𝑖𝑎𝑡𝑖𝑜𝑛 𝐹𝑟𝑒𝑞𝑢𝑒𝑛𝑐𝑦
= 𝑁𝑢𝑚𝑏𝑒𝑟 𝑜𝑓 𝑡𝑎𝑠𝑘𝑠 𝑛𝑜𝑡 𝑓𝑖𝑛𝑖𝑠ℎ𝑖𝑛𝑔 𝑜𝑛𝑡𝑖𝑚𝑒
𝑇𝑜𝑡𝑎𝑙 𝑛𝑢𝑚𝑏𝑒𝑟 𝑜𝑓 𝑝𝑙𝑎𝑛𝑛𝑒𝑑 𝑡𝑎𝑠𝑘 (3.5)
𝑉4: 𝐶𝑜𝑚𝑝𝑙𝑒𝑡𝑖𝑜𝑛 𝑇𝑖𝑚𝑒 𝑉𝑎𝑟𝑖𝑎𝑡𝑖𝑜𝑛 𝑆𝑒𝑣𝑒𝑟𝑖𝑡𝑦
= 𝑆𝑢𝑚𝑚𝑎𝑡𝑖𝑜𝑛 𝑜𝑓 𝑑𝑒𝑙𝑎𝑦𝑠 𝑖𝑛 𝑓𝑖𝑛𝑖𝑠ℎ𝑖𝑛𝑔 𝑡ℎ𝑒 𝑡𝑎𝑠𝑘𝑠 (𝑑𝑎𝑦𝑠)
𝑆𝑢𝑚𝑚𝑎𝑡𝑖𝑜𝑛 𝑜𝑓𝑝𝑙𝑎𝑛𝑛𝑒𝑑 𝑡𝑎𝑠𝑘𝑠′𝑑𝑢𝑟𝑎𝑡𝑖𝑜𝑛 (𝑑𝑎𝑦𝑠) (3.6)
4. Calculate the variation ranks for each of subcontractors: Each subcontractor crew is given a rank based on his/her variation variables’ value (totally four ranks based on the four variation variables).
43
consistency, using correlation analysis, between the influences each crew receives from the networks and its work plan variation is evaluated over the course of the project. The jobsite social network impact on the crews is measured by “centrality” (see Step 2). Work plan variation is used to indicate the crews’ performance (See Step 3). The correlation analysis is conducted to calculate the degree of association between the two (jobsite social network centrality and work plan variation).
3.2 Methodology to Achieve Research Objective 2, To Examine the Impact
of Social Conformity on the Performance of Construction Crews
Figure 3.3 shows the different steps of the methodology implemented to achieve the second objective. The proposed approach will demonstrate the impact of conformity, as one of the important social network influence, on the crews’ performance.
44
Fire Protection) over 15 months. Second case (Case Study 3) is the same as the project studied for the first objective, but the focus here is on only the main subcontractor crews of the project. As mentioned in the previous section, the project was a $50 million, 150,000 square foot construction project entailed the build-out of an existing warehouse building into a single level data center and white-space computer labs. The project included a general contractor overseeing multiple specialty subcontractors. For the purpose of Objective 2, seven main subcontractor crews of the project (Mechanical, Electrical, Concrete, Drywall, Painting, Steel Fabrication and Fire Protection) and their performance and interdependencies were studied. Construction ran from February through September 2010 and the project was studied from the beginning of March through completion at the end of September. The first three weeks of the project were not included in the study due to the limited scope and number of subcontractors involved during that period.
Figure 3.3. Methodology steps to achieve Research Objective 2
Identify WPRI Norm of Project
Construct Jobsite Social Network based on Working
Space Measure Work Plan
Reliability Index of Crews/Trades/Subs
Identify WPRI Norm of Neighborhood
1 3
2
Measure Deviation from Project Norm (DFPN)
4
5 Measure Deviation from
Neighborhood Norm (DFNN)
Conform to Local or Global?
6
7
G
loba
l C
onform
ity
Local
C
onf
ormit