Energy Needs, Consumption and Sources
Tamim Younos, Kimberly E. Tulou
Virginia Polytectnic Institute and State University UNIVERSITIES COUNCILON WATER RESOURCES JOURNALOF CONTEMPORARY WATER RESEARCH & EDUCATION
ISSUE 132, PAGES 27-38, DECEMBER 2005
E
nergy is needed in various stages of desalination. Energy consumption directly affects the cost-effectiveness and feasibility of using desalination technologies for drinking water production. This chapter presents energy types, use, methods of conservation, and the potential use of renewable energy resources for desalination. Some of the information provided in this chapter may not be applicable to today’s desalination energy issues. However, the information provides a comparison between costs associated with various energy sources as applied to desalination worldwide, and can be used as a reference for future energy development and use for desalination.Energy Needs and Consumption
Energy is needed in various stages of desalination. Desalination technologies use pumps in various stages of desalination, i.e., feedwater intake, treatment process, and discharge of product water and concentrate. Pumps consume a significant amount of energy. RO plants use pumps to pressurize feedwater passing through the membranes. Ion exchange plants use pumps to pass the feedwater over the resin, and use backwash pumps to clean and recharge resin beads. In electrodialysis, pumps pressurize feedwater to generate flow across the surface of the membranes. The amount of energy pumps consume depends on the type of process, the TDS concentration in the feedwater, the capacity of the treatment plant, the temperature of the feedwater, and the location of the plant with respect to the location of the intake water and concentrate disposal site.
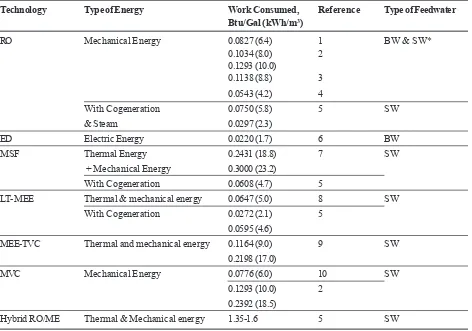
Each desalination technology is unique in design and mode of operation and it is rather difficult to compare energy consumption for different types of desalination technologies. Table 1 is a generalization of typical energy consumption for various technologies.
The energy consumption for reverse osmosis plants depends on the salinity of the feedwater and the recovery rate. Seawater reverse osmosis plants require higher amounts of energy due to the higher osmotic pressure of seawater compared to brackish water reverse osmosis plants. The osmotic pressure is related to the TDS concentration of the feedwater.
Electrodialysis plants use electric energy to desalt the water. For electrodialysis, the energy required is directly related to the TDS concentration in the water. Electrodialysis is economical only for brackish waters (TDS < 4000 mg/L).
Energy Conservation and Recovery
A system’s ability to conserve or recover energy is critical for implementing an economical desalination technology. The section below describes various energy conservation and recovery techniques.
Methods of Energy Conservation
Pelton impulse turbines (PIT) and hydraulic turbochargers (HTC) are the most widely used devices for energy conservation in desalination plants (Manth et al. 2003). Reverse running pumps may be found in older facilities, but these pumps are least effective for energy conservation.
Table 1. Energy Consumption for Various Desalination Technologies
Technology Type of Energy Work Consumed, Reference Type of Feedwater
Btu/Gal (kWh/m3)
RO Mechanical Energy 0.0827 (6.4) 1 BW & SW* 0.1034 (8.0) 2
0.1293 (10.0)
0.1138 (8.8) 3 0.0543 (4.2) 4
With Cogeneration 0.0750 (5.8) 5 SW & Steam 0.0297 (2.3)
ED Electric Energy 0.0220 (1.7) 6 BW MSF Thermal Energy 0.2431 (18.8) 7 SW
+ Mechanical Energy 0.3000 (23.2)
With Cogeneration 0.0608 (4.7) 5
LT- MEE Thermal & mechanical energy 0.0647 (5.0) 8 SW With Cogeneration 0.0272 (2.1) 5
0.0595 (4.6)
MEE-TVC Thermal and mechanical energy 0.1164 (9.0) 9 SW 0.2198 (17.0)
MVC Mechanical Energy 0.0776 (6.0) 10 SW 0.1293 (10.0) 2
0.2392 (18.5)
Hybrid RO/ME Thermal & Mechanical energy 1.35-1.6 5 SW
* RO can be used for BW or SW. Higher energy consumption is equated with SW. LT—Low temperature top Brine <194 oF BW—Brackish water SW—Seawater
Figure 1. Integration of RO with PIT
Source: Manth et al. 2003
the PIT to the motor. The feed pump is run at a constant speed and the pressure energy in the brine is used to rotate the PIT. As the turbine rotates, it converts the brine pressure energy to mechanical energy. The mechanical energy from the PIT is then directed to the motor shaft that, in turn, drives the feed pump. Therefore, the motor requires less energy
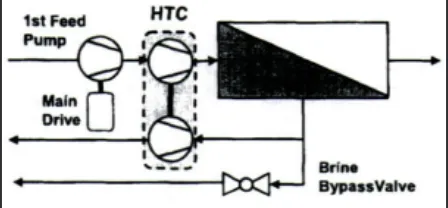
Figure 2 shows the integration of the hydraulic turbocharger (HTC) system into a reverse osmosis plant. The HTC serves as a feed pump and energy recovery turbine. The HTC directs any remaining pressure energy in the brine to feed pressure. Thus, it boosts the pressure of the feedwater and reduces the energy used by the first feed pump. The brine bypass valve is the control device for this system. This allows the amount of recovered energy to be managed in order to equate the energy used by the first feed pump and the added energy to the HTC with the appropriate pressure energy needed to push feedwater through the membrane.
of using a VFD-pump is a significant energy savings realized from the reduced pump horsepower requirement. With this arrangement, the turbine recovers as much energy as possible and the VFD pump compensates for a marginal energy need. The size of the VFD pump is decreased significantly making it much more affordable (Manth et al. 2003).
Control Mechanisms
Membrane systems operate best under continuous, constant conditions. However, the characteristics of the natural environment may not be constant; in fact, they are usually variable. Salinity and temperature of the feedwater can vary according to weather and seasonal changes. It is necessary to incorporate some type of control to maintain constant conditions. Control methods are of two types, energy dissipation and energy control. Energy dissipation techniques work by consistently applying extra energy to membrane pumps. If the salinity increases, the extra energy is used to increase the pressure of the feedwater to keep the flows constant through the membrane. All excess energy in the system is dissipated in order to keep the pressure constant. This method requires that more energy than is necessary is consistently applied to the system, which assures that there is never a lack of energy for the pumps. Obviously, this approach to dissipating excess energy is wasteful. Though it is capable of keeping the plant operations constant, it is not effective for conserving energy (Manth et al. 2003). The brine bypass valve is an example of an energy dissipation technique (Figure 2).
The energy control method uses variable frequency drive (VFD) pumps. These pumps use only as much energy as is needed, making it much less wasteful than the dissipation of energy technique. The use of VFD pumps is most desirable in facilities that have
highly variable operating conditions. The disadvantage to their use is high investment costs. These pumps are used in reverse osmosis and electrodialysis plants (Manth et al 2003).
Cogeneration Plants
It is becoming a common practice to combine power plants with desalination plants in order to reduce energy consumption. Combined power and desalination plants are called cogeneration plants. The typical power plant produces steam at high pressure and high temperature.This steam is expanded, and the pressure difference from the expansion drives the turbine to form mechanical energy, and then electrical energy (combustion turbine power generation cycle). The expanded steam is typically rejected from the power plant as waste. A cogeneration plant, however, uses this low-grade steam for desalination.
Cogeneration is beneficial to power plants and desalination plants. The power plant gains extra income by selling the waste steam to the desalination plant. The desalination plant does not have to pay for the construction and operation of its own boilers, thus also saving money. The desalination plant will use low-grade steam , which saves fossil fuel costs. A noted disadvantage of cogeneration plants is that the energy demand varies and the power plant’s power generation is not constant, which has an impact on the desalination plant unless mitigation methods are applied to limit this impact. Researchers report that cogeneration can achieve cost savings (Darwish and Al-Najem 2000, Hung et al. 2003).
Co-Located Plants
In this process, a seawater reverse osmosis (SWRO) plant is co-located with a power plant. In general, coastal power plants draw large volumes of cooling water directly from the ocean. A co-located SWRO plant draws heated seawater from the power plant’s cooling water loop as feedwater for RO and then discharges the concentrate stream into the power plant’s cooling water outflow (Alspach and Watson 2004). Because the SWRO facility “piggybacks” on the existing cooling water loop, it can substantially reduce construction and operating costs. It also provides a method for diluting the SWRO brine stream before it is discharged into the ocean. A co-located SWRO plant has the advantages of a cogeneration plant. Also, with co-located plants,
Figure 2. Integration of RO with HTC
because of higher water temperature, less energy is needed. The disadvantage of the co-located plant is that it entirely depends on the power plant for its existence.
Hybrid Plants
Hybrid plants use a combination of treatment technologies—such as using RO and thermal technologies simultaneously—to take advantage of benefits of different treatment technologies. This enables the system to reuse energy, reduce energy costs, and achieve optimized performance (Van der Bruggen and Vandecasteele 2002, Cardona et al. 2002). The necessity for a hybrid facility can be considered on a case-by-case basis.
Case Studies of Energy Conservation
The following case studies describe how turbines, cogeneration and hybrid plants reduce energy consumption in desalination plants.
Cape Hatteras, North Carolina has operated a hybrid RO/Ion exchange plant since 2000. This desalination plant withdraws water from separate wells with different water properties. The high salinity water from well 1 is processed by the RO and the water with high organic material from well 2 is processed by Ion Exchange. The treated water from the RO and Ion exchange processes are blended for the final product water. This plant has incorporated an energy recovery turbine (Turbo supplied by Pump Engineering) into the RO treatment process. The expected payback at the power rate of $0.04/1000 Btu ($0.12/kWh) is 4.5 years (Duranceau 2001).
Studies in Kuwait compared two gas turbines with different combinations of heat recovery (Darwish and Al-Najem 2000). For a simple gas turbine power
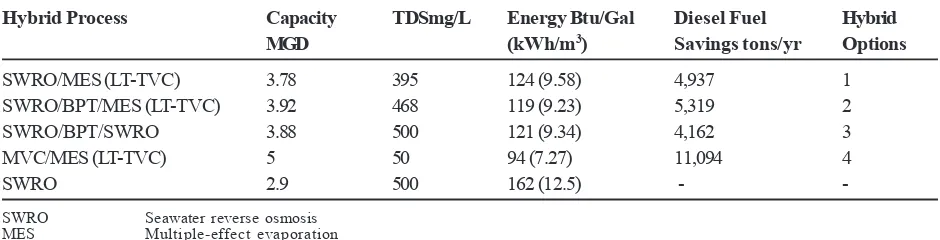
Table 2. Comparison of different hybrid facilities
Hybrid Process Capacity TDSmg/L Energy Btu/Gal Diesel Fuel Hybrid
MGD (kWh/m3) Savings tons/yr Options
SWRO/MES (LT-TVC) 3.78 395 124 (9.58) 4,937 1 SWRO/BPT/MES (LT-TVC) 3.92 468 119 (9.23) 5,319 2 SWRO/BPT/SWRO 3.88 500 121 (9.34) 4,162 3 MVC/MES (LT-TVC) 5 50 94 (7.27) 11,094 4 SWRO 2.9 500 162 (12.5) -
-SWRO Seawater reverse osmosis MES Multiple-effect evaporation BPT Back pressure turbine
MVC Mechanical vapor compression
LT-TVC Low temperature - Thermal vapor compression Source: Aly 1999
plant operating in cogeneration with reverse osmosis, the fuel energy consumption is 39.9 Btu/lb (92.78 kJ/kg). If a heat recovery steam generator is added to each gas turbine, supplying MSF units with recovered steam, the energy consumption is lowered to 37.4 Btu/lb (86.88 kJ/kg). If a condensing steam turbine and a heat recovery steam generator are added to each gas turbine, the energy consumption is further decreased to 27.4 Btu/lb (63.6 kJ/kg). This study shows how different combinations of turbines and technologies affect energy consumption.
Another study, conducted in several Middle Eastern cities, investigated different plant arrangements operating from the waste heat of a gas turbine power plant (Aly 1999). In this study, low-temperature thermal vapor compression (LT-TVC) heat pumps were used to boost the gas turbine performance, because of their ability to recover energy in the form of heat. Table 2 compares RO (no hybrid used) energy consumption with four different hybrid combinations (Aly 1999). All four options proved to be better, economically, than SWRO alone. Option 4 (MVC/MES) proved to be the most energy saving combination, in which the thermal efficiency increased 55.9 percent when compared with SWRO. This option included mechanical vapor compression with multiple-effect distillation and low-temperature thermal vapor compression. In option 3, the thermal efficiency increased 55.9 percent when compared with SWRO. It was the only process that did not incorporate the vapor compression heat recovery in its design.
plant’s performance after the plant was running for six years (Rayan et al. 2002). The energy consumption in this plant amounted to 35-60 percent of the total production costs, but the recovered mechanical energy reduced the required pump energy. Overall, it reduced costs (Rayan et al. 2002).
Renewable Energy Sources for
Desalination
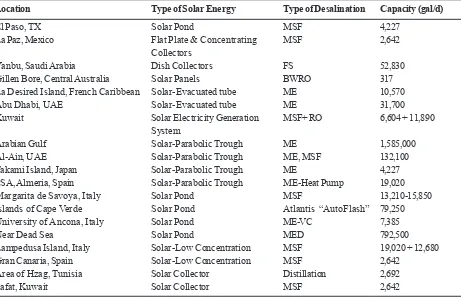
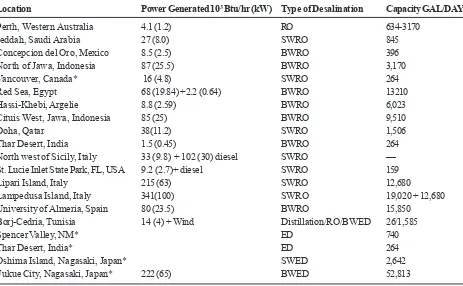
The most common renewable energy sources are solar, wind, geothermal, and ocean. At present, uses of renewable energy sources for desalination are very limited. The world’s share of total renewable energy sources used for desalination is only about 0.02 percent of the total energy used (Garcia-Rodriquez 2002). However, renewable energies have potential for powering future desalination plants. Tables 3-5 list desalination plants in various countries that use renewable energies (solar, photovoltaic, and wind) found in existing literature. Desalination powered by renewable energies can be an ideal solution for some small communities where an affordable fossil fuel supply for desalination is not available.
Solar Energy
Solar energy is a promising renewable energy source to power desalination plants. Solar energy can be used directly for simple distillation or indirectly through the use of collectors.
Direct Solar Energy. Solar stills take advantage of direct solar energy via the greenhouse effect. The process is as follows. A black-painted basin, sealed tightly with a transparent cover, stores the saline water. As the sun heats the water, the basin water evaporates and vapor comes into contact with the cool glass ceiling where it condenses to form pure water (Bouchekima 2002). The water is drained from the solar still for potable use. The maximum efficiency of solar stills is 35 percent of the energy entering the still effectively utilized to evaporate the water (Kalogirou 1997). This technology is optimized when running at capacities of near 200 gal/d. Using heat recovery devices and hybrid systems may make solar stills more cost-competitive (Manwell and McGowan 1994). Research has indicated that multiple-effect stills increase water production by 40-55 percent when stacked in a vertical
arrangement (Kalogirou 1997, Boukar and Harmim 2003). Solar stills require large amounts of land and can only handle small quantities of water. They are not a viable option for most areas in the U.S. (Bouchekima 2002).
Indirect Solar Energy. MSF and MEE
technologies use solar collectors as an indirect means of solar energy to develop the thermal energy needed to drive the desalination process. Other applicable technologies using indirect solar energy are RO, vapor compression, and freeze desalination. Solar collectors have been used successfully in Saudi Arabia for freeze separation technologies. The steam created from the solar collectors drives a steam turbine that provides power to a vapor compression system. Energy in the exhaust steam from the turbine provides refrigeration for the freezing (Manwell and McGowan 1994).
Photovoltaic. Currently, the most promising solar energy technology is photovoltaic (PV) arrays. Photovoltaic arrays convert solar energy into electricity through the transfer of electrons. The arrays are made of silicon chips. Silicon is the best material for generating the transfer of electrons. When sun rays shine on the silicon chips, the electrons jump to another orbit. This movement then creates a voltage that can be used to power pumps for desalination, mostly for membrane technologies (Garcia-Rodriquez 2002).
Hundreds of small photovoltaic power plants have been developed. Reverse osmosis systems connected to photovoltaic plants are already commercialized and considered the most promising combination of solar energy with desalination (Thomson and Infield 2002). Also, some pilot plants have been developed to study electrodialysis with PV cells (Garcia-Rodriquez 2002). Some disadvantages of PV systems include low efficiency (typically ranging from 10-15 percent), high manufacturing costs, the requirement of large arrays for RO systems, and the general use of lead-acid batteries (Garcia-Rodriquez 2002, Thomson and Infield 2002).
Solar Energy Concentrators and Collectors.
rays of sun and maintains the focus of the reflection on the mirrors to a focal point. It alters itself according to the position of the mirrors to the sun, since this position changes throughout the day. Concentrated light is directed to pipes filled with air or water in order to create steam or heated air that can be used for power (Manwell and McGowan 1994). An alternative technique is using flat plates to collect low-intensity radiation. Flat plate collectors are well adapted to absorb diffused radiation opposed to concentrated radiation and can produce low-grade thermal energy. The main disadvantage of a flat plate collector is the requirement for large amounts of space (Manwell and McGowan 1994).
Parabolic trough radiation collectors are another option. These collectors are able to withstand high temperatures without degradation of the collector efficiency and for this reason are preferred for solar steam generation (Kalogirou 1998). Solar ponds can also be used as radiation collectors. Research has shown that a solar pond is able to preheat the intake water (Safi 1998). Some researchers consider solar pond-powered desalination one of the most cost-effective methods (Garcia-Rodriquez 2002).
Table 3. Desalination Plants Incorporating Solar Energy
Location Type of Solar Energy Type of Desalination Capacity (gal/d)
El Paso, TX Solar Pond MSF 4,227 La Paz, Mexico Flat Plate & Concentrating MSF 2,642
Collectors
Yanbu, Saudi Arabia Dish Collectors FS 52,830 Gillen Bore, Central Australia Solar Panels BWRO 317 La Desired Island, French Caribbean Solar-Evacuated tube ME 10,570 Abu Dhabi, UAE Solar-Evacuated tube ME 31,700 Kuwait Solar Electricity Generation MSF+ RO 6,604 + 11,890
System
Arabian Gulf Solar-Parabolic Trough ME 1,585,000 Al-Ain, UAE Solar-Parabolic Trough ME, MSF 132,100 Takami Island, Japan Solar-Parabolic Trough ME 4,227 PSA, Almeria, Spain Solar-Parabolic Trough ME-Heat Pump 19,020 Margarita de Savoya, Italy Solar Pond MSF 13,210-15,850 Islands of Cape Verde Solar Pond Atlantis “AutoFlash” 79,250 University of Ancona, Italy Solar Pond ME-VC 7,385 Near Dead Sea Solar Pond MED 792,500 Lampedusa Island, Italy Solar-Low Concentration MSF 19,020 + 12,680 Gran Canaria, Spain Solar-Low Concentration MSF 2,642
Area of Hzag, Tunisia Solar Collector Distillation 2,692 Safat, Kuwait Solar Collector MSF 2,642
Sources: Harrison et al. 1997, Garcia-Rodriquez 2002
One recent design takes advantage of the heat storage capacity of air. Solar heat is used to heat air, which becomes humidified when cooling water is injected into it. When the humid air is cooled, the water is separated from the salts. This process has not been developed commercially and is still being researched (Chafik 2002). Other research focuses on optimizing systems so that solar panels are sized appropriately and battery storage is not needed (Thomson,and Infield 2002), as well as using solar energy to power smaller system heat pumps such as absorption vapor compression (Garcia-Rodriquez 2002).
Wind Energy
Wind energy rotates wind turbines and creates mechanical energy that can be converted to electrical energy. Wind turbines come in both vertical axis arrangements, and multiple axis, horizontal arrangements. Turbines utilizing wind energy for low power (34 –341 103 Btu/hr or
10-100 kW), medium power (341 – 1707 103 Btu/hr or
100 kW-0.5 MW), and high power (> 1707 103 Btu/
Table 5. Desalination Plants Incorporating Wind Energy
Location Power Generated 103 Btu/hr (kW) Type of Desalination Capacity gal/d
Shark Bay, Western Australia 109 (32) BWRO 44,380 & 34,340 Island in North Sea 20 (6) SWRO 1,600
Borj-Cedria, Tunisia RO + ED Island of St. Nicolas, West France RO
Fuerteventura Island, Spain RO 14,794
Middle East RO 6,604
Drepanon, Achaia RO
Ile du Planier, France Pacific Islands RO 3,170 Helgoland, Germany RO 6,086,000 Island of Drenec, France 34 (10) RO
Borkum Island, North Sea MVC 1,902-12,680 Ruegen Island, Germany 683 (200) MVC 31,700-79,250 Gran Canaria, Spain RO 52,830
Sources: Harrison et al. 1997, Garcia-Rodriquez 2002
Table 4. Desalination Plants Incorporating Photovoltaic Energy
Location Power Generated 103 Btu/hr (kW) Type of Desalination Capacity GAL/DAY
Perth, Western Australia 4.1 (1.2) RO 634-3170 Jeddah, Saudi Arabia 27 (8.0) SWRO 845 Concepcion del Oro, Mexico 8.5 (2.5) BWRO 396 North of Jawa, Indonesia 87 (25.5) BWRO 3,170 Vancouver, Canada* 16 (4.8) SWRO 264 Red Sea, Egypt 68 (19.84) +2.2 (0.64) BWRO 13210 Hassi-Khebi, Argelie 8.8 (2.59) BWRO 6,023 Cituis West, Jawa, Indonesia 85 (25) BWRO 9,510 Doha, Qatar 38(11.2) SWRO 1,506 Thar Desert, India 1.5 (0.45) BWRO 264 North west of Sicily, Italy 33 (9.8) + 102 (30) diesel SWRO — St. Lucie Inlet State Park, FL, USA 9.2 (2.7)+ diesel SWRO 159 Lipari Island, Italy 215 (63) SWRO 12,680
Lampedusa Island, Italy 341(100) SWRO 19,020 + 12,680 University of Almeria, Spain 80 (23.5) BWRO 15,850
Borj-Cedria, Tunisia 14 (4) + Wind Distillation/RO/BWED 26/1,585 Spencer Valley, NM* ED 740 Thar Desert, India* ED 264 Oshima Island, Nagasaki, Japan* SWED 2,642 Fukue City, Nagasaki, Japan* 222 (65) BWED 52,813
* Pilot or Demonstration Plants
Sources: Manwell and McGowan 1994, Garcia-Rodriquez 2002
In the United States, wind currents are strongest in the central states and along the coasts of Alaska and New England, as well as parts of California. The global trend shows stronger currents in coastal areas (Mustoe 1984, Belessiotis and Delyannis 2000).
operate using direct wind energy (Garcia-Rodriquez 2002). Using direct wind energy to power RO systems is limited because RO systems do not operate well under non-continuous conditions. Table 5 shows a list of desalination plants around the world that are powered by wind energy.
Some researchers have studied the potential of hybrid wind/diesel and hybrid solar/wind plants. In the wind/diesel case, the wind power is transferred to the shaft of the diesel generator, thus reducing the fuel needed for the generator to work at a constant load. These systems can maintain a constant load, a solution for the intermittent nature of wind energy. For the solar/wind case, distillation devices can be used to desalt water; the solar energy can provide needed thermal energy and the wind turbines can provide needed mechanical energy. Hybrid renewable energy systems have been researched at the University of Massachusetts and the Center for Renewable Energy Systems in Greece (Manwell and McGowan 1994).
Geothermal Energy
Heat energy exists at depths of hundreds and even thousands of feet below the surface of the earth. In the inner core of the earth, the temperature ranges from 6,700 °F to 11,000 °F. Geothermal energy resources exist in three forms: thermal, hydraulic, and methane gas. Geothermal energy can be harnessed and applied to produce electricity that is sent to local grids, or to directly power thermal desalination plants. Today, the world’s power capacity from geothermal energy is 20.5 x 10⁹ Btu/
hr (6000 MW) used for electricity and 51.2 x10⁹
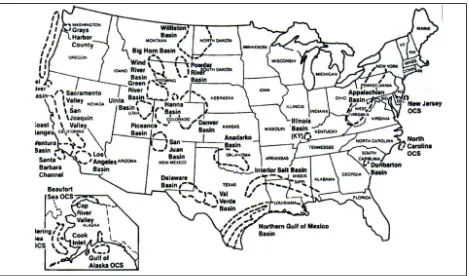
Btu/hr (15,000 MW) used for space heating (Belessiotis and Delyannis 2000). Geothermal power plants exist in New Zealand, Mexico, Japan, Iceland and the United States. Reykjavik, the capital of Iceland, uses geothermal energy to provide 99 percent of its heating energy needs (Garcia-Rodriquez 2002). The U.S. retrieves 0.2 percent of its power through this method. Figure 3 shows geothermal basins in the United States.
Currently, 99 percent of geothermal energy in the U.S. is produced in three sites in California: Geysers north of San Francisco, the China Lake in Los Angeles, and the Imperial Valley north of Los Angeles (Wiser 2000). There is a great potential for developing geothermal energy sources in other parts of the United States. According to the U.S.
Geological Survey, power amounts ranging from 79 x109 Btu/hr to 819 x 109 Btu/hr (23,000 MWe to
240,000 MWe) can be attained from geothermal resources in areas around the Gulf of Mexico for the next 30 years. Application of geothermal resources to desalination has not yet been practiced. Greece is planning a desalination plant to use geothermal energy (Garcia-Rodriquez 2002).
Ocean Energy
The category of ocean energy can be divided into tidal energy, wave energy, and ocean thermal energy conversion (OTEC) methods. Tidal power is the most-developed technology in this category.
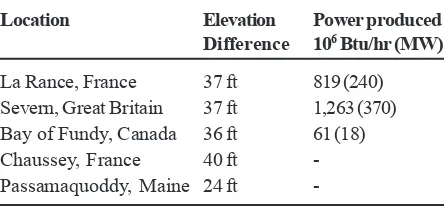
Tidal Power. Tidal energy takes advantage of the hydraulic head difference between low tide and high tide. Typically, elevation differences from low to high tide are between 4 ft. and 6 ft. In certain areas of the world, elevation differences are much greater. In these areas, power plants have been or can be installed to take advantage of the large differences in hydraulic head that occur there. Table 6 shows a few examples of tidal power plants (Belessiotis and Delyannis 2000).
Because tidal movements occur only at certain periods throughout the day, the energy is not constant. Therefore, when attaining energy from tidal changes, the energy must be stored on some sort of community power grid so that it can be accessed as needed. Tidal energy plants have an approximate efficiency of 20 percent; only this proportion of the tidal energy is available as usable energy. Tidal power plants are three times as expensive as coal power plants.
Wave Energy. Waves develop because of wind interacting with water. The energy held in waves can be converted to useful energy. The monthly
Table 6. High Tidal Differences and Power Generated
Location Elevation Power produced
Difference 106 Btu/hr (MW)
-average wave power is a function of the height of the waves and can be measured by using the average height of the highest third of all waves. In Santa Cruz, California the average wave height is 7.9 ft, which gives them total wave energy potential equal to 88,764 Btu/hr per foot of coastline (26 kW per meter of coastline) (Kim 1997). In the best locations, wave energy can provide as much as 238,980 Btu/ hr per foot of coastline (70 kW per meter of coastline) (Crerar and Pritchard 1991).
There are different devices for recovering energy from the waves. These devices can be categorized into heaving, heaving and pitching, pitching, oscillating water columns, and surging. A pilot desalination plant in Coffin Island, Puerto Rico incorporates heaving technology using a hose and a buoy. The movement of the buoy with the waves drives the pump. This mechanism is able to convert wave energy to mechanical energy that is used to drive the 350 gal/d reverse osmosis plant (Kim 1997). A seawater desalination study tested a vapor compression technology combined with a pitching device able to harness wave energy (Crerar and Pritchard 1991). The waves put a device called a “duck” in motion. This drives a large fluid piston at wave frequencies of (0.1-0.2 Hz). Higher-pressure vapor is condensed
in a falling film evaporator/condenser. A portion of the seawater vaporizes as a result of this heat exchange. The vapor spaces alternate between compression and expansion according to the up and down “nods” of the “duck.” The research showed that using this method could desalinate 0.255 MGD of water (Crerar and Pritchard 1991).
Ocean Thermal Energy Conversion. The ocean thermal energy conversion (OTEC) technique uses the temperature difference between the warmer surface water of the ocean and the cooler deep ocean water. The temperature difference is used to alternately condense and evaporate a working fluid, thus generating water volume and pressure changes that can rotate turbines and produce electricity (Heydt 1993).
The main problem with ocean thermal energy is the relatively small temperature differences found between surface water and deep ocean water. Another problem is the depths at which cooler water is found, which requires large volumes of water to be pumped. These facilities need to either have long, large seawater pipes, or a floating platform. Ocean thermal energy has a maximum efficiency of 7 percent and is generally around 2 percent. It is also
Figure 3. Geopressured Basins in the United States
about three times more expensive than coal energy (Wiser 2000).
The tropics are potential areas under consideration for developing and using this type of energy. In the tropics, ocean temperatures can reach anywhere from 40° F to 75° F (Wiser 2000). Nauru, an independent island nation, used OTEC to produce 102,420 Btu/hr (30 kW) net power for the island, until the power plant was damaged in a storm. The project is continuing with designs for 3.4 x 10⁶ Btu/
hr (1 MW) and 341 x 106 Btu/hr (10 MW) facilities
(Heydt 1993). Also, a 170,700 Btu/hr (50 kW) power demonstration plant in the Hawaiian Islands is studying the harnessing of thermal ocean gradients. Other research and development is occurring in the UK, France, the Netherlands, and Japan. In the U.S., the Solar Energy Research Institute, along with the National Renewable Energy Laboratory, U.S. Department of Energy is researching OTEC design. The combination of OTEC with desalination has been considered (Heydt 1993). This facility would be an open-cycle configuration that uses seawater as the working fluid. Some of the seawater is flashed into vapor at low pressure. This removes the salts from the seawater, producing potable water. Also, another option is a hybrid process using seawater and another fluid such as ammonia. In this process, seawater is flashed into steam and condensed to form potable water. The other fluid is incorporated into the evaporation and condensation process in such a way that the phase change of the seawater/ ammonia mixture is able to drive a low-pressure turbine (Heydt 1993).
Energy Storage and Control Options
A major disadvantage of renewable energies is the lack of continuity and consistency in the supply. To compensate, some sort of control system or energy storage unit is required, especially if no backup energy is available.
Batteries are one option for storing energy, but they are not preferred because of their short lifetimes; in addition the large number of batteries that would be needed to store the required energy could be very costly. Another method for storing energy is connecting renewable energy sources to diesel generators or electricity grids that power the desalination plant. With this method, fuel consumption can be reduced, but generally more
maintenance will be required and problems will develop if there is a fuel shortage (Miranda and Infield 2002). For intermittent wind energy supply, turbine de-rating mechanisms can be used to control the rotation angle of the turbine blades. Turbine de-rating mechanisms maneuver the pitch of the blades according to the power being supplied and the current water demand. The rotation angle of the blades determines the amount of mechanical energy produced which is often a very expensive option (Miranda, and Infield 2002).
Nuclear Energy
Using nuclear energy to power desalination plants is a developing technology. Currently, research is being conducted to determine the feasibility of developing dual-purpose power and desalination plants.
Nuclear power plants generate power using the concept of fission, i.e., energy is released when a larger atom splits into smaller atoms. The released energy is controlled and contained to heat a coolant material and ultimately generates steam that drives turbines, which rotate a coil in a magnetic field to produce electricity. The main components of a nuclear power plant are the fuel rods that hold the fissionable material, the moderator material that controls the speed of the neutrons, the control rods that absorb the neutrons to control the rate of the reaction, and the coolant that absorbs the heat that is passed onto the turbines (Wiser 2000).
Combining nuclear power plants with desalination plants is economical because two-thirds of thermal power generated is waste heat (Nisan et al. 2002). Typically, this waste heat is sent to surrounding waters or air. Researchers have found that it is economical to send this heat to desalination plants instead. In addition, power plants are able to provide immediate electricity to the desalination plant.
are South Korea, Russian Federation, Argentina, Canada, France, and China. Morocco and Egypt are also conducting studies. A desalination plant in southeast India that began operating in 1998 produced 10 MGD of freshwater in 2003. It is a hybrid MSF-RO demonstration plant coupled to a pressurized water reactor at Madras Atomic Power Station in Kalpakkam (Konishi et al. 2002).
A project called EURODESAL incorporated researchers from different countries and backgrounds to study nuclear powered desalination as compared with fossil fuel powered desalination facilities. It also compared reverse osmosis technologies with distillation technologies. The results from this study showed that even under the most unfavorable circumstances, the nuclear power plant/desalination plant proved more economical than the fossil fuel power plant/desalination plant. It also determined that using preheated water with the reverse osmosis technology was the cheapest technology to use, independent of the power plant it is connected with. They noted that the cost decreased as the capacity of the plant increased (Nisan et al. 2002).
There are many factors to weigh when considering nuclear energy. It creates no air pollution; therefore, it does not contribute to greenhouse effect concerns. However, it operates at low efficiency, and generates nuclear waste. Storing nuclear waste is a problem because of its extremely long decay time. At present, nuclear energy power plants are not cost-effective in the United States because of the strict regulations imposed by the federal government after the Chernobyl accident. The last order for construction of a nuclear power plant was in 1978 (Wiser 2000). Other countries are much more accepting of nuclear power. In France, there are 58 PWR plants making up 76.6 percent of the countries’ total electricity supply (Nisan et al. 2002).
Author Bio and Contact Information
TAMIM YOUNOS is a senior research scientist and interim director
in the Virginia Water Resources Research Center at Virginia Tech. His educational background is in Civil and Environmental Engineering (doctoral degree, the University of Tokyo) with research and teaching interests in environmental hydrology, water source protection, and water supplies and waste management in rural environments. Recently, he authored a report on the feasibility of implementing desalination to supplement freshwater supplies in eastern Virginia. He can be reached at:
Virginia Polytechnic Institute and State University, 10 Sandy Hall, Blacksburg, VA 24061-0444. (540) 8039; Fax: 231-6673; [email protected].
KIMBERLY E. TULOU is a graduate student in the Charles Via
Department of Civil and Environmental Engineering at Virginia Tech. She was a research assistant in the Virginia Water Resources Research Center at Virginia Tech when this article was prepared.
References
Al-Shammiri, M., and M. Safar. 1999. Multi-Effect Distillation Plants: State of the Art. Desalination 126:45-59.
Alspach, B., I. Watson. 2004. Sea Change. Civil Engineering
Vol. 74(2):70-75.
Aly, S. E. 1999. Gas Turbine Total Energy Vapour Compression Desalination System. Energy and Conversion Management
40:729-741.
Belessiotis, V. and E. Delyannis. 2000. The History of Renewable Energies for Water Desalination. Desalination
128:147-159.
Bouchekima, B. 2002. A Solar Desalination Plant for Domestic Water Needs in Arid Areas of South Algeria. Desalination:
153:65-69.
Boukar, M., and A. Harmim. 2003. Development and Testing of a Vertical Solar Still. Desalination 158(Boukar):179. Cardona, E., S. Culotta, A. Piacentino. 2002. Energy Saving
with MSF-RO Series Desalination Plants.” Desalination
153:167-171.
Chafik, E. 2002. A New Seawater Desalination Process Using Solar Energy. Desalination 153:25-37.
Crerar, A. J., and C. L. Pritchard. 1991. Wavepowered Desalination: Experimental and Mathematical Modeling.
Desalination and Water Re-Use. Proc. Twelfth International Symposium, Miriam Balaban, ed., Institution of Chemical Engineers, 391-398.
Darwish, M. A., and Najem Al-Najem. 2000. Cogeneration Power Desalting Plants in Kuwait: A New Trend with Reverse Osmosis Desalters.” Desalination 128: 17-33.
Darwish, M. A., N. M. Al-Najem. 2000. Energy Consumption by Multi-Stage Flash and Reverse Osmosis Desalters.”
Applied Thermal Energy 20:399-416.
Duranceau, S. J. 2001. Membrane Practices for Water Treatment.
American Water Works Association, 589.
El-Dessouky, H. T. and H. M. Ettouney. 2002. Fundamentals of Salt Water Desalination. Department of Chemical Engineering, College of Engineering and Petroleum, Kuwait University: Elsevier, Amsterdam, 148-452.
Garcia-Rodriquez, Lourdes. 2002. Seawater Desalination Driven by Renewable Energies: A Review. Desalination 143:103-113. Hess, G., O. J. Morin. 1992. Seawater Desalting for Southern California: Technical and Economic Considerations.
Desalination 87:55-68.
Harrison, D. G., G. E. Ho, K. Mathew. 1997. Desalination using renewable energy in Australia. WREC, 509-513. Heydt, G. T. 1993. An Assessment of Ocean Thermal Energy
Conversion as an Advanced Electric Generation Methodology. IEEE Journal of Solid-State Circuits, 109.
Hung, T. C., M. S. Shai, and B. S. Pei. 2003. Cogeneration Approach for Near Shore Internal Combustion Power Plants Applied to Seawater Desalination. Energy Conversion & Management 44:1259-1273.
Kalogirou, S. 1998. Parabolic-trough collectors. Applied Energy
60:65-68.
Kalogirou, S. 1997. Survey of Solar Desalination Systems and System Selection. Energy 22:69-81.
Kim, Y. C. 1997. Assessment of California’s Ocean Wave Energy Recovery. California and the World Ocean: Taking a Look at California’s Ocean Resources. Conference Proceedings
1:175-182.
Konishi, T. and B. M. Misra. 2002. Tapping the Oceans.”
Nuclear Engineering International 47: 36-37.
Lunis, B. C. 1990. Geopressured-Geothermal Direct Use Developments. Geothermal Resources Council Transactions 14 part 1, 531-536.
Mandani, F., H. Ettouney, and H. El-Dessouky. 2000. LiBr-H20 Absorption Heat Pump for Single-Effect Evaporation Desalination Process. Desalination 128:161-176.
Manth, Thomas, M. Gabor, E. Oklejas, Jr. 2003. Minimizing RO Energy Consumption Under Variable Conditions of Operation. Desalination 157:9-21.
Manwell, J. F. and J. G. McGowan. 1994. Recent Renewable Energy Driven Desalination System Research and Development in North America. Desalination 94:229-241.
Meller, Floyd. H. 1984. Electrodialysis-Electrodialysis Reversal Technologies. Ionics Incorporated, 60.
Miranda, M. S. and D. Infield. 2002. A Wind-Powered Seawater Reverse-Osmosis System Without Batteries. Desalination
153:9-16.
Mustoe, J. E. H. 1984. An Atlas of Renewable Energy Sources in the United Kingdom and North America. John Wiley & Sons. Chichester.
Nisan, S., G. Caruso, J. R. Humphries, G. Mini, et al. 2002. Sea-water Desalination with Nuclear and other Energy Sources: Tthe EURODESAL Project. Nuclear Engineering and Design 221:251-275.
Rayan, Magdy A., and I. Khaled. 2002. Seawater Desalination by Reverse Osmosis (case study). Desalination
153(2002):245-251.
Safi, M. J. 1998. Performance of a Flash Desalination Unit Intended to be Coupled to a Solar Pond. Renewable Energy
14:339-343.
Thomson, M. and D. Infield. 2002. A Photovoltaic-Powered Seawater Reverse-Osmosis System without Batteries. Desalination 153:1-8.
Van der Bruggen, Bart and Vandecasteele, Carlo. 2002. Distillation vs. Membrane Filtration: Overview of Process Evolutions in Seawater Desalination. Desalination 143: 207-218.
Wade, Neil M. 2000. Distillation Plant Development and Cost Update. Desalination 136: 3-12.